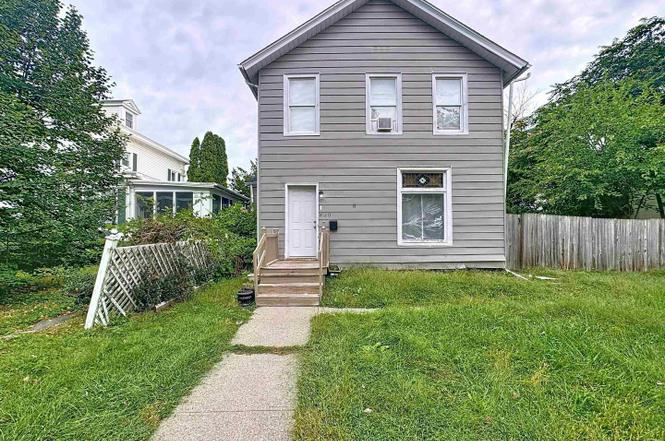
420 Kirkwood Blvd Blvd · Davenport, IA
Flood risk 1/10 · Minimal
- FEMA flood zone
- X (unshaded)
- Chance of flooding over 30 yrs
- 0.0%
- Est. flood insurance / yr
- $473 – $860
Fire risk 1/10 · Minimal
- Est. fire insurance / yr
- $902 – $1,676
Heat risk 3/10 · Minor
- Hot days now (above 103°F)
- 7 days/yr
- Hot days in 30 yrs
- 16 days/yr
Wind risk 2/10 · Minimal
- Chance of severe wind over 30 yrs
- —
Air-quality risk 3/10 · Minor
- Unhealthy air days now
- 2 days/yr
- Unhealthy air days in 30 yrs
- 3 days/yr
Risk factors via First Street. Map © Google.
Why this score? — see what drove the B+ grade
The composite is a weighted blend of 9 inputs, each scored 0–100. Each bar is that input's sub-score; the figure is the points it added to the 100-point composite (weight × sub-score).
- Cash flow +30.0/30.0
- ARV discount +15.0/15.0
- 1% rule +10.0/10.0
- DSCR +10.0/10.0
- Livability +4.0/5.0
- Schools +3.9/10.0
- Rent growth +3.6/5.0
- Condition / age +2.5/5.0
- Appreciation +0.0/10.0
$74,900
🖨 Deal sheet (PDF) 📄 Offer letter ✓ Due diligence
Listing remarks MLS
Check out this newly listed Davenport home, featuring 3 spacious bedrooms and 1.5 bathrooms, this home is ready for its new owner. Recent updates include a freshly painted exterior, new lighting fixtures, stainless steel appliances, granite countertops, and new flooring throughout. The property also features a detached two car garage, and a fenced in yard. Get this one before it's gone! Buyer and Buyer's agent to verify all aspects of the home.
Key facts
- Fenced yard
- Central location
- 2-car garage
Tags
Property features AI
Exterior
- Parking: Detached garage with alley access (2 garage spaces, 2 total parking spaces)
- Utilities: Public water; Public sewer; 100 amp electric service
- Home design: Detached single-family home; 2 stories; Fee simple ownership; Built over 100 years ago; Located on a block with alley access
- Construction: Aluminum siding; Block and concrete perimeter foundation; Built before 1978
- Exterior features: Level lot; Lot dimensions approximately 48 x 150
Interior
- Kitchen: Dishwasher; Microwave; Range
- Bedrooms: 3 bedrooms
- Bathrooms: 1 full bath; 1 half bath
- Heating & cooling: Forced air heating (natural gas); Central air conditioning
- Interior features: Separate dining room; Full basement with egress window; Sump pump; Gas water heater
- Laundry & utility: (No specific washer/dryer listed)
Neighborhood map
What this means for you Summary
Snapshot
- This is a 3-bed/2.0-bath single-family listed at $75k.
Deal economics
- At list price, monthly cash flow is $426 ($5k/yr) — positive.
- The deal already cash-flows at list — no discount required.
- Meets the 1% rule at list price ($1k rent vs $75k).
- Recommended offer: $73k (3.0% below list) — sets the bar for market timing.
- Cap rate 13.1% vs local median 4.4% in Davenport — top-decile yield for the area; either an underpriced asset or a hidden risk that comps aren't pricing in. Stress-test before assuming the spread holds.
Location & tenants
- Location reads 79/100 on livability (#126 in IA, #2,312 nationally) — a middle-class / working-renter tenant base. Strengths: cost of living A+, housing A+, health & safety A+; Watch: employment C-, crime F.
- Davenport Community School District (urban): math 43% / reading 50% proficiency, ranked #288 of 289 in IA (top 100%) — families likely to look elsewhere, expect single-tenant / working-renter base with shorter leases.
- Zoned schools: Madison Elementary School (math 28% / reading 25%, grade F, #611 of 616 statewide, top 99%, 379 students, 73% FRL); Central High School (math 45% / reading 64%, grade C-, #290 of 336 statewide, top 87%, 1,505 students, 47% FRL) — zoned schools at 60% FRL track the district average.
- Market conditions: Rents rising fast (+4.6%/yr); 165 active listings in the ZIP; 38 comparable units currently listed for rent nearby; rentals lingering (median 46d on market — plan ~5-8 weeks vacancy on turnover, expect pricing pressure); 58% of comp listings sitting > 30 days — soft ceiling on asking rent; 805 units permitted in Scott County in 2024 (479 in 5+ unit buildings).
Forward outlook
- Local home prices are declining (-3.0%/yr); year-one equity from $518 of loan paydown is wiped out by about $2k of value loss. Plan a longer hold.
- Scott County population projected at +19% by 2050 — long-run rental-demand tailwind backs the buy-and-hold thesis.
- At projected returns (-3.0% appreciation + 4.6% rent growth), your $21k cash investment doubles in ~5 years — after that, you're playing with house money.
Negotiation context
- It's been on market 39 days — a 3% lower offer ($73k) is reasonable based on typical stale-listing flexibility.
- 8 sale attempts since 19y ago with the ask held roughly flat each time — persistent listings suggest the price (not the market) is what's stuck; bring a comps-based counter.
Risks & watch-outs
- Watch-outs: property tax is 3.2% of price; built in 1900 — expect roof / HVAC / electrical / plumbing capex.
Questions for the listing agent
- It's been on market 39 days. Have you received any prior offers? Is the seller open to a 3% concession, seller financing, or rate buy-down credit?
- Built in 1900 — when were the roof, HVAC, electrical panel, plumbing, and water heater last replaced?
- Property tax is high relative to price — has the assessment been appealed recently, and will the sale trigger a re-assessment?
- Is there a deadline driving the sale (1031 exchange, divorce, estate, relocation)? That informs how much negotiation room exists.
- Crime grade is F in this area — have there been break-ins, vandalism, or insurance claims at this property in the last 3 years? What carrier currently insures it and at what premium?
- What's the average days-on-market for RENTAL listings here right now (not sales)? A rising rental-DOM trend means longer vacancies and softer asking-rent achievability than the comps imply.
- What's the recent tenant-quality profile in this submarket — average credit score on applications, eviction rate, late-payment / NSF rate, and stable-employment percentage? A property-management company in the area should have these aggregated.
- How much new for-sale + rental construction is in the pipeline within 1–3 miles? Heavy new supply typically softens prices + rents 12–24 months out; constrained supply supports both.
Investment metrics
- 1% rule
- 1.77% ✓
- Cap rate
- 13.12%
- Cash-on-cash
- 24.37%
- DSCR
- 2.08
- GRM
- 4.7
CMA / ARV
- ARV (on-the-fly)
- $113,904
- Comps found
- 12
Show comp detail 12 sales within ~0.75 mi
| Address | Dist | Beds/Ba | Sqft | Sold | Price | $/sf | Match |
|---|---|---|---|---|---|---|---|
| 1108 Arlington Ave | 0.49mi | 3/1.0 | 1,668 (+5%) | 2mo | $99,999 | $60 | 62 |
| 1102 Kirkwood Blvd | 0.46mi | 3/2.0 | 1,428 (-10%) | 1mo | $129,000 | $90 | 62 |
| 2213 Iowa St | 0.39mi | 4/2.5 (+1) | 1,726 (+9%) | 0mo | $174,200 | $101 | 59 |
| 1220 College Ave | 0.67mi | 3/1.0 | 1,530 (-3%) | 0mo | $110,000 | $72 | 59 |
| 715 Iowa St | 0.63mi | 3/2.0 | 1,710 (+8%) | 1mo | $94,000 | $55 | 56 |
| 1222 Pershing Ave | 0.29mi | 4/1.5 (+1) | 1,800 (+14%) | 3mo | $90,000 | $50 | 54 |
| 1127 N Ripley St St | 0.59mi | 4/1.0 (+1) | 1,660 (+5%) | 3mo | $93,000 | $56 | 53 |
| 2211 Western Ave | 0.74mi | 3/2.0 | 1,484 (-6%) | 3mo | $175,000 | $118 | 52 |
| 2528 Farnam St | 0.66mi | 4/1.0 (+1) | 1,496 (-5%) | 1mo | $100,000 | $67 | 50 |
| 2627 Fair Ave | 0.72mi | 3/1.5 | 1,447 (-8%) | 0mo | $168,000 | $116 | 50 |
| 1110 Oneida Ave | 0.59mi | 4/2.0 (+1) | 1,764 (+12%) | 0mo | $45,000 | $26 | 48 |
| 2615 Leclaire St | 0.70mi | 3/1.0 | 1,717 (+8%) | 3mo | $230,000 | $134 | 47 |
Match score weights: distance 35% · size 25% · config 20% · recency 20%. Top-matched comps best support the ARV.
Projected returns pro-forma
-3.0% appreciation · 4.57% rent growth · sell at horizon
- IRR
- 19.7%
- Equity multiple
- 1.82×
- Total profit
- $17,204
- Equity at exit
- $11,168
- IRR
- 29.2%
- Equity multiple
- 3.83×
- Total profit
- $59,267
- Equity at exit
- $6,476
Cash invested: $20,972 (down + closing). Projections, not guarantees.
Landlord ↔ Tenant lean methodology
- Overall (STATE)
- 83 Strongly Landlord-Friendly
- State Iowa
- 83 Strongly Landlord-Friendly · R+6
- County
- — inherits STATE
- City
- — inherits STATE
ZIP-level market 52803
- Home prices YoY
- -34.5%
- Rents YoY
- 4.6%
- Active inventory
- 165
- Price-to-rent
- 4.7×
Monthly cashflow live
- Estimated rent
- $1,325 high interval (Pro) →
- Mortgage (P&I)
- −$393
- Tax from tax record
- −$197 /mo · $2,365/yr
- Insurance
- −$31
- HOA
- −$0
- Vacancy / Maint / Mgmt
- −$278
- Net cashflow
- $426
Break-even live
Sensitivity live
| Price | -10% $468 | -5% $447 | +0% $426 | +5% $405 | +10% $384 |
|---|---|---|---|---|---|
| Rent | -10% $321 | -5% $374 | +0% $426 | +5% $478 | +10% $531 |
| Rate | -1.0pp $464 | -0.5pp $445 | base $426 | +0.5pp $407 | +1.0pp $387 |
UW: 25.0% down · 7.5% · 30yr · 1.5% tax · 5.0% vac · 8.0% maint · 8.0% mgmt
Financing live
Cash to close
- Down payment
- $18,725
- Closing costs
- $2,247
- Reserves months
- —
- Total cash needed
- —
Loan-product check · same deal, 3 products live
Conventional
25% down · 7.5% · 30yr
- Down + closing
- —
- Monthly P&I
- —
- Monthly cashflow
- —
- DSCR
- —
- Eligible?
- —
Personal DTI + credit; lowest rate.
DSCR
20% down · 8.5% · 30yr
- Down + closing
- —
- Monthly P&I
- —
- Monthly cashflow
- —
- DSCR
- —
- Eligible?
- —
No personal income docs; deal must DSCR.
Hard money
10% down · 12.0% · 12mo
- Down + closing
- —
- Monthly P&I
- —
- Monthly cashflow
- —
- DSCR
- —
- Eligible?
- —
Short-term bridge; refi at stabilization.
Rent comps 38 comps
| Address | Beds | Baths | Sqft | Rent | $/sqft | DOM | Units | Dist |
|---|---|---|---|---|---|---|---|---|
| 317 Kirkwood Blvd Davenport, IA | 2.0 | 1.0 | 1300 | $950 | $0.73 | 46d | 1 | 0.08mi |
| 119 E 13th St Davenport, IA | 3.0 | 1.0 | 1728 | $1,495 | $0.87 | 46d | 1 | 0.31mi |
| 1421 N Main St #2 Davenport, IA | 3.0 | 1.0 | 1350 | $1,095 | $0.81 | 46d | 1 | 0.34mi |
| 2224 Iowa St Davenport, IA | 2.0 | 1.0 | 1214 | $895 | $0.74 | 46d | 1 | 0.44mi |
| 2224 Iowa St Unit 2224 Davenport, IA | 2.0 | 1.0 | 1214 | $925 | $0.76 | 46d | 1 | 0.44mi |
| 2209 Farnam St Unit 2211 Davenport, IA | 3.0 | 1.0 | 1138 | $1,050 | $0.92 | 23d | 1 | 0.45mi |
| 1519 N Ripley St Davenport, IA | 2.0 | 1.0 | 1144 | $1,100 | $0.96 | 15d | 1 | 0.48mi |
| 1511 N Ripley St Davenport, IA | 4.0 | 2.0 | 1872 | $1,450 | $0.77 | 23d | 1 | 0.48mi |
| 1017 E 13th St Unit 1017 Davenport, IA | 2.0 | 1.0 | 1335 | $950 | $0.71 | 23d | 1 | 0.51mi |
| 537 W 16th St Davenport, IA | 3.0 | 1.0 | 1311 | $1,400 | $1.07 | 46d | 1 | 0.64mi |
| 621 W 15th St Davenport, IA | 4.0 | 2.0 | 1833 | $1,500 | $0.82 | 15d | 1 | 0.69mi |
| 616 E 6th St Davenport, IA | 4.0 | 1.0 | 1578 | $1,712 | $1.08 | 46d | 1 | 0.70mi |
| 1323 N Gaines St Davenport, IA | 4.0 | 2.0 | 1733 | $1,350 | $0.78 | 23d | 1 | 0.72mi |
| 511 Pershing Ave Unit 101W Davenport, IA | 2.0 | 1.0 | 1280 | $1,704 | $1.33 | 46d | 1 | 0.77mi |
| 511 Pershing Ave Unit 301E Davenport, IA | 3.0 | 2.0 | 1429 | $2,126 | $1.49 | 46d | 1 | 0.77mi |
| 511 Pershing Ave Unit 407W Davenport, IA | 2.0 | 2.0 | 1175 | $1,568 | $1.33 | 46d | 1 | 0.77mi |
| 511 Pershing Ave Unit 402W Davenport, IA | 2.0 | 2.0 | 1106 | $1,478 | $1.34 | 46d | 1 | 0.77mi |
| 511 Pershing Ave Unit 102W Davenport, IA | 2.0 | 1.0 | 1173 | $1,506 | $1.28 | 46d | 1 | 0.77mi |
| 511 Pershing Ave Unit 106E Davenport, IA | 3.0 | 2.0 | 1349 | $1,996 | $1.48 | 46d | 1 | 0.77mi |
| 511 Pershing Ave Unit 202W Davenport, IA | 2.0 | 1.0 | 1201 | $1,601 | $1.33 | 46d | 1 | 0.77mi |
| 511 Pershing Ave Unit 105E Davenport, IA | 2.0 | 2.0 | 1100 | $1,635 | $1.49 | 46d | 1 | 0.77mi |
| 736 Federal St Davenport, IA | 1.0–3.0 | 1.0–2.0 | 1186 | $1,868 | $1.57 | 23d | 1 | 0.79mi |
| 1315 Brown St Unit 2 Davenport, IA | 3.0 | 1.0 | 1300 | $1,250 | $0.96 | 23d | 1 | 0.80mi |
| 427 Pershing Ave Davenport, IA | 3.0 | 2.0 | 1438 | $2,288 | $1.59 | 15d | 3 | 0.81mi |
| 427 N Brady St Unit 1 Davenport, IA | 3.0 | 1.5 | 1126 | $1,359 | $1.21 | 46d | 1 | 0.84mi |
| 1527 Fulton Ct Davenport, IA | 4.0 | 2.0 | 1850 | $1,775 | $0.96 | 46d | 1 | 0.86mi |
| 401 Brady St Davenport, IA | 1.0–3.0 | 1.0–2.0 | 870 | $2,100 | $2.41 | 15d | 2 | 0.89mi |
| 915 W 14th St Davenport, IA | 3.0 | 1.0 | 1390 | $900 | $0.65 | 46d | 1 | 0.92mi |
| 200 E 3rd St Davenport, IA | 1.0–2.0 | 1.0–2.0 | 900 | $1,700 | $1.89 | 15d | 2 | 0.93mi |
| 320 E 29th St Davenport, IA | 2.0 | 2.5 | 1450 | $1,750 | $1.21 | 46d | 1 | 0.95mi |
| 212 N Brady St Davenport, IA | 2.0–3.0 | 2.0–3.0 | 1428 | $2,600 | $1.82 | 15d | 4 | 1.02mi |
| 324 S Brady St Davenport, IA | 1.0–2.0 | 1.0–2.0 | 965 | $1,700 | $1.76 | 23d | 2 | 1.04mi |
| 2220 E Lombard St Davenport, IA | 3.0 | 2.0 | 1500 | $1,620 | $1.08 | 46d | 1 | 1.33mi |
| 102 W 35th St Unit 128E_35R Davenport, IA | 2.0 | 2.0 | 1200 | $1,100 | $0.92 | 23d | 1 | 1.34mi |
| 102 W 35th St Unit 105W_35 Davenport, IA | 3.0 | 2.0 | 1500 | $1,150 | $0.77 | 46d | 1 | 1.34mi |
| 102 W 35th St Unit 130E_35R Davenport, IA | 2.0 | 2.0 | 1200 | $1,100 | $0.92 | 15d | 1 | 1.34mi |
| 102 W 35th St Unit 119W_35R Davenport, IA | 2.0 | 2.0 | 1200 | $1,050 | $0.88 | 46d | 1 | 1.34mi |
| 102 W 35th St Unit 104E_35R Davenport, IA | 2.0 | 2.0 | 1200 | $1,050 | $0.88 | 23d | 1 | 1.34mi |
Listing history 27 events
-
2026-05-22$74,900 Active
-
2026-02-12soldstatus Closed
-
2026-01-28status Pending
-
2026-01-15status Active
-
2026-01-14historical
-
2026-01-08status Active
-
2026-01-06historical
-
2026-01-05historical
-
2025-11-26price
-
2025-10-30price
-
2025-10-02Active
-
2023-02-13soldstatus $114,500
-
2023-02-08soldstatus $114,500 449-char remark
Show marketing remark (449 chars)
Check out this newly listed Davenport home, featuring 3 spacious bedrooms and 1.5 bathrooms, this home is ready for its new owner. Recent updates include a freshly painted exterior, new lighting fixtures, stainless steel appliances, granite countertops, and new flooring throughout. The property also features a detached two car garage, and a fenced in yard. Get this one before it's gone! Buyer and Buyer's agent to verify all aspects of the home.
-
2023-02-08soldstatus $114,500 Closed 449-char remark
Show marketing remark (449 chars)
Check out this newly listed Davenport home, featuring 3 spacious bedrooms and 1.5 bathrooms, this home is ready for its new owner. Recent updates include a freshly painted exterior, new lighting fixtures, stainless steel appliances, granite countertops, and new flooring throughout. The property also features a detached two car garage, and a fenced in yard. Get this one before it's gone! Buyer and Buyer's agent to verify all aspects of the home.
-
2023-01-02historical Under Contract 449-char remark
Show marketing remark (449 chars)
Check out this newly listed Davenport home, featuring 3 spacious bedrooms and 1.5 bathrooms, this home is ready for its new owner. Recent updates include a freshly painted exterior, new lighting fixtures, stainless steel appliances, granite countertops, and new flooring throughout. The property also features a detached two car garage, and a fenced in yard. Get this one before it's gone! Buyer and Buyer's agent to verify all aspects of the home.
-
2022-12-20price $119,000 449-char remark
Show marketing remark (449 chars)
Check out this newly listed Davenport home, featuring 3 spacious bedrooms and 1.5 bathrooms, this home is ready for its new owner. Recent updates include a freshly painted exterior, new lighting fixtures, stainless steel appliances, granite countertops, and new flooring throughout. The property also features a detached two car garage, and a fenced in yard. Get this one before it's gone! Buyer and Buyer's agent to verify all aspects of the home.
-
2022-12-13$119,000 449-char remark
Show marketing remark (449 chars)
Check out this newly listed Davenport home, featuring 3 spacious bedrooms and 1.5 bathrooms, this home is ready for its new owner. Recent updates include a freshly painted exterior, new lighting fixtures, stainless steel appliances, granite countertops, and new flooring throughout. The property also features a detached two car garage, and a fenced in yard. Get this one before it's gone! Buyer and Buyer's agent to verify all aspects of the home.
-
2022-12-13$135,000 Active 449-char remark
Show marketing remark (449 chars)
Check out this newly listed Davenport home, featuring 3 spacious bedrooms and 1.5 bathrooms, this home is ready for its new owner. Recent updates include a freshly painted exterior, new lighting fixtures, stainless steel appliances, granite countertops, and new flooring throughout. The property also features a detached two car garage, and a fenced in yard. Get this one before it's gone! Buyer and Buyer's agent to verify all aspects of the home.
-
2022-05-12soldstatus $285,000
-
2022-05-11soldstatus $55,000
-
2021-08-06historical
-
2021-08-06historical
-
2021-08-06historical
-
2007-08-14soldstatus $38,500
-
2007-08-14soldstatus $38,500
-
2007-07-19$44,900
-
2007-07-19$44,900
ⓘ Source: listings_history table (triggers on properties + properties_extension) + one-shot
backfill from property_details.listing_events for pre-trigger history.
Tax reassessment forecast IA · Partial reset (capped growth)
- Current annual tax
- $2,365 · $197/mo
- Projected year-2 tax
- $2,365 · $197/mo
- Expected delta
- $0/yr ($0/mo · 0.0%)
ⓘ Screening estimate from a state-policy table — verify with the county assessor before closing.
Climate risk First Street
- Flood 1/10 Low FEMA zone X (unshaded) · 0% chance over 30 yrs
- Wildfire 1/10 Low
- Heat 3/10 Moderate 7 d/yr ≥103°F today · 16 d/yr by 30 yrs out
- Wind 2/10 Low
- Air quality 3/10 Moderate 2 unhealthy d/yr today · 3 by 30 yrs out
Nearby sold comps map
Loading sold comps map…
Walkable amenities ~0.75 mi
Loading nearby amenities…
Taxation est. · year 1
- Rental income
- $15,905
- − Mortgage interest
- −$4,196
- − Property taxes
- −$2,365
- − Insurance
- −$374
- − Repairs & maintenance
- −$1,272
- − Management
- −$1,272
- − Depreciation
- −$2,179
- Taxable income
- $4,246
- Est. tax owed @ 24.0%
- −$1,019
- After-tax cash flow
- $4,093/yr
For passive investors: Depreciation is non-cash, so a rental often shows a tax loss while cash-flowing — sheltering income. Rental losses are passive: they offset passive income freely, and up to $25,000/yr can offset ordinary (W-2) income if you actively participate and your MAGI is under $100k (phasing out to $0 by $150k); unused losses carry forward. On sale, claimed depreciation is recaptured at up to 25%, and gains may owe capital-gains tax (a 1031 exchange can defer both). Figures are a year-1 estimate at your 24.0% rate — not tax advice; consult a CPA.
Schools (NCES district)
- District
- Davenport Community School District
- NCES district ID
- 1908580
- Math proficiency
- 43% ▼ -11.00%
- Reading proficiency
- 50% ▼ -3.00%
- Median HH income
- $46,157
- Composite
- 39.49/100
- National rank
- #3951
- State rank
- #288 of 289 in IA
Livability — Davenport
- Score
- 79/100
- State rank
- #126
- US rank
- #2312
Category grades
Schools grade is shown separately in the Schools card above.
Census & demographics
- Census place
- Davenport, IA
- County
- Scott County · 144,583 people
- City population
- 103,319
- Metro
- Davenport-Moline-Rock Island, IA-IL
- Population (ZIP)
- 22,742
- Household income
- $64,543
- Rent vs Own
- Severe rent burden
- 630.0
Population outlook (Scott County) Hauer SSP2
- Today (2025)
- 188,878 people
- By 2030
- 196,648 · +4.1%
- By 2040
- 210,860 · +11.6%
- By 2050
- 224,359 · +18.8%
- By 2075
- 258,884 · +37.1%
- By 2100
- 286,447 · +51.7%
Race, ethnicity, and origin ACS 2023
- Neighborhood character
- Predominantly White (69%)
- Race & ethnicity
- White 69% Black 14% Two or more races 10% Hispanic / Latino 9%
- Hispanic origin (detail)
- Mexican 7%
- Common ancestry
- Romanian 2% Portuguese 2% Iranian 2%
- Foreign-born
- 5% · Canada, United Kingdom, South Korea
- Languages at home
- 93% English-only · Spanish 4% French/Haitian/Cajun 1%
Political lean MEDSL · Scott
- 2024 margin
- Toss-up / Even · D 47.3% · R 51.2% · Other 1.4%
- 2008→2024 swing
- -18.4pp toward R · 2008: 14.6pp · 2024: -3.9pp
- All cycles
- 2024: R+3.9 2020: D+3.5 2016: D+1.4 2012: D+13.8 2008: D+14.6
Not yet ingested
- Civics
- —
Market trends
- HPI YoY
- ▼ -96.00%
- Current HPI
- 182.0976
- Rent YoY
- ▲ 4.57%
- Metro
- Davenport-Moline-Rock Island, IA-IL
- State GDP YoY
- ▲ 2.48%
- F500 in state
- 4
Industry mix (Fortune 500 HQ in IA)
| Industry | F500 HQs | Revenue |
|---|---|---|
| Financial Services | 1 | $16B |
|
||
| Retail / Convenience | 1 | $15B |
|
||
Price history
+66.8% since first listed27 events — show timeline
- 2026-05-22 Listed $74,900 MRED as Distributed by MLS Grid
- 2026-02-12 Sold (MLS) — MRED as Distributed by MLS Grid
- 2026-01-28 Pending — MRED as Distributed by MLS Grid
- 2026-01-15 Relisted — MRED as Distributed by MLS Grid
- 2026-01-14 Listing Removed — MRED as Distributed by MLS Grid
- 2026-01-08 Relisted — MRED as Distributed by MLS Grid
- 2026-01-06 Listing Removed — RMLSA as Distributed by MLS Grid
- 2026-01-05 Listing Removed — MRED as Distributed by MLS Grid
- 2025-11-26 Price Changed — RMLSA as Distributed by MLS Grid
- 2025-10-30 Price Changed — RMLSA as Distributed by MLS Grid
- 2025-10-02 Listed — RMLSA as Distributed by MLS Grid
- 2023-02-13 Sold (Public Records) $114,500 Public Records
- 2023-02-08 Sold (MLS) $114,500 RMLSA as Distributed by MLS Grid
- 2023-02-08 Sold (MLS) $114,500 MRED as Distributed by MLS Grid
- 2023-01-02 Contingent — RMLSA as Distributed by MLS Grid
- 2022-12-20 Price Changed $119,000 RMLSA as Distributed by MLS Grid
- 2022-12-13 Listed $135,000 RMLSA as Distributed by MLS Grid
- 2022-12-13 Listed $119,000 MRED as Distributed by MLS Grid
- 2022-05-12 Sold (Public Records) $285,000 Public Records
- 2022-05-11 Sold (Public Records) $55,000 Public Records
- 2021-08-06 Listing Removed — RMLSA as Distributed by MLS Grid
- 2021-08-06 Listing Removed — RMLSA as Distributed by MLS Grid
- 2021-08-06 Listing Removed — RMLSA as Distributed by MLS Grid
- 2007-08-14 Sold (MLS) $38,500 MRED as Distributed by MLS Grid
- 2007-08-14 Sold (MLS) $38,500 RMLSA as Distributed by MLS Grid
- 2007-07-19 Listed $44,900 MRED as Distributed by MLS Grid
- 2007-07-19 Listed $44,900 RMLSA as Distributed by MLS Grid
Property tax history
+4.2%/yrLatest (2025): $2,365 · -2.6% YoY. Source: county tax records.
Cash-flow waterfall
monthlySold comps — $/sqft
last 12 mo · ≤1 miLoading sold comps…