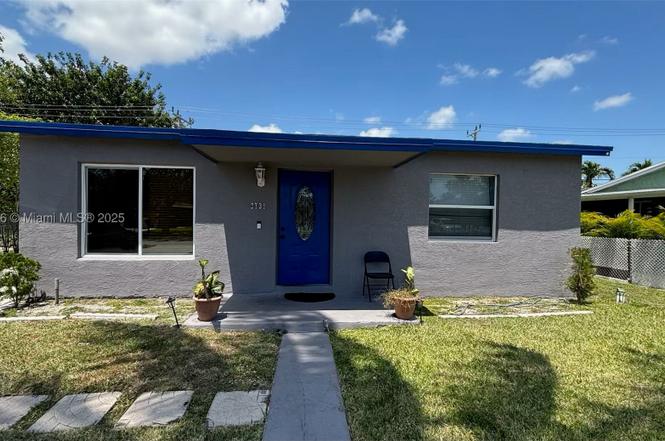
2731 NW 1st Ct · Pompano Beach, FL
Flood risk 1/10 · Minimal
- FEMA flood zone
- X (shaded)
- Chance of flooding over 30 yrs
- 0.0%
- Est. flood insurance / yr
- $507 – $1,088
Fire risk 1/10 · Minimal
- Est. fire insurance / yr
- $947 – $1,759
Heat risk 10/10 · Severe
- Hot days now (above 106°F)
- 7 days/yr
- Hot days in 30 yrs
- 26 days/yr
Wind risk 10/10 · Severe
- Chance of severe wind over 30 yrs
- 99.0%
Air-quality risk 3/10 · Minor
- Unhealthy air days now
- 3 days/yr
- Unhealthy air days in 30 yrs
- 3 days/yr
Risk factors via First Street. Map © Google.
Why this score? — see what drove the D+ grade
The composite is a weighted blend of 9 inputs, each scored 0–100. Each bar is that input's sub-score; the figure is the points it added to the 100-point composite (weight × sub-score).
- ARV discount +15.0/15.0
- Cash flow +9.5/30.0
- 1% rule +5.9/10.0
- Schools +4.1/10.0
- Livability +3.7/5.0
- Appreciation +3.4/10.0
- DSCR +2.7/10.0
- Condition / age +2.5/5.0
- Rent growth +2.4/5.0
$200,000
🖨 Deal sheet 📄 Offer letter ✓ Due diligence
Listing remarks
Sale of property subject to successful short sale.
Key facts
- 6,201 sq ft lot
- Built 1963
- Listed 8 days
Neighborhood map
What this means for you Summary
Snapshot
- This is a 2-bed/1.0-bath single-family listed at $200k.
Deal economics
- At list price, monthly cash flow is $-141 ($-2k/yr) — negative.
- To cash-flow at today's rent, offer at most $176k (11.9% below list).
- Meets the 1% rule at list price ($2k rent vs $200k).
- Recommended offer: $176k (11.9% below list) — sets the bar for cash-flow.
- Cap rate 5.4% vs local median 3.1% in Pompano Beach — top-decile yield for the area; either an underpriced asset or a hidden risk that comps aren't pricing in. Stress-test before assuming the spread holds.
Location & tenants
- Location reads 74/100 on livability (#284 in FL, #4,541 nationally) — a middle-class / working-renter tenant base. Strengths: commute A+, housing A+, cost of living B+; Watch: schools D+, employment D+, amenities F.
- Broward (suburban): math 42% / reading 53% proficiency, ranked #46 of 73 in FL (top 63%) — families likely to look elsewhere, expect single-tenant / working-renter base with shorter leases.
- Market conditions: Rents soft (-0.3%/yr); 438 active listings in the ZIP; 40 comparable units currently listed for rent nearby; rentals at typical pace (median 21d on market — plan ~3-4 weeks tenant-placement turnaround); 2,111 units permitted in Broward County in 2024 (1,265 in 5+ unit buildings).
- This rent runs 44% of the median local income ($60k/yr) — at the standard rent-burdened threshold; future hikes will face affordability resistance.
Forward outlook
- Local home prices are declining (-3.0%/yr); year-one equity from $1k of loan paydown is wiped out by about $6k of value loss. Plan a longer hold.
- Broward County population projected at +34% by 2050 — long-run rental-demand tailwind backs the buy-and-hold thesis.
Negotiation context
- Only 8 days on market — expect competitive offers; lowballing is unlikely to land.
Risks & watch-outs
- Watch-outs: property tax is 4.4% of price.
- Climate carrying-cost: severe wind risk, 99% chance of damaging wind over 30y; extreme-heat days projected 7→26/yr by 2055 (HVAC capex compounding) — expect insurance premiums to compound above CPI over the hold.
Questions for the listing agent
- What do current leases actually rent for vs. the listed asking? Can we see a recent rent roll and the last 12 months of T-12 income?
- Built in 1963 — when were the roof, HVAC, electrical panel, plumbing, and water heater last replaced?
- Property tax is high relative to price — has the assessment been appealed recently, and will the sale trigger a re-assessment?
- Is there a deadline driving the sale (1031 exchange, divorce, estate, relocation)? That informs how much negotiation room exists.
- Schools are D-rated, which usually means shorter tenancies and higher turnover. Who's the typical renter profile here, and what's been the actual vacancy rate?
- The area grade is low — what's the realistic commute time and amenity access for the typical tenant pool here? Any planned neighborhood developments (good or bad) we should know about?
- What's the average days-on-market for RENTAL listings here right now (not sales)? A rising rental-DOM trend means longer vacancies and softer asking-rent achievability than the comps imply.
- What's the recent tenant-quality profile in this submarket — average credit score on applications, eviction rate, late-payment / NSF rate, and stable-employment percentage? A property-management company in the area should have these aggregated.
- How much new for-sale + rental construction is in the pipeline within 1–3 miles? Heavy new supply typically softens prices + rents 12–24 months out; constrained supply supports both.
Investment metrics
- 1% rule
- 1.09% ✓
- Cap rate
- 5.45%
- Cash-on-cash
- -3.02%
- DSCR
- 0.87
- GRM
- 7.6
CMA / ARV
- ARV (on-the-fly)
- $301,600
- Comps found
- 1
Show comp detail 1 sale within ~0.75 mi
| Address | Dist | Beds/Ba | Sqft | Sold | Price | $/sf | Match |
|---|---|---|---|---|---|---|---|
| 2122 NW 5th St | 0.57mi | 3/2.0 (+1) | 876 (+10%) | 4mo | $330,000 | $377 | 45 |
Match score weights: distance 35% · size 25% · config 20% · recency 20%. Top-matched comps best support the ARV.
Projected returns pro-forma
-3.0% appreciation · 0.0% rent growth · sell at horizon
- IRR
- -25.9%
- Equity multiple
- 0.15×
- Total profit
- $-47,447
- Equity at exit
- $29,821
- IRR
- -45.5%
- Equity multiple
- -0.36×
- Total profit
- $-76,258
- Equity at exit
- $17,292
Cash invested: $56,000 (down + closing). Projections, not guarantees.
Landlord ↔ Tenant lean methodology
- Overall (STATE)
- 87 Strongly Landlord-Friendly
- State Florida
- 87 Strongly Landlord-Friendly · R+3
- County
- — inherits STATE
- City
- — inherits STATE
ZIP-level market 33069
- Home prices YoY
- -1.1%
- Rents YoY
- -0.3%
- Active inventory
- 438
- Price-to-rent
- 7.6×
Monthly cashflow live
- Estimated rent
- $2,184 high interval (Pro) →
- Mortgage (P&I)
- −$1,049
- Tax from tax record
- −$734 /mo · $8,810/yr
- Insurance
- −$83
- HOA
- −$0
- Vacancy / Maint / Mgmt
- −$459
- Net cashflow
- $-141
Break-even live
UW: 25.0% down · 7.5% · 30yr · 1.5% tax · 5.0% vac · 8.0% maint · 8.0% mgmt
Financing live
Cash to close
- Down payment
- $50,000
- Closing costs
- $6,000
- Reserves months
- —
- Total cash needed
- —
Loan-product check · same deal, 3 products live
Conventional
25% down · 7.5% · 30yr
- Down + closing
- —
- Monthly P&I
- —
- Monthly cashflow
- —
- DSCR
- —
- Eligible?
- —
Personal DTI + credit; lowest rate.
DSCR
20% down · 8.5% · 30yr
- Down + closing
- —
- Monthly P&I
- —
- Monthly cashflow
- —
- DSCR
- —
- Eligible?
- —
No personal income docs; deal must DSCR.
Hard money
10% down · 12.0% · 12mo
- Down + closing
- —
- Monthly P&I
- —
- Monthly cashflow
- —
- DSCR
- —
- Eligible?
- —
Short-term bridge; refi at stabilization.
Rent comps 40 comps
| Address | Beds | Baths | Sqft | Rent | $/sqft | DOM | Units | Dist |
|---|---|---|---|---|---|---|---|---|
| 2726 NW 4th Ct Pompano Beach, FL | 3.0 | 2.0 | 840 | $2,600 | $3.10 | 7d | 1 | 0.16mi |
| 2829 N Course Dr #104 Pompano Beach, FL | 2.0 | 2.0 | 1020 | $1,950 | $1.91 | 20d | 1 | 0.26mi |
| 2809 N Course Dr #205 Pompano Beach, FL | 1.0 | 1.0 | 735 | $1,700 | $2.31 | 24d | 1 | 0.32mi |
| 374 NW 31st Ave Pompano Beach, FL | 3.0 | 1.0 | 1066 | $2,600 | $2.44 | 24d | 1 | 0.36mi |
| 2801 N Course Dr Pompano Beach, FL | 1.0–2.0 | 1.0–2.0 | 991 | $2,325 | $2.35 | 24d | 12 | 0.37mi |
| 2803 N Course Dr #203 Pompano Beach, FL | 2.0 | 2.0 | 1120 | $2,100 | $1.88 | 20d | 1 | 0.38mi |
| 2803 N Course Dr #203 Pompano Beach, FL | 2.0 | 2.0 | 1120 | $2,050 | $1.83 | 4d | 1 | 0.38mi |
| 2408 NW 8th St Pompano Beach, FL | 2.0 | 1.0 | 728 | $2,300 | $3.16 | 24d | 1 | 0.48mi |
| 3091 N Course Dr #303 Pompano Beach, FL | 2.0 | 2.0 | 1064 | $2,100 | $1.97 | 4d | 1 | 0.49mi |
| 3091 N Course Dr #705 Pompano Beach, FL | 2.0 | 2.0 | 1064 | $2,000 | $1.88 | 24d | 1 | 0.49mi |
| 3090 N Course Dr #304 Pompano Beach, FL | 2.0 | 2.0 | 1100 | $1,950 | $1.77 | 24d | 1 | 0.55mi |
| 3090 N Course Dr #304 Pompano Beach, FL | 2.0 | 2.0 | 1100 | $1,950 | $1.77 | 7d | 1 | 0.55mi |
| 100 NW 33rd Ave Pompano Beach, FL | 1.0–3.0 | 1.0–2.0 | 1078 | $2,705 | $2.51 | 1d | 20 | 0.57mi |
| 100 NW 33rd Ave Pompano Beach, FL | 1.0–3.0 | 1.0–2.0 | 1078 | $2,577 | $2.39 | 24d | 35 | 0.57mi |
| 2940 N Course Dr Pompano Beach, FL | 1.0 | 1.0 | 1100 | $1,050 | $0.95 | 24d | 1 | 0.58mi |
| 2940 N Course Dr #311 Pompano Beach, FL | 2.0 | 2.0 | 1100 | $2,500 | $2.27 | 11d | 1 | 0.58mi |
| 2940 N Course Dr #910 Pompano Beach, FL | 2.0 | 2.0 | 1100 | $1,950 | $1.77 | 24d | 1 | 0.58mi |
| 3051 N Course Dr #509 Pompano Beach, FL | 2.0 | 2.0 | 1100 | $1,795 | $1.63 | 24d | 1 | 0.58mi |
| 2751 N Palm Aire Dr #402 Pompano Beach, FL | 2.0 | 2.0 | 1064 | $2,300 | $2.16 | 24d | 1 | 0.59mi |
| 2801 N Palm Aire Dr #308 Pompano Beach, FL | 2.0 | 2.0 | 1100 | $1,950 | $1.77 | 24d | 1 | 0.64mi |
| 3100 N Course Ln #208 Pompano Beach, FL | 2.0 | 2.0 | 1100 | $1,850 | $1.68 | 5d | 1 | 0.68mi |
| 3100 N Course Ln #208 Pompano Beach, FL | 2.0 | 2.0 | 1100 | $1,850 | $1.68 | 11d | 1 | 0.68mi |
| 3360 NW 1st St Pompano Beach, FL | 2.0 | 2.0 | 1109 | $2,595 | $2.34 | 2d | 1 | 0.72mi |
| 3360 NW 1st St Pompano Beach, FL | 2.0 | 2.0 | 1109 | $2,693 | $2.43 | 14d | 1 | 0.72mi |
| 3360 NW 1st St Pompano Beach, FL | 1.0 | 1.0 | 787 | $2,230 | $2.83 | 24d | 1 | 0.72mi |
| 2850 N Palm Aire Dr Pompano Beach, FL | 1.0 | 1.5 | 850 | $2,000 | $2.35 | 24d | 1 | 0.74mi |
| 3150 N Course Ln Pompano Beach, FL | 2.0–3.0 | 2.0 | 1300 | $1,800 | $1.38 | 22d | 3 | 0.76mi |
| 2900 N Palm Aire Dr #206 Pompano Beach, FL | 1.0 | 1.0 | 860 | $1,650 | $1.92 | 24d | 1 | 0.79mi |
| 2900 N Palm Aire Dr #405 Pompano Beach, FL | 1.0 | 1.0 | 860 | $1,625 | $1.89 | 17d | 1 | 0.79mi |
| 2500 SW 7th St Pompano Beach, FL | 3.0 | 1.0–3.0 | 1216 | $4,097 | $3.37 | 3d | 45 | 0.79mi |
| 3505 W Atlantic Blvd Pompano Beach, FL | 1.0–2.0 | 1.0–2.0 | 879 | $2,420 | $2.75 | 2d | 15 | 0.81mi |
| 990 Powerline Rd Pompano Beach, FL | 1.0–2.0 | 1.0–2.0 | 833 | $2,388 | $2.87 | 1d | 14 | 0.81mi |
| 3050 N Palm Aire Dr #704 Pompano Beach, FL | 1.0 | 1.5 | 900 | $1,900 | $2.11 | 17d | 1 | 0.89mi |
| 3050 N Palm Aire Dr #704 Pompano Beach, FL | 1.0 | 1.5 | 900 | $1,900 | $2.11 | 15d | 1 | 0.89mi |
| 3050 N Palm Aire Dr #602 Pompano Beach, FL | 2.0 | 2.0 | 1100 | $1,895 | $1.72 | 20d | 1 | 0.89mi |
| 3050 N Palm Aire Dr #508 Pompano Beach, FL | 2.0 | 2.0 | 1100 | $2,100 | $1.91 | 24d | 1 | 0.89mi |
| 2671 S Course Dr #206 Pompano Beach, FL | 2.0 | 2.0 | 1100 | $2,000 | $1.82 | 24d | 1 | 0.89mi |
| 2671 S Course Dr #506 Pompano Beach, FL | 2.0 | 2.0 | 1100 | $2,250 | $2.05 | 7d | 1 | 0.89mi |
| 2671 S Course Dr #806 Pompano Beach, FL | 2.0 | 2.0 | 1100 | $2,250 | $2.05 | 15d | 1 | 0.89mi |
| 2671 S Course Dr #506 Pompano Beach, FL | 2.0 | 2.0 | 1100 | $2,250 | $2.05 | 24d | 1 | 0.89mi |
Listing history 2 events
-
2025-11-25status Pending
-
2025-11-17$200,000 Active
ⓘ Source: listings_history table (triggers on properties + properties_extension) + one-shot
backfill from property_details.listing_events for pre-trigger history.
Tax reassessment forecast FL · Resets to sale price
- Current annual tax
- $8,810 · $734/mo
- Projected year-2 tax
- $8,810 · $734/mo
- Expected delta
- $0/yr ($0/mo · 0.0%)
ⓘ Screening estimate from a state-policy table — verify with the county assessor before closing.
Climate risk First Street
- Flood 1/10 Low FEMA zone X (shaded) · 0% chance over 30 yrs
- Wildfire 1/10 Low
- Heat 10/10 Extreme 7 d/yr ≥106°F today · 26 d/yr by 30 yrs out
- Wind 10/10 Extreme 99% chance of damaging wind over 30 yrs
- Air quality 3/10 Moderate 3 unhealthy d/yr today · 3 by 30 yrs out
Nearby sold comps map
Loading sold comps map…
Walkable amenities ~0.75 mi
Loading nearby amenities…
Taxation est. · year 1
- Rental income
- $26,210
- − Mortgage interest
- −$11,203
- − Property taxes
- −$8,810
- − Insurance
- −$1,000
- − Repairs & maintenance
- −$2,097
- − Management
- −$2,097
- − Depreciation
- −$5,818
- Taxable loss
- −$4,815
- Est. tax savings @ 24.0%
- +$1,155
- After-tax cash flow
- $-534/yr
For passive investors: Depreciation is non-cash, so a rental often shows a tax loss while cash-flowing — sheltering income. Rental losses are passive: they offset passive income freely, and up to $25,000/yr can offset ordinary (W-2) income if you actively participate and your MAGI is under $100k (phasing out to $0 by $150k); unused losses carry forward. On sale, claimed depreciation is recaptured at up to 25%, and gains may owe capital-gains tax (a 1031 exchange can defer both). Figures are a year-1 estimate at your 24.0% rate — not tax advice; consult a CPA.
Schools (NCES district)
- District
- Broward
- NCES district ID
- 1200180
- Math proficiency
- 42% ▼ -18.00%
- Reading proficiency
- 53% ▼ -5.00%
- Median HH income
- $52,139
- Composite
- 40.88/100
- National rank
- #3621
- State rank
- #46 of 73 in FL
Livability — Pompano Beach
- Score
- 74/100
- State rank
- #284
- US rank
- #4541
Category grades
Schools grade is shown separately in the Schools card above.
Census & demographics
- Census place
- Pompano Beach, FL
- County
- Broward County · 1,963,430 people
- City population
- 155,861
- Metro
- Miami-Fort Lauderdale-Pompano Beach, FL
- Population (ZIP)
- 29,145
- Household income
- $59,683
- Rent vs Own
- Severe rent burden
- 1670.0
Population outlook (Broward County) Hauer SSP2
- Today (2025)
- 2,207,033 people
- By 2030
- 2,360,704 · +7.0%
- By 2040
- 2,661,208 · +20.6%
- By 2050
- 2,946,698 · +33.5%
- By 2075
- 3,602,273 · +63.2%
- By 2100
- 3,970,984 · +79.9%
Race, ethnicity, and origin ACS 2023
- Neighborhood character
- Highly diverse neighborhood (Simpson 0.72)
- Race & ethnicity
- Black 33% White 32% Hispanic / Latino 26% Two or more races 21% Asian 3%
- Hispanic origin (detail)
- Mexican 5% Puerto Rican 3% Cuban 3% Dominican 2%
- Common ancestry
- Hispanic 9% Estonian 2% Romanian 2%
- Foreign-born
- 33% · Canada, Jamaica
- Languages at home
- 61% English-only · Spanish 23% French/Haitian/Cajun 9% Other Indo-European 5%
Political lean MEDSL · Broward
- 2024 margin
- D (+17.0) · D 58.0% · R 41.0%
- 2008→2024 swing
- -17.8pp toward R · 2008: 34.7pp · 2024: 17.0pp
- All cycles
- 2024: D+17.0 2020: D+29.8 2016: D+35.0 2012: D+34.9 2008: D+34.7
Not yet ingested
- Civics
- —
Market trends
- HPI YoY
- ▼ -3.16%
- Current HPI
- 297.1774
- Rent YoY
- ▼ -0.29%
- Metro
- Miami-Fort Lauderdale-Pompano Beach, FL
- State GDP YoY
- ▲ 3.28%
- F500 in state
- 36
Industry mix (Fortune 500 HQ in FL)
| Industry | F500 HQs | Revenue |
|---|---|---|
| Industrial Technology | 2 | $29B |
|
||
| Insurance | 2 | $17B |
|
||
| Retail | 1 | $60B |
|
||
| Technology Distribution | 1 | $58B |
|
||
| Homebuilding | 1 | $35B |
|
||
| Technology Manufacturing | 1 | $35B |
|
||
Price history
2 events — show timeline
- 2025-11-25 Pending — MARMLS
- 2025-11-17 Listed $200,000 MARMLS
Property tax history
+26.3%/yrLatest (2025): $8,810 · +127.5% YoY. Source: county tax records.
Cash-flow waterfall
monthlySold comps — $/sqft
last 12 mo · ≤1 miLoading sold comps…