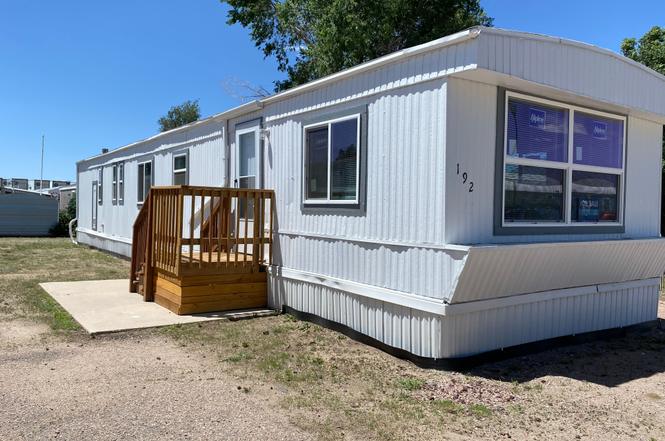
3280 S Academy Blvd #192 · Colorado Springs, CO
Flood risk 1/10 · Minimal
- FEMA flood zone
- X (unshaded)
- Chance of flooding over 30 yrs
- 0.0%
- Est. flood insurance / yr
- $507 – $1,088
Fire risk 3/10 · Minor
- Est. fire insurance / yr
- $939 – $1,743
Heat risk 3/10 · Minor
- Hot days now (above 90°F)
- 7 days/yr
- Hot days in 30 yrs
- 19 days/yr
Wind risk 2/10 · Minimal
- Chance of severe wind over 30 yrs
- —
Air-quality risk 1/10 · Minimal
- Unhealthy air days now
- 0 days/yr
- Unhealthy air days in 30 yrs
- 0 days/yr
Risk factors via First Street. Map © Google.
Why this score? — see what drove the B- grade
The composite is a weighted blend of 9 inputs, each scored 0–100. Each bar is that input's sub-score; the figure is the points it added to the 100-point composite (weight × sub-score).
- Cash flow +30.0/30.0
- 1% rule +10.0/10.0
- DSCR +10.0/10.0
- ARV discount +7.5/15.0
- Livability +3.9/5.0
- Rent growth +3.1/5.0
- Condition / age +2.5/5.0
- Schools +2.1/10.0
- Appreciation +0.0/10.0
$42,000
🖨 Deal sheet 📄 Offer letter ✓ Due diligence
Listing remarks
* THIS IS A RESALE LISTING * This welcoming, well-maintained 2 bedroom, 1 bathroom home is a perfect place to raise your family. For your convenience, we have onsite community management to assist you when you need it. With our family-friendly community amenities such as a clubhouse, community events, and a playground, your family will be excited to live here. This home won't be on the market long, so call us today for more information or to schedule a tour. Deposits & Fees are subject to change.
Key facts
- Built 2025
- Listed 198 days
Property features AI
Finance
- Financial info: List price $41,500
Exterior
- Utilities: Natural gas available
- Home design: Condominium/Apartment (spec inventory, Plan 91755); Located at 3280 S Academy Blvd #192, Colorado Springs, CO
Interior
- Bedrooms: 2 bedrooms
- Bathrooms: 1 full bathroom
- Heating & cooling: Natural gas heating
- Interior features: Living area approximately 896
Neighborhood map
What this means for you Summary
Snapshot
- This is a 2-bed/1.0-bath manufactured listed at $42k.
Deal economics
- At list price, monthly cash flow is $826 ($10k/yr) — positive.
- The deal already cash-flows at list — no discount required.
- Meets the 1% rule at list price ($1k rent vs $42k).
- Recommended offer: $37k (12.0% below list) — sets the bar for market timing.
- Cap rate 29.9% vs local median 3.3% in Colorado Springs — top-decile yield for the area; either an underpriced asset or a hidden risk that comps aren't pricing in. Stress-test before assuming the spread holds.
Location & tenants
- Location reads 78/100 on livability (#23 in CO, #2,639 nationally) — a middle-class / working-renter tenant base. Strengths: amenities A+, housing A+, health & safety A+; Watch: cost of living C-, crime F.
- Harrison School District No. 2 In The County Of El Paso An (urban): math 16% / reading 35% proficiency, ranked #67 of 86 in CO (top 78%) — low school quality limits family demand, transient renter base, plan for 1-2y turnover; 62% free/reduced lunch — lower-income household profile, screen leases tightly.
- Market conditions: Rents rising (+2.4%/yr); 183 active listings in the ZIP; 26 comparable units currently listed for rent nearby; rentals at typical pace (median 22d on market — plan ~3-4 weeks tenant-placement turnaround); 3,906 units permitted in El Paso County in 2024 (872 in 5+ unit buildings).
Forward outlook
- Local home prices are declining (-3.0%/yr); year-one equity from $290 of loan paydown is wiped out by about $1k of value loss. Plan a longer hold.
- El Paso County population projected at +28% by 2050 — long-run rental-demand tailwind backs the buy-and-hold thesis.
- At projected returns (-3.0% appreciation + 2.4% rent growth), your $12k cash investment doubles in ~2 years — after that, you're playing with house money.
Negotiation context
- It's been on market 198 days — a 12% lower offer ($37k) is reasonable based on typical stale-listing flexibility.
Questions for the listing agent
- It's been on market 198 days. Have you received any prior offers? Is the seller open to a 12% concession, seller financing, or rate buy-down credit?
- Why hasn't it sold? Are there any deal-killer items the seller is aware of (foundation, flood, title, zoning, code violations)?
- Is there a deadline driving the sale (1031 exchange, divorce, estate, relocation)? That informs how much negotiation room exists.
- Schools are B-rated — typically a magnet for longer-tenancy family renters. What's the average tenant stay here, and is there a school-zone premium baked into asking?
- Crime grade is F in this area — have there been break-ins, vandalism, or insurance claims at this property in the last 3 years? What carrier currently insures it and at what premium?
- What's the average days-on-market for RENTAL listings here right now (not sales)? A rising rental-DOM trend means longer vacancies and softer asking-rent achievability than the comps imply.
- What's the recent tenant-quality profile in this submarket — average credit score on applications, eviction rate, late-payment / NSF rate, and stable-employment percentage? A property-management company in the area should have these aggregated.
- How much new for-sale + rental construction is in the pipeline within 1–3 miles? Heavy new supply typically softens prices + rents 12–24 months out; constrained supply supports both.
Investment metrics
- 1% rule
- 3.36% ✓
- Cap rate
- 29.89%
- Cash-on-cash
- 84.27%
- DSCR
- 4.75
- GRM
- 2.5
CMA / ARV
No comps found within radius.
Projected returns pro-forma
-3.0% appreciation · 2.36% rent growth · sell at horizon
- IRR
- 83.9%
- Equity multiple
- 4.82×
- Total profit
- $44,911
- Equity at exit
- $6,262
- IRR
- 87.0%
- Equity multiple
- 9.78×
- Total profit
- $103,263
- Equity at exit
- $3,631
Cash invested: $11,760 (down + closing). Projections, not guarantees.
Landlord ↔ Tenant lean methodology
- Overall (STATE)
- 38 Tenant-Leaning
- State Colorado
- 38 Tenant-Leaning · D+4
- County
- — inherits STATE
- City
- — inherits STATE
ZIP-level market 80916
- Home prices YoY
- -27.6%
- Rents YoY
- 2.4%
- Active inventory
- 183
- Price-to-rent
- 2.5×
Monthly cashflow live
- Estimated rent
- $1,413 high interval (Pro) →
- Mortgage (P&I)
- −$220
- Tax est. 1.5%
- −$52 /mo · $630/yr
- Insurance
- −$18
- HOA
- −$0
- Vacancy / Maint / Mgmt
- −$297
- Net cashflow
- $826
Break-even live
UW: 25.0% down · 7.5% · 30yr · 1.5% tax · 5.0% vac · 8.0% maint · 8.0% mgmt
Financing live
Cash to close
- Down payment
- $10,500
- Closing costs
- $1,260
- Reserves months
- —
- Total cash needed
- —
Loan-product check · same deal, 3 products live
Conventional
25% down · 7.5% · 30yr
- Down + closing
- —
- Monthly P&I
- —
- Monthly cashflow
- —
- DSCR
- —
- Eligible?
- —
Personal DTI + credit; lowest rate.
DSCR
20% down · 8.5% · 30yr
- Down + closing
- —
- Monthly P&I
- —
- Monthly cashflow
- —
- DSCR
- —
- Eligible?
- —
No personal income docs; deal must DSCR.
Hard money
10% down · 12.0% · 12mo
- Down + closing
- —
- Monthly P&I
- —
- Monthly cashflow
- —
- DSCR
- —
- Eligible?
- —
Short-term bridge; refi at stabilization.
Rent comps 26 comps
| Address | Beds | Baths | Sqft | Rent | $/sqft | DOM | Units | Dist |
|---|---|---|---|---|---|---|---|---|
| 3815 Lakehurst Dr Colorado Springs, CO | 2.0 | 1.0 | 700 | $1,241 | $1.77 | 23d | 1 | 0.20mi |
| 3885 Lakehurst Dr Colorado Springs, CO | 1.0–2.0 | 1.0 | 578 | $1,253 | $2.17 | 3d | 10 | 0.21mi |
| 3860 Patrick Dr Unit 21 Colorado Springs, CO | 2.0 | 1.0 | 1000 | $1,429 | $1.43 | 14d | 1 | 0.25mi |
| 3080 Starlight Cir Colorado Springs, CO | 2.0 | 2.0 | 928 | $1,650 | $1.78 | 23d | 1 | 0.43mi |
| 3066 Starlight Cir Colorado Springs, CO | 2.0 | 1.5 | 928 | $1,300 | $1.40 | 3d | 1 | 0.44mi |
| 3178 Starlight Cir Colorado Springs, CO | 2.0 | 1.5 | 928 | $1,550 | $1.67 | 23d | 1 | 0.51mi |
| 4221 Baytown Dr Unit 4221 Colorado Springs, CO | 2.0 | 2.0 | 1067 | $1,650 | $1.55 | 21d | 1 | 0.56mi |
| 2730 Bentley Pt Colorado Springs, CO | 1.0–2.0 | 1.0–2.0 | 715 | $1,111 | $1.55 | 23d | 8 | 0.58mi |
| 3310 Cochran Dr Unit D Colorado Springs, CO | 2.0 | 1.0 | 850 | $1,249 | $1.47 | 23d | 1 | 0.60mi |
| 3480 Cochran Dr Colorado Springs, CO | 2.0 | 1.0 | 884 | $995 | $1.13 | 21d | 1 | 0.63mi |
| 3445 Cochran Dr Unit B Colorado Springs, CO | 2.0 | 1.0 | 884 | $1,400 | $1.58 | 23d | 1 | 0.64mi |
| 3475 Cochran Dr Colorado Springs, CO | 2.0 | 1.0 | 884 | $1,250 | $1.41 | 21d | 1 | 0.65mi |
| 2129 Delta Dr Colorado Springs, CO | 2.0–3.0 | 1.0–1.5 | 960 | $1,025 | $1.07 | 23d | 4 | 1.15mi |
| 2521 Astrozon Cir Unit 2523 Colorado Springs, CO | 2.0 | 1.0 | 800 | $1,395 | $1.74 | 3d | 1 | 1.17mi |
| 2521 Astrozon Cir Unit 2525 Colorado Springs, CO | 2.0 | 1.0 | 800 | $1,395 | $1.74 | 14d | 1 | 1.17mi |
| 3562 Lenoso Ter Colorado Springs, CO | 2.0 | 1.5 | 985 | $1,650 | $1.68 | 3d | 6 | 1.22mi |
| 4537 Lamplighter Cir Colorado Springs, CO | 2.0 | 1.5 | 1028 | $1,195 | $1.16 | 3d | 1 | 1.26mi |
| 2023 Murray Creek Ct Colorado Springs, CO | 1.0 | 1.0 | 569 | $1,394 | $2.45 | 3d | 4 | 1.30mi |
| 2218 Carmel Dr Colorado Springs, CO | 3.0 | 1.0 | 1000 | $1,950 | $1.95 | 23d | 1 | 1.33mi |
| 1960 S Chelton Rd Colorado Springs, CO | 3.0 | 1.0–2.0 | 810 | $1,223 | $1.51 | 23d | 1 | 1.37mi |
| 2102 Carmel Dr Colorado Springs, CO | 1.0 | 1.0 | 548 | $749 | $1.37 | 23d | 1 | 1.44mi |
| 2050 Del Mar Dr Colorado Springs, CO | 3.0 | 1.0 | 912 | $2,095 | $2.30 | 23d | 1 | 1.45mi |
| 4840 Manzana Dr Colorado Springs, CO | 1.0–2.0 | 1.0 | 700 | $1,350 | $1.93 | 3d | 7 | 1.45mi |
| 4046 Mallette Hts Colorado Springs, CO | 1.0–2.0 | 1.0–2.0 | 737 | $1,659 | $2.25 | 3d | 6 | 1.47mi |
| 1825 Zebulon Dr Colorado Springs, CO | 2.0 | 1.0 | 851 | $1,066 | $1.25 | 23d | 1 | 1.47mi |
| 1785 Zebulon Dr Unit D Colorado Springs, CO | 2.0 | 1.0 | 700 | $1,125 | $1.61 | 14d | 1 | 1.50mi |
Listing history 15 events
-
2026-06-18days on market $42,000 Active 198 DOM
-
2026-06-17days on market $42,000 Active 197 DOM
-
2026-06-16days on market $42,000 Active 196 DOM
-
2026-06-15days on market $42,000 Active 195 DOM
-
2026-06-14days on market $42,000 Active 193 DOM
-
2026-06-13days on market $42,000 Active 192 DOM
-
2026-06-10days on market $42,000 Active 190 DOM
-
2026-06-09days on market $42,000 Active 189 DOM
-
2026-06-08days on market $42,000 Active 188 DOM
-
2026-06-07days on market $42,000 Active 187 DOM
-
2026-06-05days on market $42,000 Active 184 DOM
-
2026-06-03days on market $42,000 Active 183 DOM
-
2026-06-03days on market $42,000 Active 182 DOM
-
2026-06-01pricedays on market $42,000 Active 181 DOM
-
2026-05-31days on market $41,500 Active 180 DOM
ⓘ Source: listings_history table (triggers on properties + properties_extension) + one-shot
backfill from property_details.listing_events for pre-trigger history.
Climate risk First Street
- Flood 1/10 Low FEMA zone X (unshaded) · 0% chance over 30 yrs
- Wildfire 3/10 Moderate
- Heat 3/10 Moderate 7 d/yr ≥90°F today · 19 d/yr by 30 yrs out
- Wind 2/10 Low
- Air quality 1/10 Low 0 unhealthy d/yr today · 0 by 30 yrs out
Nearby sold comps map
Loading sold comps map…
Walkable amenities ~0.75 mi
Loading nearby amenities…
Taxation est. · year 1
- Rental income
- $16,954
- − Mortgage interest
- −$2,353
- − Property taxes
- −$630
- − Insurance
- −$210
- − Repairs & maintenance
- −$1,356
- − Management
- −$1,356
- − Depreciation
- −$1,222
- Taxable income
- $9,827
- Est. tax owed @ 24.0%
- −$2,358
- After-tax cash flow
- $7,552/yr
For passive investors: Depreciation is non-cash, so a rental often shows a tax loss while cash-flowing — sheltering income. Rental losses are passive: they offset passive income freely, and up to $25,000/yr can offset ordinary (W-2) income if you actively participate and your MAGI is under $100k (phasing out to $0 by $150k); unused losses carry forward. On sale, claimed depreciation is recaptured at up to 25%, and gains may owe capital-gains tax (a 1031 exchange can defer both). Figures are a year-1 estimate at your 24.0% rate — not tax advice; consult a CPA.
Schools (NCES district)
- District
- Harrison School District No. 2 In The County Of El Paso An
- NCES district ID
- 0804530
- Math proficiency
- 16% ▼ -13.00%
- Reading proficiency
- 35% ▼ -7.00%
- Median HH income
- $40,242
- Composite
- 21.47/100
- National rank
- #8333
- State rank
- #67 of 86 in CO
Livability — Colorado Springs
- Score
- 78/100
- State rank
- #23
- US rank
- #2639
Category grades
Schools grade is shown separately in the Schools card above.
Census & demographics
- Census place
- Colorado Springs, CO
- County
- El Paso County · 689,348 people
- City population
- 555,783
- Metro
- Colorado Springs, CO
- Population (ZIP)
- 41,104
- Household income
- $67,127
- Rent vs Own
- Severe rent burden
- 2041.0
Population outlook (El Paso County) Hauer SSP2
- Today (2025)
- 768,926 people
- By 2030
- 815,739 · +6.1%
- By 2040
- 903,489 · +17.5%
- By 2050
- 981,204 · +27.6%
- By 2075
- 1,155,542 · +50.3%
- By 2100
- 1,202,070 · +56.3%
Race, ethnicity, and origin ACS 2023
- Neighborhood character
- Diverse neighborhood (Simpson 0.70)
- Race & ethnicity
- Hispanic / Latino 38% White 37% Two or more races 18% Black 15% Asian 3% Native American 2%
- Hispanic origin (detail)
- Mexican 28% Puerto Rican 2%
- Common ancestry
- Lithuanian 1% Romanian 1% Slovak 1%
- Foreign-born
- 13% · Canada, South Korea
- Languages at home
- 73% English-only · Spanish 22% French/Haitian/Cajun 1% Tagalog/Filipino 1%
Political lean MEDSL · El Paso
- 2024 margin
- Lean R (+9.8) · D 43.8% · R 53.5% · Other 2.7%
- 2008→2024 swing
- +9.0pp toward D · 2008: -18.8pp · 2024: -9.8pp
- All cycles
- 2024: R+9.8 2020: R+10.8 2016: R+22.6 2012: R+21.4 2008: R+18.8
Not yet ingested
- Civics
- —
Market trends
- HPI YoY
- ▼ -114.77%
- Current HPI
- 301.5415
- Rent YoY
- ▲ 2.36%
- Metro
- Colorado Springs, CO
- State GDP YoY
- ▲ 1.95%
- F500 in state
- 14
Industry mix (Fortune 500 HQ in CO)
| Industry | F500 HQs | Revenue |
|---|---|---|
| Technology Distribution | 1 | $31B |
|
||
| Food / Agriculture | 1 | $18B |
|
||
| Packaging | 1 | $14B |
|
||
| Healthcare | 1 | $13B |
|
||
| Energy | 1 | $10B |
|
||
| Technology | 1 | $4B |
|
||
Cash-flow waterfall
monthlySold comps — $/sqft
last 12 mo · ≤1 miLoading sold comps…