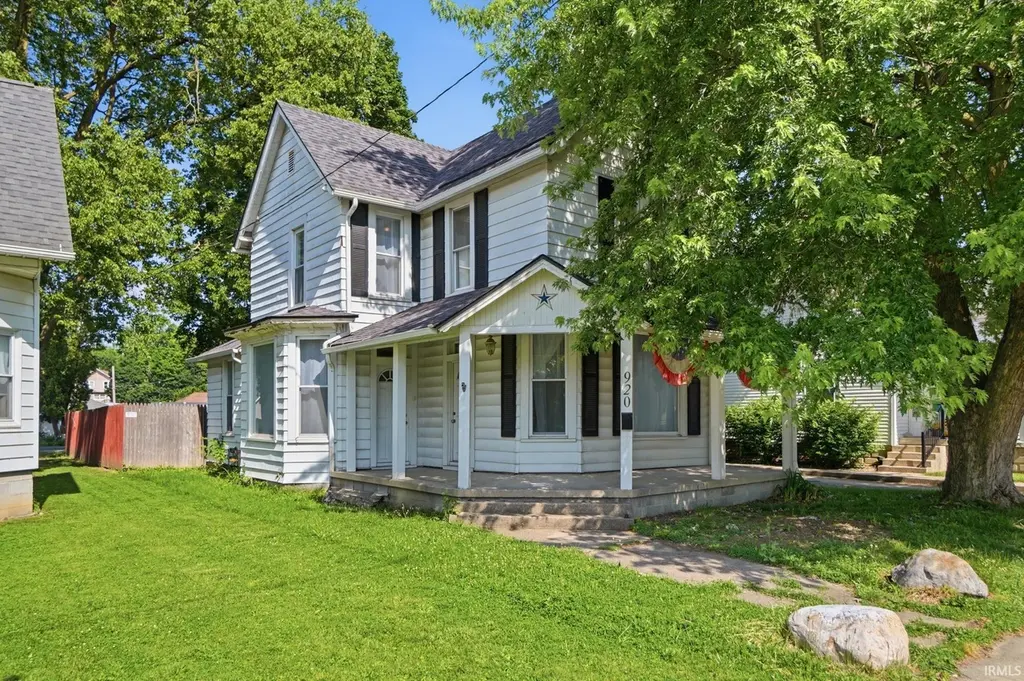
920 First St · Huntington, IN
Flood risk 4/10 · Minor
- FEMA flood zone
- X (unshaded)
- Chance of flooding over 30 yrs
- 0.22%
- Est. flood insurance / yr
- $473 – $860
Fire risk 1/10 · Minimal
- Est. fire insurance / yr
- $717 – $1,331
Heat risk 3/10 · Minor
- Hot days now (above 101°F)
- 7 days/yr
- Hot days in 30 yrs
- 17 days/yr
Wind risk 2/10 · Minimal
- Chance of severe wind over 30 yrs
- —
Air-quality risk 3/10 · Minor
- Unhealthy air days now
- 1 days/yr
- Unhealthy air days in 30 yrs
- 3 days/yr
Risk factors via First Street. Map © Google.
Why this score? — see what drove the C grade
The composite is a weighted blend of 9 inputs, each scored 0–100. Each bar is that input's sub-score; the figure is the points it added to the 100-point composite (weight × sub-score).
- Cash flow +20.8/30.0
- ARV discount +15.0/15.0
- DSCR +6.6/10.0
- 1% rule +4.9/10.0
- Livability +3.5/5.0
- Schools +3.1/10.0
- Rent growth +2.5/5.0
- Condition / age +2.5/5.0
- Appreciation +0.0/10.0
$110,000
🖨 Deal sheet 📄 Offer letter ✓ Due diligence
Listing remarks MLS
Remodeled 4 Bedroom Home on First Street in Huntington! Be sure to view this wonderful Recently updated home. Enjoy upcoming Spring and Summer Days on the wonderful covered front porch. .. inside you will find 4 bedrooms including a main level master bedroom! Lots of space and Conveniently located on Huntington's Northside near old 24 with lots of charm and character, outside you will love the privacy fenced yard and the care and updates that have been put into this home. .. .. C
Key facts
- Large windows
- Functional kitchen
- Updated sewer line
Tags
Property features AI
Exterior
- Parking: Off-street parking
- Utilities: Public water; Public sewer
- Home design: Single-family residential site-built home; 2 stories; Entry at main level
- Construction: Aluminum siding; Built with a foundation and partial unfinished basement
- Exterior features: Deck; Covered porch; Fire pit; Privacy fencing; Level lot; Paved, publicly maintained road
Interior
- Kitchen: Refrigerator
- Bedrooms: Total of 7 rooms (bedrooms included)
- Bathrooms: 1 full bathroom (main level)
- Heating & cooling: Natural gas forced air heating; Central air conditioning; Ceiling fan(s) for cooling
- Interior features: Ceiling fan(s); Partial unfinished basement with exterior entry
- Laundry & utility: Washer; Dryer; Electric dryer hookup on main level; Electric water heater
Neighborhood map
What this means for you Summary
Snapshot
- This is a 3-bed/1.0-bath single-family listed at $110k.
Deal economics
- At list price, monthly cash flow is $152 ($2k/yr) — positive.
- The deal already cash-flows at list — no discount required.
- To meet the 1% rule (rent ≥ 1% of price), the offer needs to be $109k (0.8% below list).
- Recommended offer: $109k (0.8% below list) — sets the bar for 1% rule.
- Cap rate 7.9% vs local median 4.3% in Huntington — top-decile yield for the area; either an underpriced asset or a hidden risk that comps aren't pricing in. Stress-test before assuming the spread holds.
Location & tenants
- Location reads 69/100 on livability (#193 in IN) — a middle-class / working-renter tenant base. Strengths: crime A+, cost of living A+, housing A+; Watch: health & safety C-, employment D, amenities F.
- Huntington County Community School Corporation (rural): math 34% / reading 39% proficiency, ranked #176 of 301 in IN (top 58%) — families likely to look elsewhere, expect single-tenant / working-renter base with shorter leases.
- Zoned schools: Flint Springs Elementary (math 35% / reading 38%, grade F, #571 of 994 statewide, top 58%, 461 students, 55% FRL); Crestview Middle School (math 28% / reading 38%, grade F, #180 of 330 statewide, top 56%, 606 students, 47% FRL); Huntington North High School (math 30% / reading 55%, grade F, #195 of 369 statewide, top 53%, 1,424 students, 42% FRL).
- Market conditions: 112 active listings in the ZIP; 79 units permitted in Huntington County in 2024 (0 in 5+ unit buildings).
Forward outlook
- Local home prices are declining (-3.0%/yr); year-one equity from $761 of loan paydown is wiped out by about $3k of value loss. Plan a longer hold.
- Huntington County population projected at -14% by 2050 — secular population decline; favor cash flow + early exit over multi-decade hold.
Negotiation context
- Only 4 days on market — expect competitive offers; lowballing is unlikely to land.
- 3 sale attempts since 9y ago with the ask held roughly flat each time — persistent listings suggest the price (not the market) is what's stuck; bring a comps-based counter.
- Current owner paid $64k; list at $110k implies a 72% gain — meaningful room to come down on a strong offer.
Risks & watch-outs
- Watch-outs: built in 1955 — expect roof / HVAC / electrical / plumbing capex.
Questions for the listing agent
- Built in 1955 — when were the roof, HVAC, electrical panel, plumbing, and water heater last replaced?
- Is there a deadline driving the sale (1031 exchange, divorce, estate, relocation)? That informs how much negotiation room exists.
- Schools are D-rated, which usually means shorter tenancies and higher turnover. Who's the typical renter profile here, and what's been the actual vacancy rate?
- What's the average days-on-market for RENTAL listings here right now (not sales)? A rising rental-DOM trend means longer vacancies and softer asking-rent achievability than the comps imply.
- What's the recent tenant-quality profile in this submarket — average credit score on applications, eviction rate, late-payment / NSF rate, and stable-employment percentage? A property-management company in the area should have these aggregated.
- How much new for-sale + rental construction is in the pipeline within 1–3 miles? Heavy new supply typically softens prices + rents 12–24 months out; constrained supply supports both.
Investment metrics
- 1% rule
- 0.99% ✗
- Cap rate
- 7.95%
- Cash-on-cash
- 5.92%
- DSCR
- 1.26
- GRM
- 8.4
CMA / ARV
- ARV (on-the-fly)
- $145,044
- Comps found
- 12
Show comp detail 12 sales within ~0.75 mi
| Address | Dist | Beds/Ba | Sqft | Sold | Price | $/sf | Match |
|---|---|---|---|---|---|---|---|
| 617 E Franklin St | 0.33mi | 2/1.0 (-1) | 1,370 (+2%) | 0mo | $74,900 | $55 | 76 |
| 736 Woodlawn Ave | 0.07mi | 3/1.0 | 1,509 (+12%) | 3mo | $105,000 | $70 | 74 |
| 604 Kintz St | 0.48mi | 2/1.0 (-1) | 1,324 (-1%) | 1mo | $145,000 | $110 | 69 |
| 1111 Cherry St | 0.53mi | 2/1.5 (-1) | 1,335 (-1%) | 1mo | $165,000 | $124 | 67 |
| 1806 Guilford St | 0.63mi | 3/2.0 | 1,326 (-1%) | 0mo | $143,000 | $108 | 64 |
| 954 Jackson St | 0.64mi | 3/1.5 | 1,356 (+1%) | 3mo | $139,900 | $103 | 64 |
| 1720 Canfield St | 0.39mi | 3/1.0 | 1,179 (-12%) | 2mo | $180,000 | $153 | 60 |
| 419 2nd St | 0.34mi | 3/1.0 | 1,166 (-13%) | 3mo | $106,500 | $91 | 60 |
| 1739 Stults Rd | 0.53mi | 2/1.0 (-1) | 1,256 (-6%) | 1mo | $46,750 | $37 | 58 |
| 516 Webster St | 0.44mi | 2/1.0 (-1) | 1,180 (-12%) | 1mo | $59,000 | $50 | 53 |
| 495 Himes St | 0.74mi | 4/2.0 (+1) | 1,382 (+3%) | 0mo | $232,000 | $168 | 52 |
| 1140 Superior St | 0.60mi | 3/1.0 | 1,144 (-15%) | 1mo | $125,000 | $109 | 47 |
Match score weights: distance 35% · size 25% · config 20% · recency 20%. Top-matched comps best support the ARV.
Projected returns pro-forma
-3.0% appreciation · 3.0% rent growth · sell at horizon
- IRR
- -7.2%
- Equity multiple
- 0.73×
- Total profit
- $-8,167
- Equity at exit
- $16,401
- IRR
- 2.4%
- Equity multiple
- 1.17×
- Total profit
- $5,284
- Equity at exit
- $9,511
Cash invested: $30,800 (down + closing). Projections, not guarantees.
Landlord ↔ Tenant lean methodology
- Overall (STATE)
- 90 Strongly Landlord-Friendly
- State Indiana
- 90 Strongly Landlord-Friendly · R+11
- County
- — inherits STATE
- City
- — inherits STATE
ZIP-level market 46750
- Home prices YoY
- -33.0%
- Active inventory
- 112
- Price-to-rent
- 8.4×
Monthly cashflow live
- Estimated rent
- $1,091 medium interval (Pro) →
- Mortgage (P&I)
- −$577
- Tax from tax record
- −$87 /mo · $1,046/yr
- Insurance
- −$46
- HOA
- −$0
- Vacancy / Maint / Mgmt
- −$229
- Net cashflow
- $152
Break-even live
UW: 25.0% down · 7.5% · 30yr · 1.5% tax · 5.0% vac · 8.0% maint · 8.0% mgmt
Financing live
Cash to close
- Down payment
- $27,500
- Closing costs
- $3,300
- Reserves months
- —
- Total cash needed
- —
Loan-product check · same deal, 3 products live
Conventional
25% down · 7.5% · 30yr
- Down + closing
- —
- Monthly P&I
- —
- Monthly cashflow
- —
- DSCR
- —
- Eligible?
- —
Personal DTI + credit; lowest rate.
DSCR
20% down · 8.5% · 30yr
- Down + closing
- —
- Monthly P&I
- —
- Monthly cashflow
- —
- DSCR
- —
- Eligible?
- —
No personal income docs; deal must DSCR.
Hard money
10% down · 12.0% · 12mo
- Down + closing
- —
- Monthly P&I
- —
- Monthly cashflow
- —
- DSCR
- —
- Eligible?
- —
Short-term bridge; refi at stabilization.
Listing history 5 events
-
2026-06-16status $110,000 Pending 4 DOM
-
2026-06-15days on market $110,000 Active 4 DOM
-
2026-06-14days on market $110,000 Active 2 DOM
-
2026-06-12remarks 687-char remark
-
2026-06-12$110,000 Active 1 DOM
ⓘ Source: listings_history table (triggers on properties + properties_extension) + one-shot
backfill from property_details.listing_events for pre-trigger history.
Tax reassessment forecast IN · Partial reset (capped growth)
- Current annual tax
- $1,046 · $87/mo
- Projected year-2 tax
- $1,046 · $87/mo
- Expected delta
- $0/yr ($0/mo · 0.0%)
ⓘ Screening estimate from a state-policy table — verify with the county assessor before closing.
Climate risk First Street
- Flood 4/10 Moderate FEMA zone X (unshaded) · 22% chance over 30 yrs
- Wildfire 1/10 Low
- Heat 3/10 Moderate 7 d/yr ≥101°F today · 17 d/yr by 30 yrs out
- Wind 2/10 Low
- Air quality 3/10 Moderate 1 unhealthy d/yr today · 3 by 30 yrs out
Nearby sold comps map
Loading sold comps map…
Walkable amenities ~0.75 mi
Loading nearby amenities…
Taxation est. · year 1
- Rental income
- $13,089
- − Mortgage interest
- −$6,162
- − Property taxes
- −$1,046
- − Insurance
- −$550
- − Repairs & maintenance
- −$1,047
- − Management
- −$1,047
- − Depreciation
- −$3,200
- Taxable income
- $37
- Est. tax owed @ 24.0%
- −$9
- After-tax cash flow
- $1,813/yr
For passive investors: Depreciation is non-cash, so a rental often shows a tax loss while cash-flowing — sheltering income. Rental losses are passive: they offset passive income freely, and up to $25,000/yr can offset ordinary (W-2) income if you actively participate and your MAGI is under $100k (phasing out to $0 by $150k); unused losses carry forward. On sale, claimed depreciation is recaptured at up to 25%, and gains may owe capital-gains tax (a 1031 exchange can defer both). Figures are a year-1 estimate at your 24.0% rate — not tax advice; consult a CPA.
Schools (NCES district)
- District
- Huntington County Community School Corporation
- NCES district ID
- 1804710
- Math proficiency
- 34% ▼ -6.00%
- Reading proficiency
- 39% ▼ -10.00%
- Median HH income
- $47,010
- Composite
- 31.29/100
- National rank
- #6013
- State rank
- #176 of 301 in IN
Livability — Huntington
- Score
- 69/100
- State rank
- #193
- US rank
- #8771
Category grades
Schools grade is shown separately in the Schools card above.
Census & demographics
- Census place
- Huntington, IN
- City population
- 27,341
- Population (ZIP)
- 27,341
Population outlook (Huntington County) Hauer SSP2
- Today (2025)
- 35,613 people
- By 2030
- 34,759 · -2.4%
- By 2040
- 32,682 · -8.2%
- By 2050
- 30,495 · -14.4%
- By 2075
- 26,298 · -26.2%
- By 2100
- 22,653 · -36.4%
Race, ethnicity, and origin ACS 2023
- Neighborhood character
- Predominantly White (93%)
- Race & ethnicity
- White 93% Hispanic / Latino 3% Two or more races 2% Black 1%
- Common ancestry
- Italian 2% Slovak 2% Romanian 2%
- Foreign-born
- 2% · China, Canada
- Languages at home
- 96% English-only · Spanish 2% Chinese 1% German/W. Germanic 1%
Political lean MEDSL · Huntington
- 2024 margin
- Solid R (+48.4) · D 24.9% · R 73.3% · Other 1.8%
- 2008→2024 swing
- -21.2pp toward R · 2008: -27.2pp · 2024: -48.4pp
- All cycles
- 2024: R+48.4 2020: R+49.9 2016: R+51.0 2012: R+39.8 2008: R+27.2
Not yet ingested
- Civics
- —
Market trends
- HPI YoY
- ▼ -106.89%
- Current HPI
- 216.5969
- Rent YoY
- —
- Metro
- —
- State GDP YoY
- ▲ 2.90%
- F500 in state
- 18
Industry mix (Fortune 500 HQ in IN)
| Industry | F500 HQs | Revenue |
|---|---|---|
| Industrial Machinery | 2 | $37B |
|
||
| Healthcare | 1 | $177B |
|
||
| Pharmaceuticals | 1 | $45B |
|
||
| Metals / Steel | 1 | $18B |
|
||
| Agriculture | 1 | $17B |
|
||
| Packaging | 1 | $12B |
|
||
Price history
+71.9% since first listed5 events — show timeline
- 2026-06-11 Listed $110,000 IRMLS
- 2018-02-26 Sold (MLS) $64,000 IRMLS
- 2018-01-01 Listed $65,000 IRMLS
- 2017-09-29 Listed $65,000 IRMLS
- 2009-06-26 Sold (Public Records) $64,000 Public Records
Property tax history
+11.2%/yrLatest (2024): $1,046 · +5.7% YoY. Source: county tax records.
Cash-flow waterfall
monthlySold comps — $/sqft
last 12 mo · ≤1 miLoading sold comps…