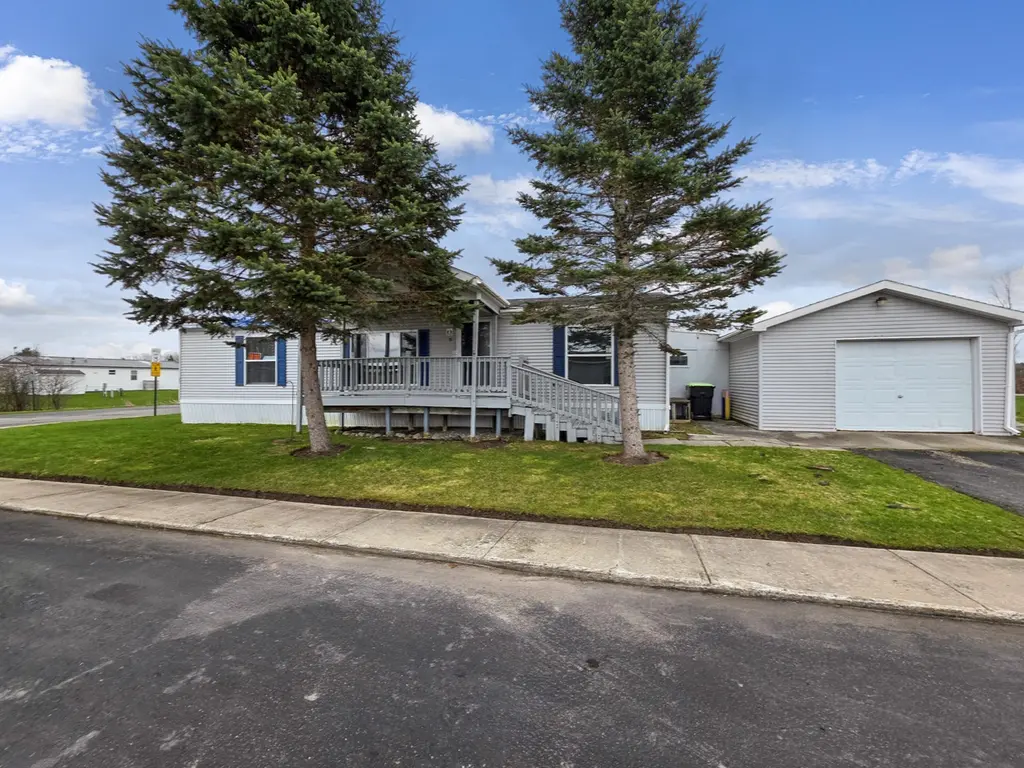
73 Chelsey Ln · Cheboygan, MI
Flood risk No data
- FEMA flood zone
- —
- Chance of flooding over 30 yrs
- —
- Est. flood insurance / yr
- —
Fire risk No data
- Est. fire insurance / yr
- —
Heat risk No data
- Hot days now (above threshold)
- —
- Hot days in 30 yrs
- —
Wind risk No data
- Chance of severe wind over 30 yrs
- —
Air-quality risk No data
- Unhealthy air days now
- —
- Unhealthy air days in 30 yrs
- —
Risk factors via First Street. Map © Google.
Why this score? — see what drove the B- grade
The composite is a weighted blend of 9 inputs, each scored 0–100. Each bar is that input's sub-score; the figure is the points it added to the 100-point composite (weight × sub-score).
- Cash flow +27.6/30.0
- DSCR +9.7/10.0
- 1% rule +7.5/10.0
- ARV discount +7.5/15.0
- Condition / age +4.0/5.0
- Livability +3.6/5.0
- Schools +2.9/10.0
- Rent growth +2.5/5.0
- Appreciation +0.0/10.0
$75,000
🖨 Deal sheet 📄 Offer letter ✓ Due diligence
Listing remarks
Affordable living just outside of Cheboygan in Huron Mobile Estates! Recently remodeled and move-in ready, this 3 bedroom, 2 bath home features a desirable split bedroom floor plan along with brand new paint and flooring throughout. Situated on a corner lot on the outside edge of the park, the property also includes a detached garage and storage shed for extra convenience. A great opportunity for affordable homeownership with low-maintenance living. Buyer must be approved by the park.
Key facts
- Recently remodeled
- Storage shed
- Corner lot
Tags
Property features AI
Finance
- HOA & community: Monthly association fee; Located in Huron Estates MHP
Exterior
- Parking: Detached 2-car garage
- Utilities: Public water; Public sewer
- Home design: Single-family residence; Residential property
- Construction: Pillar/post/pier foundation
- Exterior features: Paved road access; Shed(s)
Interior
- Kitchen: Dishwasher; Refrigerator; Oven; Range
- Bedrooms: Bedrooms not separately detailed
- Flooring: Simulated wood
- Bathrooms: 3 full bathrooms
- Heating & cooling: Forced air heating; Natural gas heating; Central heating; Ceiling fan(s)
- Interior features: Vaulted ceilings; Walk-in closet(s)
- Laundry & utility: Laundry on main level
Neighborhood map
What this means for you Summary
Snapshot
- This is a 3-bed/3.0-bath single-family listed at $75k. Condition is rated good.
Deal economics
- At list price, monthly cash flow is $224 ($3k/yr) — positive.
- The deal already cash-flows at list — no discount required.
- Meets the 1% rule at list price ($939 rent vs $75k).
- Recommended offer: $74k (1.5% below list) — sets the bar for market timing.
- Cap rate 9.9% vs local median 3.2% in Cheboygan — top-decile yield for the area; either an underpriced asset or a hidden risk that comps aren't pricing in. Stress-test before assuming the spread holds.
Location & tenants
- Location reads 72/100 on livability (#251 in MI) — a middle-class / working-renter tenant base. Strengths: cost of living A+, housing A+, health & safety A+; Watch: schools F, amenities F, commute F.
- Cheboygan Area Schools (town): math 27% / reading 43% proficiency, ranked #307 of 540 in MI (top 57%) — families likely to look elsewhere, expect single-tenant / working-renter base with shorter leases.
- Market conditions: 163 active listings in the ZIP; 78 units permitted in Cheboygan County in 2024 (0 in 5+ unit buildings).
Forward outlook
- Local home prices are declining (-3.0%/yr); year-one equity from $519 of loan paydown is wiped out by about $2k of value loss. Plan a longer hold.
- Cheboygan County population projected at -30% by 2050 — secular population decline; favor cash flow + early exit over multi-decade hold.
- At projected returns (-3.0% appreciation + 3.0% rent growth), your $21k cash investment doubles in ~9 years — after that, you're playing with house money.
Negotiation context
- It's been on market 23 days — a 2% lower offer ($74k) is reasonable based on typical stale-listing flexibility.
Questions for the listing agent
- Is there a deadline driving the sale (1031 exchange, divorce, estate, relocation)? That informs how much negotiation room exists.
- Schools are F-rated, which usually means shorter tenancies and higher turnover. Who's the typical renter profile here, and what's been the actual vacancy rate?
- What's the average days-on-market for RENTAL listings here right now (not sales)? A rising rental-DOM trend means longer vacancies and softer asking-rent achievability than the comps imply.
- What's the recent tenant-quality profile in this submarket — average credit score on applications, eviction rate, late-payment / NSF rate, and stable-employment percentage? A property-management company in the area should have these aggregated.
- How much new for-sale + rental construction is in the pipeline within 1–3 miles? Heavy new supply typically softens prices + rents 12–24 months out; constrained supply supports both.
Investment metrics
- 1% rule
- 1.25% ✓
- Cap rate
- 9.87%
- Cash-on-cash
- 12.78%
- DSCR
- 1.57
- GRM
- 6.7
CMA / ARV
- ARV (on-the-fly)
- $49,248
- Comps found
- 6
Show comp detail 6 sales within ~0.75 mi
| Address | Dist | Beds/Ba | Sqft | Sold | Price | $/sf | Match |
|---|---|---|---|---|---|---|---|
| 72 Chelsey Ln | 0.02mi | 3/2.0 | 1,296 (0%) | 12mo | $49,100 | $38 | 85 |
| 100 Woodland Ct | 0.14mi | 3/2.5 | 1,352 (+4%) | 7mo | $51,000 | $38 | 78 |
| 15 Chelsey Ln Lot 15 | 0.26mi | 2/2.0 (-1) | 1,280 (-1%) | 2mo | $39,900 | $31 | 75 |
| 52 Chelsey Ln | 0.09mi | 3/2.0 | 1,280 (-1%) | 19mo | $36,500 | $29 | 74 |
| 13 Chelsey Ln | 0.27mi | 2/2.0 (-1) | 1,280 (-1%) | 20mo | $23,000 | $18 | 60 |
| 1011 Donald Ct | 0.73mi | 3/1.0 | 1,248 (-4%) | 3mo | $242,000 | $194 | 49 |
Match score weights: distance 35% · size 25% · config 20% · recency 20%. Top-matched comps best support the ARV.
Projected returns pro-forma
-3.0% appreciation · 3.0% rent growth · sell at horizon
- IRR
- 2.6%
- Equity multiple
- 1.10×
- Total profit
- $2,104
- Equity at exit
- $11,183
- IRR
- 12.2%
- Equity multiple
- 1.96×
- Total profit
- $20,231
- Equity at exit
- $6,485
Cash invested: $21,000 (down + closing). Projections, not guarantees.
Landlord ↔ Tenant lean methodology
- Overall (STATE)
- 62 Landlord-Friendly
- State Michigan
- 62 Landlord-Friendly · EVEN
- County
- — inherits STATE
- City
- — inherits STATE
ZIP-level market 49721
- Active inventory
- 163
- Price-to-rent
- 6.7×
Monthly cashflow live
- Estimated rent
- $939 medium interval (Pro) →
- Mortgage (P&I)
- −$393
- Tax est. 1.5%
- −$94 /mo · $1,125/yr
- Insurance
- −$31
- HOA
- −$0
- Vacancy / Maint / Mgmt
- −$197
- Net cashflow
- $224
Break-even live
UW: 25.0% down · 7.5% · 30yr · 1.5% tax · 5.0% vac · 8.0% maint · 8.0% mgmt
Financing live
Cash to close
- Down payment
- $18,750
- Closing costs
- $2,250
- Reserves months
- —
- Total cash needed
- —
Loan-product check · same deal, 3 products live
Conventional
25% down · 7.5% · 30yr
- Down + closing
- —
- Monthly P&I
- —
- Monthly cashflow
- —
- DSCR
- —
- Eligible?
- —
Personal DTI + credit; lowest rate.
DSCR
20% down · 8.5% · 30yr
- Down + closing
- —
- Monthly P&I
- —
- Monthly cashflow
- —
- DSCR
- —
- Eligible?
- —
No personal income docs; deal must DSCR.
Hard money
10% down · 12.0% · 12mo
- Down + closing
- —
- Monthly P&I
- —
- Monthly cashflow
- —
- DSCR
- —
- Eligible?
- —
Short-term bridge; refi at stabilization.
Listing history 16 events
-
2026-06-18days on market $75,000 Active 23 DOM
-
2026-06-17days on market $75,000 Active 22 DOM
-
2026-06-16days on market $75,000 Active 21 DOM
-
2026-06-15days on market $75,000 Active 20 DOM
-
2026-06-13days on market $75,000 Active 18 DOM
-
2026-06-12days on market $75,000 Active 17 DOM
-
2026-06-09days on market $75,000 Active 14 DOM
-
2026-06-08days on market $75,000 Active 13 DOM
-
2026-06-07days on market $75,000 Active 12 DOM
-
2026-06-07days on market $75,000 Active 11 DOM
-
2026-06-04days on market $75,000 Active 8 DOM
-
2026-06-02days on market $75,000 Active 7 DOM
-
2026-06-01days on market $75,000 Active 6 DOM
-
2026-05-31days on market $75,000 Active 5 DOM
-
2026-05-31days on market $75,000 Active 4 DOM
-
2026-05-26$75,000 Active
ⓘ Source: listings_history table (triggers on properties + properties_extension) + one-shot
backfill from property_details.listing_events for pre-trigger history.
Nearby sold comps map
Loading sold comps map…
Walkable amenities ~0.75 mi
Loading nearby amenities…
Taxation est. · year 1
- Rental income
- $11,270
- − Mortgage interest
- −$4,201
- − Property taxes
- −$1,125
- − Insurance
- −$375
- − Repairs & maintenance
- −$902
- − Management
- −$902
- − Depreciation
- −$2,182
- Taxable income
- $1,584
- Est. tax owed @ 24.0%
- −$380
- After-tax cash flow
- $2,304/yr
For passive investors: Depreciation is non-cash, so a rental often shows a tax loss while cash-flowing — sheltering income. Rental losses are passive: they offset passive income freely, and up to $25,000/yr can offset ordinary (W-2) income if you actively participate and your MAGI is under $100k (phasing out to $0 by $150k); unused losses carry forward. On sale, claimed depreciation is recaptured at up to 25%, and gains may owe capital-gains tax (a 1031 exchange can defer both). Figures are a year-1 estimate at your 24.0% rate — not tax advice; consult a CPA.
Condition & rehab AI · 13 photos
This recently remodeled and move-in ready home features new cabinets, countertops, flooring, and paint throughout, with a good exterior and landscaping. It is in excellent condition and ready for immediate occupancy.
Value-add opportunities
- Both landscaping — enhances curb appeal and adds value
- Both painting — refreshes the home's appearance
- Both HVAC maintenance — ensures comfort and energy efficiency
Renovation cost estimate screening
Value-add ROI direction
- Both landscaping — enhances curb appeal and adds value ↑
- Both painting — refreshes the home's appearance ↑
- Both HVAC maintenance — ensures comfort and energy efficiency ↑
ⓘ Cost ranges are severity-bucket heuristics (US national rule-of-thumb). Get contractor quotes + a written scope before underwriting a rehab budget.
Schools (NCES district)
- District
- Cheboygan Area Schools
- NCES district ID
- 2608910
- Math proficiency
- 27% ▼ -7.00%
- Reading proficiency
- 43% ▼ -3.00%
- Median HH income
- $37,751
- Composite
- 29.12/100
- National rank
- #6590
- State rank
- #307 of 540 in MI
Livability — Cheboygan
- Score
- 72/100
- State rank
- #251
- US rank
- #6261
Category grades
Schools grade is shown separately in the Schools card above.
Census & demographics
- Census place
- Cheboygan, MI
- Population (ZIP)
- 13,937
Population outlook (Cheboygan County) Hauer SSP2
- Today (2025)
- 23,773 people
- By 2030
- 22,545 · -5.2%
- By 2040
- 19,526 · -17.9%
- By 2050
- 16,547 · -30.4%
- By 2075
- 11,263 · -52.6%
- By 2100
- 7,290 · -69.3%
Race, ethnicity, and origin ACS 2023
- Neighborhood character
- Predominantly White (91%)
- Race & ethnicity
- White 91% Two or more races 4% Native American 3% Hispanic / Latino 2% Black 1%
- Common ancestry
- Romanian 10% Lithuanian 8% Iranian 3%
- Foreign-born
- 2% · Canada
- Languages at home
- 97% English-only · Spanish 1% German/W. Germanic 1%
Political lean MEDSL · Cheboygan
- 2024 margin
- Solid R (+31.1) · D 33.8% · R 64.9% · Other 1.4%
- 2008→2024 swing
- -29.7pp toward R · 2008: -1.4pp · 2024: -31.1pp
- All cycles
- 2024: R+31.1 2020: R+29.9 2016: R+32.1 2012: R+10.9 2008: R+1.4
Not yet ingested
- Civics
- —
Market trends
- HPI YoY
- ▼ -137.70%
- Current HPI
- 219.6018
- Rent YoY
- —
- Metro
- —
- State GDP YoY
- ▲ 1.37%
- F500 in state
- 28
Industry mix (Fortune 500 HQ in MI)
| Industry | F500 HQs | Revenue |
|---|---|---|
| Automotive Parts | 3 | $48B |
|
||
| Automotive | 2 | $372B |
|
||
| Chemicals | 1 | $45B |
|
||
| Automotive Retail | 1 | $29B |
|
||
| Healthcare / Medical Devices | 1 | $23B |
|
||
| Automotive Technology | 1 | $20B |
|
||
Price history
1 event — show timeline
- 2026-05-26 Listed $75,000 WWMLS
Cash-flow waterfall
monthlySold comps — $/sqft
last 12 mo · ≤1 miLoading sold comps…