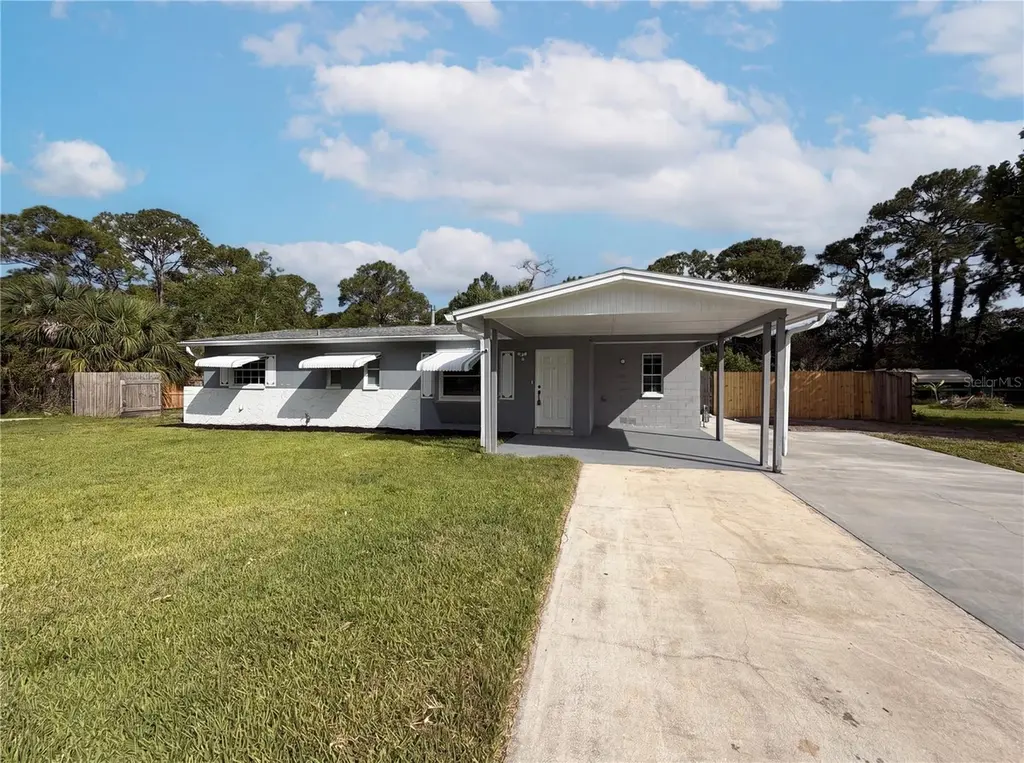
1057 Lakemoor Blvd · Rockledge, FL
Flood risk 1/10 · Minimal
- FEMA flood zone
- X (unshaded)
- Chance of flooding over 30 yrs
- 0.0%
- Est. flood insurance / yr
- $507 – $1,088
Fire risk 6/10 · Moderate
- Est. fire insurance / yr
- $947 – $1,759
Heat risk 10/10 · Severe
- Hot days now (above 106°F)
- 7 days/yr
- Hot days in 30 yrs
- 23 days/yr
Wind risk 10/10 · Severe
- Chance of severe wind over 30 yrs
- 99.0%
Air-quality risk 1/10 · Minimal
- Unhealthy air days now
- 0 days/yr
- Unhealthy air days in 30 yrs
- 0 days/yr
Risk factors via First Street. Map © Google.
Why this score? — see what drove the D grade
The composite is a weighted blend of 9 inputs, each scored 0–100. Each bar is that input's sub-score; the figure is the points it added to the 100-point composite (weight × sub-score).
- Cash flow +13.4/30.0
- ARV discount +7.5/15.0
- Schools +4.7/10.0
- DSCR +4.0/10.0
- Livability +4.0/5.0
- 1% rule +2.9/10.0
- Rent growth +2.5/5.0
- Condition / age +2.5/5.0
- Appreciation +0.0/10.0
$258,000
🖨 Deal sheet 📄 Offer letter ✓ Due diligence
Listing remarks MLS
Welcome to 1057 Lakemoor Blvd in Rockledge! This 3-bedroom, 2-bath home offers privacy, convenience, and outdoor living space with no HOA and no CDD fees. Tucked away at the end of a street, the property enjoys a peaceful setting with mature trees bordering the side and rear, creating a private backyard retreat. The fully fenced yard provides space for pets, play, gardening, or entertaining. Inside, you'll find a comfortable and functional floor plan. Step outside to the screened patio, perfect for morning coffee, gatherings, or relaxing while enjoying the tranquil surroundings. A covered carport provides convenient parking. Ideally located in the heart of Rockledge, you'll enjoy easy access to shopping, dining, schools, parks, and I-95. Whether you're a first-time homebuyer, downsizing, or looking for an investment opportunity, this property offers an exceptional combination of location, privacy, and value.
Key facts
- Covered carport
- No cdd fees
- No hoa
Tags
Property features AI
Finance
- Other: No CDD; Homestead not indicated; Zoning: RU111
- HOA & community: No association fees; No association approval required; Pets allowed
Exterior
- Parking: Covered parking; Driveway; 1-car carport
- Utilities: Public water; Public sewer; Broadband/high-speed internet available; Cable available
- Home design: Single family residence; Residential property; One story; Entry level: 1; Faces southeast; Property condition: Completed
- Construction: Block and concrete construction; Shingle roof; Slab foundation; Built on a 0.28-acre lot (wooded)
- Exterior features: Covered patio; Screened patio; Patio; Rain gutters; Wood fencing; Private lot; Street dead-end location; Paved roads
Interior
- Kitchen: Dishwasher; Microwave; Range; Refrigerator
- Bedrooms: 3 bedrooms
- Flooring: Carpet; Laminate
- Bathrooms: 2 full bathrooms
- Heating & cooling: Central heating (electric); Central air conditioning
- Interior features: Eat-in kitchen; Thermostat
- Laundry & utility: Washer hookup; Electric dryer hookup
Neighborhood map
What this means for you Summary
Snapshot
- This is a 3-bed/2.0-bath single-family listed at $258k.
Deal economics
- At list price, monthly cash flow is $3 ($33/yr) — positive.
- The deal already cash-flows at list — no discount required.
- To meet the 1% rule (rent ≥ 1% of price), the offer needs to be $203k (21.4% below list).
- Recommended offer: $203k (21.4% below list) — sets the bar for 1% rule.
Location & tenants
- Location reads 81/100 on livability (#81 in FL, #1,315 nationally) — a professional / high-income tenant draw. Strengths: housing A+, health & safety A, commute A-; Watch: amenities F.
- Brevard (suburban): math 53% / reading 57% proficiency, ranked #19 of 73 in FL (top 26%) — acceptable for families but not a draw, mixed tenant base, ~2y average lease.
- Zoned schools: Manatee Elementary School (math 85% / reading 84%, grade A+, #43 of 2,144 statewide, top 2%, 897 students, 19% FRL); Viera High School (math 58% / reading 71%, grade B-, #78 of 667 statewide, top 13%, 2,289 students, 15% FRL) — zoned schools average 17% FRL vs 43% district-wide (26 pts lower); this property's tenant base skews higher-income than the district average.
- Zoned-school proficiency averages 74% at this address vs 55% district-wide (+20 pts) — the actual schools serving this property are materially stronger than the Brevard average implies; a family-tenant draw the district grade alone would hide.
- Market conditions: Rents flat; 317 active listings in the ZIP; 11 comparable units currently listed for rent nearby; rentals at typical pace (median 14d on market — plan ~3-4 weeks tenant-placement turnaround); solid renter incomes; 4,602 units permitted in Brevard County in 2024 (702 in 5+ unit buildings).
Forward outlook
- Local home prices are declining (-3.0%/yr); year-one equity from $2k of loan paydown is wiped out by about $8k of value loss. Plan a longer hold.
- Brevard County population projected at +15% by 2050 — modest demand growth; plan on rents tracking national, not racing it.
Negotiation context
- It's been on market 17 days — a 2% lower offer ($254k) is reasonable based on typical stale-listing flexibility.
- 3 sale attempts since 22y ago with the ask held roughly flat each time — persistent listings suggest the price (not the market) is what's stuck; bring a comps-based counter.
- Current owner paid $207k; 25% above their basis — modest negotiation headroom, anchor on the comps not their cost.
Risks & watch-outs
- Climate carrying-cost: severe wind risk, 99% chance of damaging wind over 30y; major wildfire risk; extreme-heat days projected 7→23/yr by 2055 (HVAC capex compounding) — expect insurance premiums to compound above CPI over the hold.
Questions for the listing agent
- Built in 1970 — when were the roof, HVAC, electrical panel, plumbing, and water heater last replaced?
- Is there a deadline driving the sale (1031 exchange, divorce, estate, relocation)? That informs how much negotiation room exists.
- Schools are B-rated — typically a magnet for longer-tenancy family renters. What's the average tenant stay here, and is there a school-zone premium baked into asking?
- The area grade is low — what's the realistic commute time and amenity access for the typical tenant pool here? Any planned neighborhood developments (good or bad) we should know about?
- What's the average days-on-market for RENTAL listings here right now (not sales)? A rising rental-DOM trend means longer vacancies and softer asking-rent achievability than the comps imply.
- What's the recent tenant-quality profile in this submarket — average credit score on applications, eviction rate, late-payment / NSF rate, and stable-employment percentage? A property-management company in the area should have these aggregated.
- How much new for-sale + rental construction is in the pipeline within 1–3 miles? Heavy new supply typically softens prices + rents 12–24 months out; constrained supply supports both.
Investment metrics
- 1% rule
- 0.79% ✗
- Cap rate
- 6.31%
- Cash-on-cash
- 0.05%
- DSCR
- 1.00
- GRM
- 10.6
CMA / ARV
No comps found within radius.
Projected returns pro-forma
-3.0% appreciation · 0.12% rent growth · sell at horizon
- IRR
- -19.2%
- Equity multiple
- 0.34×
- Total profit
- $-47,424
- Equity at exit
- $38,469
- IRR
- -18.4%
- Equity multiple
- 0.12×
- Total profit
- $-63,523
- Equity at exit
- $22,307
Cash invested: $72,240 (down + closing). Projections, not guarantees.
Landlord ↔ Tenant lean methodology
- Overall (STATE)
- 87 Strongly Landlord-Friendly
- State Florida
- 87 Strongly Landlord-Friendly · R+3
- County
- — inherits STATE
- City
- — inherits STATE
ZIP-level market 32955
- Home prices YoY
- -20.7%
- Rents YoY
- 0.1%
- Active inventory
- 317
- Price-to-rent
- 10.6×
Monthly cashflow live
- Estimated rent
- $2,027 high interval (Pro) →
- Mortgage (P&I)
- −$1,353
- Tax from tax record
- −$138 /mo · $1,656/yr
- Insurance
- −$108
- HOA
- −$0
- Vacancy / Maint / Mgmt
- −$426
- Net cashflow
- $3
Break-even live
UW: 25.0% down · 7.5% · 30yr · 1.5% tax · 5.0% vac · 8.0% maint · 8.0% mgmt
Financing live
Cash to close
- Down payment
- $64,500
- Closing costs
- $7,740
- Reserves months
- —
- Total cash needed
- —
Loan-product check · same deal, 3 products live
Conventional
25% down · 7.5% · 30yr
- Down + closing
- —
- Monthly P&I
- —
- Monthly cashflow
- —
- DSCR
- —
- Eligible?
- —
Personal DTI + credit; lowest rate.
DSCR
20% down · 8.5% · 30yr
- Down + closing
- —
- Monthly P&I
- —
- Monthly cashflow
- —
- DSCR
- —
- Eligible?
- —
No personal income docs; deal must DSCR.
Hard money
10% down · 12.0% · 12mo
- Down + closing
- —
- Monthly P&I
- —
- Monthly cashflow
- —
- DSCR
- —
- Eligible?
- —
Short-term bridge; refi at stabilization.
Rent comps 11 comps
| Address | Beds | Baths | Sqft | Rent | $/sqft | DOM | Units | Dist |
|---|---|---|---|---|---|---|---|---|
| 3140 Southgate Dr Rockledge, FL | 2.0–3.0 | 2.0 | 1092 | $1,680 | $1.54 | 14d | 6 | 0.65mi |
| 1913 Woodhaven Cir Rockledge, FL | 2.0 | 2.0 | 930 | $1,597 | $1.72 | 13d | 3 | 0.73mi |
| 897 Levitt Pkwy Rockledge, FL | 3.0 | 2.0 | 1386 | $2,200 | $1.59 | 23d | 1 | 0.86mi |
| 1001 Cascade Cir Rockledge, FL | 2.0–3.0 | 2.0 | 1274 | $2,065 | $1.62 | 14d | 6 | 0.86mi |
| 412 Clarence Rowe Ave Rockledge, FL | 3.0 | 1.0 | 960 | $1,600 | $1.67 | 23d | 1 | 1.27mi |
| 1675 S Fiske Blvd #155 Rockledge, FL | 2.0 | 2.0 | 1170 | $1,750 | $1.50 | 13d | 1 | 1.29mi |
| 1515 Huntington Ln Rockledge, FL | 2.0 | 1.0–2.0 | 470 | $1,762 | $3.75 | 23d | 3 | 1.29mi |
| 1515 Huntington Ln Rockledge, FL | 2.0 | 1.0–2.0 | 470 | $1,725 | $3.67 | 14d | 4 | 1.29mi |
| 1600 Woodland Dr Unit 1 Rockledge, FL | 3.0 | 2.0 | 1426 | $1,995 | $1.40 | 14d | 1 | 1.29mi |
| 1880 Murrell Rd Unit Q63 Rockledge, FL | 2.0 | 1.5 | 1200 | $1,700 | $1.42 | 23d | 1 | 1.49mi |
| 1525 S Fiske Blvd Rockledge, FL | 1.0–2.0 | 1.0 | 890 | $1,500 | $1.69 | 23d | 1 | 1.50mi |
Listing history 12 events
-
2026-06-18days on market $258,000 Active 17 DOM
-
2026-06-17days on market $258,000 Active 16 DOM
-
2026-06-16days on market $258,000 Active 15 DOM
-
2026-06-15days on market $258,000 Active 14 DOM
-
2026-06-14days on market $258,000 Active 12 DOM
-
2026-06-10days on market $258,000 Active 9 DOM
-
2026-06-08days on market $258,000 Active 7 DOM
-
2026-06-07days on market $258,000 Active 6 DOM
-
2026-06-05days on market $258,000 Active 3 DOM
-
2026-06-03days on market $258,000 Active 2 DOM
-
2026-06-02remarks 699-char remark
-
2026-06-02$258,000 Active 1 DOM
ⓘ Source: listings_history table (triggers on properties + properties_extension) + one-shot
backfill from property_details.listing_events for pre-trigger history.
Tax reassessment forecast FL · Resets to sale price
- Current annual tax
- $1,656 · $138/mo
- Projected year-2 tax
- $2,141 · $178/mo
- Expected delta
- +$485/yr (+$40/mo · 29.3%)
ⓘ Screening estimate from a state-policy table — verify with the county assessor before closing.
Climate risk First Street
- Flood 1/10 Low FEMA zone X (unshaded) · 0% chance over 30 yrs
- Wildfire 6/10 Major
- Heat 10/10 Extreme 7 d/yr ≥106°F today · 23 d/yr by 30 yrs out
- Wind 10/10 Extreme 99% chance of damaging wind over 30 yrs
- Air quality 1/10 Low 0 unhealthy d/yr today · 0 by 30 yrs out
Nearby sold comps map
Loading sold comps map…
Walkable amenities ~0.75 mi
Loading nearby amenities…
Taxation est. · year 1
- Rental income
- $24,323
- − Mortgage interest
- −$14,452
- − Property taxes
- −$1,656
- − Insurance
- −$1,290
- − Repairs & maintenance
- −$1,946
- − Management
- −$1,946
- − Depreciation
- −$7,505
- Taxable loss
- −$4,473
- Est. tax savings @ 24.0%
- +$1,073
- After-tax cash flow
- $1,106/yr
For passive investors: Depreciation is non-cash, so a rental often shows a tax loss while cash-flowing — sheltering income. Rental losses are passive: they offset passive income freely, and up to $25,000/yr can offset ordinary (W-2) income if you actively participate and your MAGI is under $100k (phasing out to $0 by $150k); unused losses carry forward. On sale, claimed depreciation is recaptured at up to 25%, and gains may owe capital-gains tax (a 1031 exchange can defer both). Figures are a year-1 estimate at your 24.0% rate — not tax advice; consult a CPA.
Schools (NCES district)
- District
- Brevard
- NCES district ID
- 1200150
- Math proficiency
- 53% ▼ -9.00%
- Reading proficiency
- 57% ▼ -4.00%
- Median HH income
- $49,426
- Composite
- 46.86/100
- National rank
- #2370
- State rank
- #19 of 73 in FL
Livability — Rockledge
- Score
- 81/100
- State rank
- #81
- US rank
- #1315
Category grades
Schools grade is shown separately in the Schools card above.
Census & demographics
- County
- Brevard County · 602,871 people
- City population
- 41,008
- Metro
- Palm Bay-Melbourne-Titusville, FL
- Population (ZIP)
- 41,008
- Household income
- $86,457
- Rent vs Own
- Severe rent burden
- 1273.0
Population outlook (Brevard County) Hauer SSP2
- Today (2025)
- 623,254 people
- By 2030
- 648,420 · +4.0%
- By 2040
- 690,009 · +10.7%
- By 2050
- 715,669 · +14.8%
- By 2075
- 775,744 · +24.5%
- By 2100
- 776,687 · +24.6%
Race, ethnicity, and origin ACS 2023
- Neighborhood character
- Predominantly White (69%)
- Race & ethnicity
- White 69% Black 14% Hispanic / Latino 9% Two or more races 8% Asian 2%
- Hispanic origin (detail)
- Mexican 1% Puerto Rican 3%
- Common ancestry
- Slovak 3% Romanian 2% Serbian 2%
- Foreign-born
- 7% · Canada, Jamaica, Mexico
- Languages at home
- 91% English-only · Spanish 5% Other Indo-European 2%
Political lean MEDSL · Brevard
- 2024 margin
- Strong R (+20.8) · D 39.1% · R 59.9% · Other 1.0%
- 2008→2024 swing
- -10.4pp toward R · 2008: -10.4pp · 2024: -20.8pp
- All cycles
- 2024: R+20.8 2020: R+16.4 2016: R+19.8 2012: R+12.7 2008: R+10.4
Not yet ingested
- Civics
- —
Market trends
- HPI YoY
- ▼ -81.70%
- Current HPI
- 312.7435
- Rent YoY
- ▲ 0.12%
- Metro
- Palm Bay-Melbourne-Titusville, FL
- State GDP YoY
- ▲ 3.28%
- F500 in state
- 36
Industry mix (Fortune 500 HQ in FL)
| Industry | F500 HQs | Revenue |
|---|---|---|
| Industrial Technology | 2 | $29B |
|
||
| Insurance | 2 | $17B |
|
||
| Retail | 1 | $60B |
|
||
| Technology Distribution | 1 | $58B |
|
||
| Homebuilding | 1 | $35B |
|
||
| Technology Manufacturing | 1 | $35B |
|
||
Price history
+54.5% since first listed9 events — show timeline
- 2026-06-01 Listed $258,000 SCMLS
- 2026-06-01 Listed $258,000 Stellar MLS as Distributed by MLS Grid
- 2026-05-12 Sold (Public Records) $206,800 Public Records
- 2016-08-26 Sold (Public Records) $110,500 Public Records
- 2004-10-18 Sold (Public Records) $115,000 Public Records
- 2004-10-15 Sold (MLS) $115,000 SCMLS
- 2004-08-28 Listed $119,900 SCMLS
- 1979-06-01 Sold (Public Records) $33,900 Public Records
- 1972-03-01 Sold (Public Records) $167,000 Public Records
Property tax history
+2.2%/yrLatest (2025): $1,656 · +8.6% YoY. Source: county tax records.
Cash-flow waterfall
monthlySold comps — $/sqft
last 12 mo · ≤1 miLoading sold comps…