514 W 4th St · Mount Carmel, PA
Flood risk 5/10 · Moderate
- FEMA flood zone
- X (unshaded)
- Chance of flooding over 30 yrs
- 0.65%
- Est. flood insurance / yr
- $473 – $860
Fire risk 3/10 · Minor
- Est. fire insurance / yr
- $511 – $949
Heat risk 4/10 · Minor
- Hot days now (above 93°F)
- 8 days/yr
- Hot days in 30 yrs
- 17 days/yr
Wind risk 3/10 · Minor
- Chance of severe wind over 30 yrs
- 5.0%
Air-quality risk 2/10 · Minimal
- Unhealthy air days now
- 1 days/yr
- Unhealthy air days in 30 yrs
- 2 days/yr
Risk factors via First Street. Map © Google.
Why this score? — see what drove the B grade
The composite is a weighted blend of 9 inputs, each scored 0–100. Each bar is that input's sub-score; the figure is the points it added to the 100-point composite (weight × sub-score).
- Cash flow +28.9/30.0
- DSCR +10.0/10.0
- Appreciation +8.2/10.0
- 1% rule +7.7/10.0
- ARV discount +7.5/15.0
- Livability +3.6/5.0
- Rent growth +2.5/5.0
- Condition / age +2.5/5.0
- Schools +2.3/10.0
$99,000
🖨 Deal sheet 📄 Offer letter ✓ Due diligence
Listing remarks
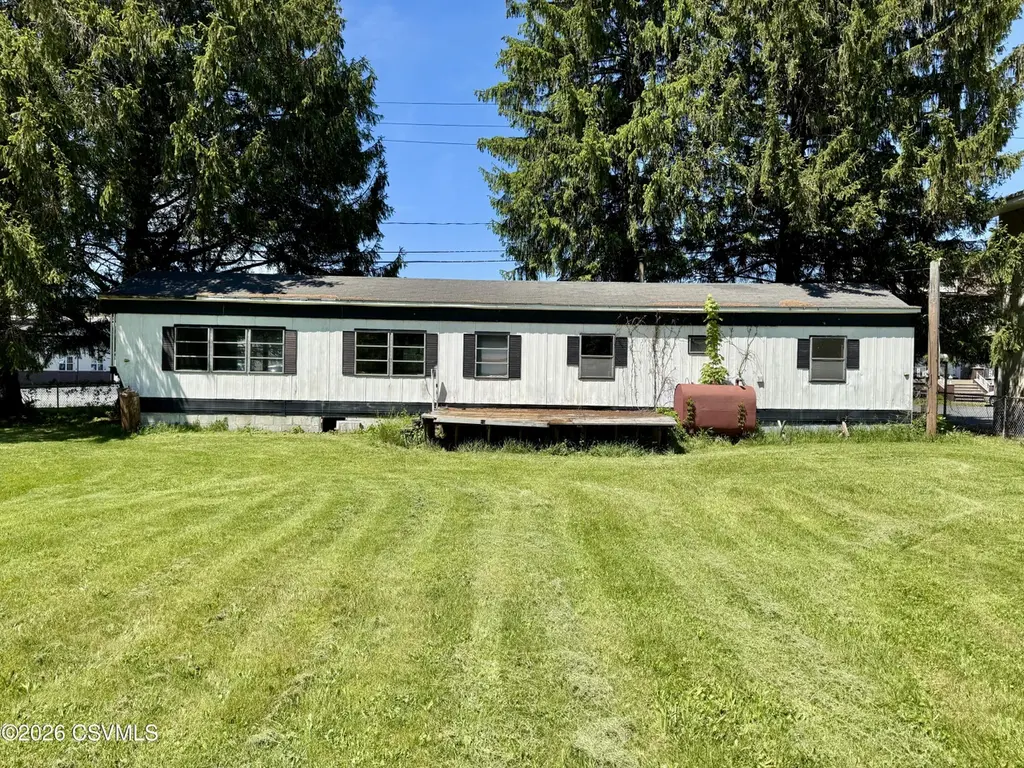
Tucked beneath mature shade trees and nestled along a whispering creek, this charming in-town retreat offers a rare blend of nature and convenience on a . 38AC lot! Just a short stroll from Boyer's, downtown and the football field. Set on a beautiful grassy lot, the 1966 mobile home features a cozy living room, dining area, kitchen, two private bedrooms, and a full bath. Sunlight pours through the many windows, creating a warm and cheerful atmosphere while overlooking the spacious fenced-in backyard. A storage shed adds extra room for tools, treasures, or hobbies.
Key facts
- Whispering creek
- Storage shed
- Mature shade trees
Tags
Property features AI
Exterior
- Parking: No designated parking
- Utilities: Public water; Public sewer; Electric with circuit breakers
- Home design: Residential mobile home; Single-story (mobile home)
- Construction: Aluminum siding; Shingle roof; No foundation details listed; Built area above grade: 936
- Exterior features: Deck; Stream on the property; Shed(s)
Interior
- Kitchen: Includes refrigerator
- Bedrooms: 2 bedrooms on the main level
- Bathrooms: 1 full bathroom
- Heating & cooling: Has heating
- Interior features: Refrigerator; No basement
Neighborhood map
What this means for you Summary
Snapshot
- This is a 2-bed/1.0-bath other listed at $99k.
Deal economics
- At list price, monthly cash flow is $337 ($4k/yr) — positive.
- The deal already cash-flows at list — no discount required.
- Meets the 1% rule at list price ($1k rent vs $99k).
- Recommended offer: $96k (3.0% below list) — sets the bar for market timing.
Location & tenants
- Location reads 72/100 on livability (#641 in PA) — a middle-class / working-renter tenant base. Strengths: cost of living A+, health & safety A+, crime B+; Watch: schools D+, commute F, employment F.
- Mount Carmel Area SD (town): math 20% / reading 37% proficiency, ranked #455 of 539 in PA (top 84%) — low school quality limits family demand, transient renter base, plan for 1-2y turnover.
- Market conditions: 54 active listings in the ZIP; 3 comparable units currently listed for rent nearby; rentals lingering (median 44d on market — plan ~5-8 weeks vacancy on turnover, expect pricing pressure); 100% of comp listings sitting > 30 days — soft ceiling on asking rent; 81 units permitted in Northumberland County in 2024 (0 in 5+ unit buildings).
Forward outlook
- In year one you build about $7k of equity ($684 loan paydown + $6k appreciation (6.3% local appreciation)).
- Northumberland County population projected at -11% by 2050 — secular population decline; favor cash flow + early exit over multi-decade hold.
- At projected returns (6.3% appreciation + 3.0% rent growth), your $28k cash investment doubles in ~3 years — after that, you're playing with house money.
- By year 5, paydown + projected appreciation supports a ~$31k cash-out refi (75% LTV) — recoverable capital for the next deal without selling this one.
Negotiation context
- It's been on market 37 days — a 3% lower offer ($96k) is reasonable based on typical stale-listing flexibility.
Risks & watch-outs
- Climate carrying-cost: moderate flood risk — expect insurance premiums to compound above CPI over the hold.
Questions for the listing agent
- It's been on market 37 days. Have you received any prior offers? Is the seller open to a 3% concession, seller financing, or rate buy-down credit?
- Built in 1966 — when were the roof, HVAC, electrical panel, plumbing, and water heater last replaced?
- Is there a deadline driving the sale (1031 exchange, divorce, estate, relocation)? That informs how much negotiation room exists.
- Schools are D-rated, which usually means shorter tenancies and higher turnover. Who's the typical renter profile here, and what's been the actual vacancy rate?
- What's the average days-on-market for RENTAL listings here right now (not sales)? A rising rental-DOM trend means longer vacancies and softer asking-rent achievability than the comps imply.
- What's the recent tenant-quality profile in this submarket — average credit score on applications, eviction rate, late-payment / NSF rate, and stable-employment percentage? A property-management company in the area should have these aggregated.
- How much new for-sale + rental construction is in the pipeline within 1–3 miles? Heavy new supply typically softens prices + rents 12–24 months out; constrained supply supports both.
Investment metrics
- 1% rule
- 1.27% ✓
- Cap rate
- 10.37%
- Cash-on-cash
- 14.57%
- DSCR
- 1.65
- GRM
- 6.5
CMA / ARV
No comps found within radius.
Projected returns pro-forma
6.31% appreciation · 3.0% rent growth · sell at horizon
- IRR
- 28.1%
- Equity multiple
- 2.87×
- Total profit
- $51,868
- Equity at exit
- $64,196
- IRR
- 26.1%
- Equity multiple
- 5.88×
- Total profit
- $135,334
- Equity at exit
- $118,147
Cash invested: $27,720 (down + closing). Projections, not guarantees.
Landlord ↔ Tenant lean methodology
- Overall (STATE)
- 62 Landlord-Friendly
- State Pennsylvania
- 62 Landlord-Friendly · EVEN
- County
- — inherits STATE
- City
- — inherits STATE
ZIP-level market 17851
- Home prices YoY
- 5.2%
- Active inventory
- 54
- Price-to-rent
- 6.5×
Monthly cashflow live
- Estimated rent
- $1,261 medium interval (Pro) →
- Mortgage (P&I)
- −$519
- Tax from tax record
- −$100 /mo · $1,195/yr
- Insurance
- −$41
- HOA
- −$0
- Vacancy / Maint / Mgmt
- −$265
- Net cashflow
- $337
Break-even live
UW: 25.0% down · 7.5% · 30yr · 1.5% tax · 5.0% vac · 8.0% maint · 8.0% mgmt
Financing live
Cash to close
- Down payment
- $24,750
- Closing costs
- $2,970
- Reserves months
- —
- Total cash needed
- —
Loan-product check · same deal, 3 products live
Conventional
25% down · 7.5% · 30yr
- Down + closing
- —
- Monthly P&I
- —
- Monthly cashflow
- —
- DSCR
- —
- Eligible?
- —
Personal DTI + credit; lowest rate.
DSCR
20% down · 8.5% · 30yr
- Down + closing
- —
- Monthly P&I
- —
- Monthly cashflow
- —
- DSCR
- —
- Eligible?
- —
No personal income docs; deal must DSCR.
Hard money
10% down · 12.0% · 12mo
- Down + closing
- —
- Monthly P&I
- —
- Monthly cashflow
- —
- DSCR
- —
- Eligible?
- —
Short-term bridge; refi at stabilization.
Rent comps 3 comps
| Address | Beds | Baths | Sqft | Rent | $/sqft | DOM | Units | Dist |
|---|---|---|---|---|---|---|---|---|
| 414 W 4th St Mount Carmel, PA | 3.0 | 1.5 | 900 | $1,450 | $1.61 | 43d | 1 | 0.07mi |
| 137 W 4th St Unit 100 Mt Carmel, PA | 1.0 | 1.0 | 1000 | $850 | $0.85 | 43d | 1 | 0.27mi |
| 410 East Ave Mt Carmel, PA | 1.0 | 1.0 | 640 | $795 | $1.24 | 43d | 1 | 0.77mi |
Listing history 15 events
-
2026-06-18days on market $99,000 Active 37 DOM
-
2026-06-17days on market $99,000 Active 36 DOM
-
2026-06-16days on market $99,000 Active 35 DOM
-
2026-06-15days on market $99,000 Active 34 DOM
-
2026-06-13days on market $99,000 Active 32 DOM
-
2026-06-12days on market $99,000 Active 31 DOM
-
2026-06-09pricedays on market $99,000 Active 28 DOM
-
2026-06-08days on market $109,000 Active 27 DOM
-
2026-06-08days on market $109,000 Active 26 DOM
-
2026-06-07days on market $109,000 Active 25 DOM
-
2026-06-04days on market $109,000 Active 22 DOM
-
2026-06-02days on market $109,000 Active 21 DOM
-
2026-06-01days on market $109,000 Active 20 DOM
-
2026-05-31days on market $109,000 Active 19 DOM
-
2026-05-11$109,000 Active 570-char remark
ⓘ Source: listings_history table (triggers on properties + properties_extension) + one-shot
backfill from property_details.listing_events for pre-trigger history.
Tax reassessment forecast PA · Partial reset (capped growth)
- Current annual tax
- $1,195 · $100/mo
- Projected year-2 tax
- $1,379 · $115/mo
- Expected delta
- +$185/yr (+$15/mo · 15.5%)
ⓘ Screening estimate from a state-policy table — verify with the county assessor before closing.
Climate risk First Street
- Flood 5/10 Major FEMA zone X (unshaded) · 65% chance over 30 yrs
- Wildfire 3/10 Moderate
- Heat 4/10 Moderate 8 d/yr ≥93°F today · 17 d/yr by 30 yrs out
- Wind 3/10 Moderate 5% chance of damaging wind over 30 yrs
- Air quality 2/10 Low 1 unhealthy d/yr today · 2 by 30 yrs out
Nearby sold comps map
Loading sold comps map…
Walkable amenities ~0.75 mi
Loading nearby amenities…
Taxation est. · year 1
- Rental income
- $15,137
- − Mortgage interest
- −$5,546
- − Property taxes
- −$1,195
- − Insurance
- −$495
- − Repairs & maintenance
- −$1,211
- − Management
- −$1,211
- − Depreciation
- −$2,880
- Taxable income
- $2,600
- Est. tax owed @ 24.0%
- −$624
- After-tax cash flow
- $3,415/yr
For passive investors: Depreciation is non-cash, so a rental often shows a tax loss while cash-flowing — sheltering income. Rental losses are passive: they offset passive income freely, and up to $25,000/yr can offset ordinary (W-2) income if you actively participate and your MAGI is under $100k (phasing out to $0 by $150k); unused losses carry forward. On sale, claimed depreciation is recaptured at up to 25%, and gains may owe capital-gains tax (a 1031 exchange can defer both). Figures are a year-1 estimate at your 24.0% rate — not tax advice; consult a CPA.
Schools (NCES district)
- District
- Mount Carmel Area SD
- NCES district ID
- 4215990
- Math proficiency
- 20% ▼ -18.00%
- Reading proficiency
- 37% ▼ -15.00%
- Median HH income
- $35,195
- Composite
- 23.48/100
- National rank
- #7876
- State rank
- #455 of 539 in PA
Livability — Mount Carmel
- Score
- 72/100
- State rank
- #641
- US rank
- #6230
Category grades
Schools grade is shown separately in the Schools card above.
Census & demographics
- Census place
- Mount Carmel, PA
- Population (ZIP)
- 7,174
Population outlook (Northumberland County) Hauer SSP2
- Today (2025)
- 90,896 people
- By 2030
- 89,084 · -2.0%
- By 2040
- 84,822 · -6.7%
- By 2050
- 80,521 · -11.4%
- By 2075
- 72,152 · -20.6%
- By 2100
- 62,257 · -31.5%
Race, ethnicity, and origin ACS 2023
- Neighborhood character
- Predominantly White (92%)
- Race & ethnicity
- White 92% Two or more races 5% Hispanic / Latino 4% Black 1%
- Common ancestry
- Romanian 21% Subsaharan African 3% Iranian 2%
- Foreign-born
- 2% · Canada
- Languages at home
- 96% English-only · Spanish 3% Russian/Polish/Slavic 1%
Political lean MEDSL · Northumberland
- 2024 margin
- Solid R (+39.9) · D 29.6% · R 69.5%
- 2008→2024 swing
- -26.1pp toward R · 2008: -13.8pp · 2024: -39.9pp
- All cycles
- 2024: R+39.9 2020: R+38.5 2016: R+43.6 2012: R+19.4 2008: R+13.8
Not yet ingested
- Civics
- —
Market trends
- HPI YoY
- ▲ 6.31%
- Current HPI
- 127.4102
- Rent YoY
- —
- Metro
- —
- State GDP YoY
- ▲ 1.68%
- F500 in state
- 34
Industry mix (Fortune 500 HQ in PA)
| Industry | F500 HQs | Revenue |
|---|---|---|
| Healthcare | 2 | $309B |
|
||
| Insurance | 2 | $27B |
|
||
| Telecommunications / Media | 1 | $124B |
|
||
| Industrial Distribution | 1 | $22B |
|
||
| Financial Services | 1 | $20B |
|
||
| Chemicals / Materials | 1 | $18B |
|
||
Price history
-9.2% since first listed2 events — show timeline
- 2026-06-09 Price Changed $99,000 CSVBR
- 2026-05-11 Listed $109,000 CSVBR
Property tax history
+2.6%/yrLatest (2026): $1,195 · +1.5% YoY. Source: county tax records.
Cash-flow waterfall
monthlySold comps — $/sqft
last 12 mo · ≤1 miLoading sold comps…