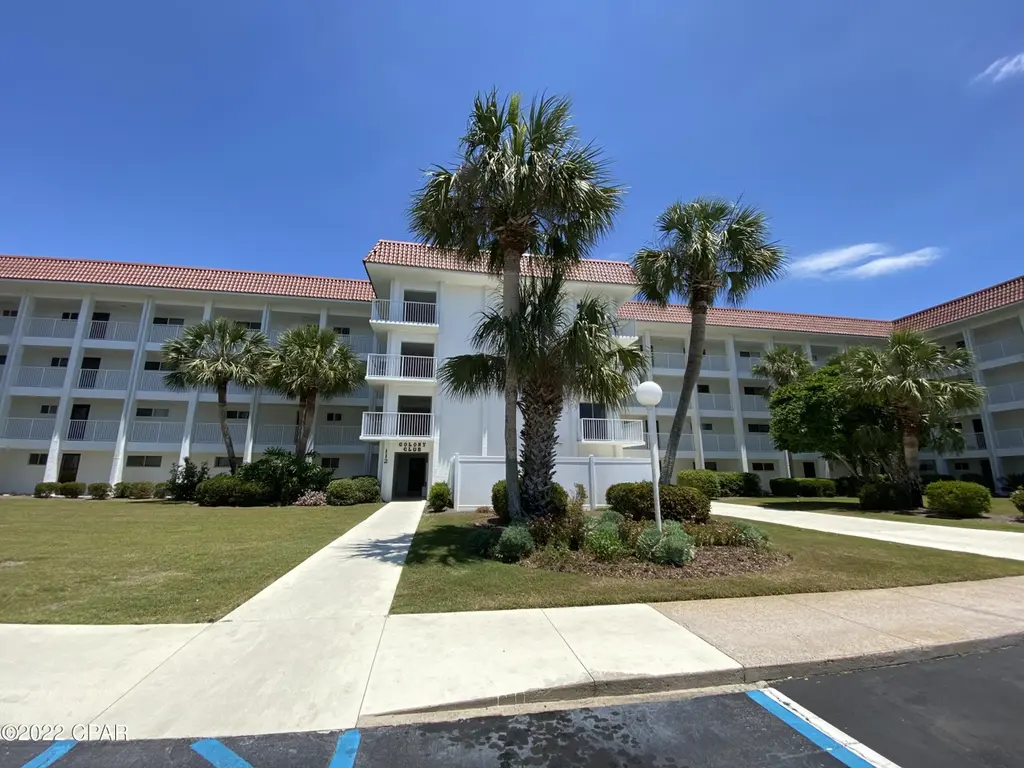
112 Fairway Blvd #105 · Panama City Beach, FL
Flood risk 1/10 · Minimal
- FEMA flood zone
- X (unshaded)
- Chance of flooding over 30 yrs
- 0.0%
- Est. flood insurance / yr
- $507 – $1,088
Fire risk 5/10 · Moderate
- Est. fire insurance / yr
- $947 – $1,759
Heat risk 10/10 · Severe
- Hot days now (above 105°F)
- 7 days/yr
- Hot days in 30 yrs
- 21 days/yr
Wind risk 10/10 · Severe
- Chance of severe wind over 30 yrs
- 99.0%
Air-quality risk 1/10 · Minimal
- Unhealthy air days now
- 0 days/yr
- Unhealthy air days in 30 yrs
- 0 days/yr
Risk factors via First Street. Map © Google.
Why this score? — see what drove the F grade
The composite is a weighted blend of 9 inputs, each scored 0–100. Each bar is that input's sub-score; the figure is the points it added to the 100-point composite (weight × sub-score).
- ARV discount +12.9/15.0
- Cash flow +4.9/30.0
- Schools +4.3/10.0
- Livability +3.9/5.0
- 1% rule +3.4/10.0
- Condition / age +2.5/5.0
- Rent growth +2.4/5.0
- DSCR +0.0/10.0
- Appreciation +0.0/10.0
$184,900
🖨 Deal sheet 📄 Offer letter ✓ Due diligence
Listing remarks MLS
Live where golf course views and coastal convenience come together. This ground-floor condo offers easy walkout access to a lush green lawn and a spacious, versatile layout that can function as two bedrooms or a one-bedroom plus office or den. The oversized enclosed patio extends your living space and provides the perfect spot to relax. Residents enjoy access to a community pool, clubhouse, and golf course just steps away - all only minutes from the beach. No pets or short-term rentals allowed. Don't miss this opportunity.
Key facts
- Easy walkout access
- Community pool
- Ground-floor condo
Tags
Neighborhood map
What this means for you Summary
Snapshot
- This is a 1-bed/1.0-bath condo listed at $185k.
Deal economics
- At list price, monthly cash flow is $-440 ($-5k/yr) — negative.
- The deal already cash-flows at list — no discount required.
- To meet the 1% rule (rent ≥ 1% of price), the offer needs to be $155k (16.3% below list).
- Recommended offer: $155k (16.3% below list) — sets the bar for 1% rule.
- Cap rate 3.4% vs local median 2.6% in Panama City Beach — top-decile yield for the area; either an underpriced asset or a hidden risk that comps aren't pricing in. Stress-test before assuming the spread holds.
Location & tenants
- Location reads 78/100 on livability (#172 in FL, #2,624 nationally) — a middle-class / working-renter tenant base. Strengths: crime A+, housing A+, health & safety A+; Watch: amenities D-, commute F.
- Bay (suburban): math 51% / reading 51% proficiency, ranked #29 of 73 in FL (top 40%) — acceptable for families but not a draw, mixed tenant base, ~2y average lease.
- Market conditions: Rents soft (-0.2%/yr); 702 active listings in the ZIP; 9 comparable units currently listed for rent nearby; rentals at typical pace (median 21d on market — plan ~3-4 weeks tenant-placement turnaround); solid renter incomes; 2,473 units permitted in Bay County in 2024 (559 in 5+ unit buildings).
Forward outlook
- Local home prices are declining (-3.0%/yr); year-one equity from $1k of loan paydown is wiped out by about $6k of value loss. Plan a longer hold.
- Bay County population projected at +24% by 2050 — long-run rental-demand tailwind backs the buy-and-hold thesis.
Negotiation context
- It's been on market 180 days — a 12% lower offer ($163k) is reasonable based on typical stale-listing flexibility.
- 11 sale attempts since 21y ago with the ask held roughly flat each time — persistent listings suggest the price (not the market) is what's stuck; bring a comps-based counter.
- Current owner paid $160k; 16% above their basis — modest negotiation headroom, anchor on the comps not their cost.
Risks & watch-outs
- Watch-outs: HOA is 29% of rent.
- Climate carrying-cost: severe wind risk, 99% chance of damaging wind over 30y; moderate wildfire risk; extreme-heat days projected 7→21/yr by 2055 (HVAC capex compounding) — expect insurance premiums to compound above CPI over the hold.
Questions for the listing agent
- What do current leases actually rent for vs. the listed asking? Can we see a recent rent roll and the last 12 months of T-12 income?
- It's been on market 180 days. Have you received any prior offers? Is the seller open to a 16% concession, seller financing, or rate buy-down credit?
- Built in 1972 — when were the roof, HVAC, electrical panel, plumbing, and water heater last replaced?
- What does the HOA fee cover, when was the last increase, and are there any pending special assessments or reserve-fund shortfalls?
- Any open or pending special assessments — roof, HVAC, plumbing, elevator, façade? What's the per-unit balance and payoff schedule, and is the seller paying it off at close or rolling it to the buyer?
- Why hasn't it sold? Are there any deal-killer items the seller is aware of (foundation, flood, title, zoning, code violations)?
- Is there a deadline driving the sale (1031 exchange, divorce, estate, relocation)? That informs how much negotiation room exists.
- Schools are B-rated — typically a magnet for longer-tenancy family renters. What's the average tenant stay here, and is there a school-zone premium baked into asking?
- The area grade is low — what's the realistic commute time and amenity access for the typical tenant pool here? Any planned neighborhood developments (good or bad) we should know about?
- What's the average days-on-market for RENTAL listings here right now (not sales)? A rising rental-DOM trend means longer vacancies and softer asking-rent achievability than the comps imply.
- What's the recent tenant-quality profile in this submarket — average credit score on applications, eviction rate, late-payment / NSF rate, and stable-employment percentage? A property-management company in the area should have these aggregated.
- How much new apartment / multifamily construction is in the pipeline within 1–3 miles? Heavy new supply (>2% of stock underway) typically softens rents 12–24 months out; light construction supports rent growth.
Investment metrics
- 1% rule
- 0.84% ✗
- Cap rate
- 3.44%
- Cash-on-cash
- -10.20%
- DSCR
- 0.55
- GRM
- 10.0
CMA / ARV
- ARV (median comp)
- $209,901
- List price
- $184,900
- Delta
- -11.91%
- Verdict
- UNDERPRICED
- Comps
- 20 within 1.0 mi
Projected returns pro-forma
-3.0% appreciation · 0.0% rent growth · sell at horizon
- IRR
- -39.3%
- Equity multiple
- -0.20×
- Total profit
- $-62,258
- Equity at exit
- $27,569
- IRR
- -93.9%
- Equity multiple
- -1.06×
- Total profit
- $-106,763
- Equity at exit
- $15,987
Cash invested: $51,772 (down + closing). Projections, not guarantees.
Landlord ↔ Tenant lean methodology
- Overall (STATE)
- 87 Strongly Landlord-Friendly
- State Florida
- 87 Strongly Landlord-Friendly · R+3
- County
- — inherits STATE
- City
- — inherits STATE
ZIP-level market 32407
- Home prices YoY
- -29.5%
- Rents YoY
- -0.2%
- Active inventory
- 702
- Price-to-rent
- 10.0×
Monthly cashflow live
- Estimated rent
- $1,547 high interval (Pro) →
- Mortgage (P&I)
- −$970
- Tax from tax record
- −$170 /mo · $2,045/yr
- Insurance
- −$77
- HOA est. from 3 same-building comps
- −$445
- Vacancy / Maint / Mgmt
- −$325
- Net cashflow
- $-440
Break-even live
UW: 25.0% down · 7.5% · 30yr · 1.5% tax · 5.0% vac · 8.0% maint · 8.0% mgmt
Financing live
Cash to close
- Down payment
- $46,225
- Closing costs
- $5,547
- Reserves months
- —
- Total cash needed
- —
Loan-product check · same deal, 3 products live
Conventional
25% down · 7.5% · 30yr
- Down + closing
- —
- Monthly P&I
- —
- Monthly cashflow
- —
- DSCR
- —
- Eligible?
- —
Personal DTI + credit; lowest rate.
DSCR
20% down · 8.5% · 30yr
- Down + closing
- —
- Monthly P&I
- —
- Monthly cashflow
- —
- DSCR
- —
- Eligible?
- —
No personal income docs; deal must DSCR.
Hard money
10% down · 12.0% · 12mo
- Down + closing
- —
- Monthly P&I
- —
- Monthly cashflow
- —
- DSCR
- —
- Eligible?
- —
Short-term bridge; refi at stabilization.
Rent comps 9 comps
| Address | Beds | Baths | Sqft | Rent | $/sqft | DOM | Units | Dist |
|---|---|---|---|---|---|---|---|---|
| 509 Lighthouse Rd Panama City Beach, FL | 2.0 | 2.0 | 965 | $1,500 | $1.55 | 21d | 1 | 0.26mi |
| 900 Clara Ave Panama City Beach, FL | 1.0–3.0 | 1.0–2.0 | 1134 | $1,425 | $1.26 | 13d | 15 | 0.43mi |
| 1105 Clara Ave Panama City Beach, FL | 3.0 | 1.0–2.0 | 938 | $1,626 | $1.73 | 13d | 14 | 0.44mi |
| 505 Anemone St Unit 1511627P Panama City Beach, FL | 2.0 | 2.0 | 990 | $3,929 | $3.97 | 21d | 1 | 0.64mi |
| 15817 Front Beach Rd Unit 1523369P Panama City Beach, FL | 1.0 | 2.0 | 839 | $5,602 | $6.68 | 13d | 1 | 0.68mi |
| 231 Poinsettia Dr Unit A Panama City Beach, FL | 2.0 | 2.0 | 840 | $1,500 | $1.79 | 21d | 1 | 0.74mi |
| 14701 Front Beach Rd Unit 1523326P Panama City Beach, FL | 2.0 | 2.0 | 1302 | $3,263 | $2.51 | 21d | 1 | 1.03mi |
| 302 Cabana Blvd Panama City Beach, FL | 1.0–3.0 | 1.0–2.0 | 1184 | $1,293 | $1.09 | 13d | 15 | 1.22mi |
| 201 Hills Rd Panama City Beach, FL | 1.0–2.0 | 1.0–2.0 | 994 | $1,550 | $1.56 | 21d | 20 | 1.29mi |
HOA detail condo
- Monthly dues
- $0 · $0/yr
- Likely covers
- pool
- Assessments
- None detected in remarks — confirm with the listing agent.
Listing history 50 events
-
2026-06-19days on market $184,900 Active 180 DOM
-
2026-06-18days on market $184,900 Active 179 DOM
-
2026-06-17days on market $184,900 Active 178 DOM
-
2026-06-16days on market $184,900 Active 177 DOM
-
2026-06-15days on market $184,900 Active 176 DOM
-
2026-06-14days on market $184,900 Active 174 DOM
-
2026-06-13days on market $184,900 Active 173 DOM
-
2026-06-10days on market $184,900 Active 171 DOM
-
2026-06-09days on market $184,900 Active 170 DOM
-
2026-06-08days on market $184,900 Active 169 DOM
-
2026-06-07days on market $184,900 Active 168 DOM
-
2026-06-05days on market $184,900 Active 165 DOM
-
2026-06-03days on market $184,900 Active 164 DOM
-
2026-06-02days on market $184,900 Active 163 DOM
-
2026-06-01days on market $184,900 Active 162 DOM
-
2026-05-31days on market $184,900 Active 161 DOM
-
2026-05-30days on market $184,900 Active 160 DOM
-
2026-01-03historical $1,500
-
2025-12-21$184,900 Active 528-char remark
Show marketing remark (528 chars)
Live where golf course views and coastal convenience come together. This ground-floor condo offers easy walkout access to a lush green lawn and a spacious, versatile layout that can function as two bedrooms or a one-bedroom plus office or den. The oversized enclosed patio extends your living space and provides the perfect spot to relax. Residents enjoy access to a community pool, clubhouse, and golf course just steps away - all only minutes from the beach. No pets or short-term rentals allowed. Don't miss this opportunity.
-
2025-08-19$1,500
-
2024-01-21historical $1,700
-
2023-10-20$1,700
-
2022-10-11historical
-
2022-10-11historical
-
2022-10-11historical
-
2022-10-02price $199,900
-
2022-10-02price $199,900
-
2022-10-02price $199,900
-
2022-09-13price $207,900
-
2022-09-13price $207,900
-
2022-09-13price $207,900
-
2022-08-31price $208,900
-
2022-08-31price $208,900
-
2022-08-31price $208,900
-
2022-08-17$229,900 Active
-
2022-08-17$229,900 Active
-
2022-08-12$229,900 Active
-
2022-01-24soldstatus $160,000
-
2022-01-20soldstatus $160,000
-
2021-10-27$165,000
-
2020-08-10historical
-
2019-03-29$159,000
-
2016-03-25historical
-
2016-01-21$126,000
-
2012-09-24soldstatus $40,500
-
2012-09-19soldstatus $40,500
-
2011-12-12$49,900
-
2005-09-21soldstatus $103,100
-
2005-07-06soldstatus $229,000
-
2005-07-01soldstatus $229,000
ⓘ Source: listings_history table (triggers on properties + properties_extension) + one-shot
backfill from property_details.listing_events for pre-trigger history.
Tax reassessment forecast FL · Resets to sale price
- Current annual tax
- $2,045 · $170/mo
- Projected year-2 tax
- $2,045 · $170/mo
- Expected delta
- $0/yr ($0/mo · 0.0%)
ⓘ Screening estimate from a state-policy table — verify with the county assessor before closing.
Climate risk First Street
- Flood 1/10 Low FEMA zone X (unshaded) · 0% chance over 30 yrs
- Wildfire 5/10 Major
- Heat 10/10 Extreme 7 d/yr ≥105°F today · 21 d/yr by 30 yrs out
- Wind 10/10 Extreme 99% chance of damaging wind over 30 yrs
- Air quality 1/10 Low 0 unhealthy d/yr today · 0 by 30 yrs out
Nearby sold comps map
Loading sold comps map…
Walkable amenities ~0.75 mi
Loading nearby amenities…
Taxation est. · year 1
- Rental income
- $18,563
- − Mortgage interest
- −$10,357
- − Property taxes
- −$2,045
- − Insurance
- −$924
- − Repairs & maintenance
- −$1,485
- − Management
- −$1,485
- − HOA
- −$5,340
- − Depreciation
- −$5,379
- Taxable loss
- −$8,452
- Est. tax savings @ 24.0%
- +$2,029
- After-tax cash flow
- $-3,251/yr
For passive investors: Depreciation is non-cash, so a rental often shows a tax loss while cash-flowing — sheltering income. Rental losses are passive: they offset passive income freely, and up to $25,000/yr can offset ordinary (W-2) income if you actively participate and your MAGI is under $100k (phasing out to $0 by $150k); unused losses carry forward. On sale, claimed depreciation is recaptured at up to 25%, and gains may owe capital-gains tax (a 1031 exchange can defer both). Figures are a year-1 estimate at your 24.0% rate — not tax advice; consult a CPA.
Schools (NCES district)
- District
- Bay
- NCES district ID
- 1200090
- Math proficiency
- 51% ▼ -8.00%
- Reading proficiency
- 51% ▼ -7.00%
- Median HH income
- $47,740
- Composite
- 43.41/100
- National rank
- #3014
- State rank
- #29 of 73 in FL
Livability — Panama City Beach
- Score
- 78/100
- State rank
- #172
- US rank
- #2624
Category grades
Schools grade is shown separately in the Schools card above.
Census & demographics
- Census place
- Panama City Beach, FL
- County
- Bay County · 163,593 people
- City population
- 50,689
- Metro
- Panama City, FL
- Population (ZIP)
- 16,404
- Household income
- $80,831
- Rent vs Own
- Severe rent burden
- 939.0
Population outlook (Bay County) Hauer SSP2
- Today (2025)
- 206,264 people
- By 2030
- 217,740 · +5.6%
- By 2040
- 238,738 · +15.7%
- By 2050
- 255,545 · +23.9%
- By 2075
- 288,295 · +39.8%
- By 2100
- 288,638 · +39.9%
Race, ethnicity, and origin ACS 2023
- Neighborhood character
- Predominantly White (73%)
- Race & ethnicity
- White 73% Black 10% Two or more races 9% Hispanic / Latino 8% Asian 2%
- Hispanic origin (detail)
- Mexican 2% Puerto Rican 2%
- Common ancestry
- Lithuanian 4% Italian 3% Portuguese 2%
- Foreign-born
- 12% · Canada, Jamaica, South Korea
- Languages at home
- 89% English-only · Spanish 6% Other Indo-European 1% Russian/Polish/Slavic 1%
Political lean MEDSL · Bay
- 2024 margin
- Solid R (+47.4) · D 25.8% · R 73.1% · Other 1.1%
- 2008→2024 swing
- -6.6pp toward R · 2008: -40.7pp · 2024: -47.4pp
- All cycles
- 2024: R+47.4 2020: R+43.5 2016: R+46.3 2012: R+43.6 2008: R+40.7
Not yet ingested
- Civics
- —
Market trends
- HPI YoY
- ▼ -116.39%
- Current HPI
- 277.8875
- Rent YoY
- ▼ -0.25%
- Metro
- Panama City, FL
- State GDP YoY
- ▲ 3.28%
- F500 in state
- 36
Industry mix (Fortune 500 HQ in FL)
| Industry | F500 HQs | Revenue |
|---|---|---|
| Industrial Technology | 2 | $29B |
|
||
| Insurance | 2 | $17B |
|
||
| Retail | 1 | $60B |
|
||
| Technology Distribution | 1 | $58B |
|
||
| Homebuilding | 1 | $35B |
|
||
| Technology Manufacturing | 1 | $35B |
|
||
Price history
-99.4% since first listed34 events — show timeline
- 2026-01-03 Rental Removed $1,500 APPFOLIO
- 2025-12-21 Listed $184,900 CPARMLS
- 2025-08-19 Listed for Rent $1,500 APPFOLIO
- 2024-01-21 Rental Removed $1,700 APPFOLIO
- 2023-10-20 Listed for Rent $1,700 APPFOLIO
- 2022-10-11 Delisted — ECAR
- 2022-10-11 Listing Removed — NAMLS
- 2022-10-11 Listing Removed — CPARMLS
- 2022-10-02 Price Changed $199,900 ECAR
- 2022-10-02 Price Changed $199,900 NAMLS
- 2022-10-02 Price Changed $199,900 CPARMLS
- 2022-09-13 Price Changed $207,900 ECAR
- 2022-09-13 Price Changed $207,900 NAMLS
- 2022-09-13 Price Changed $207,900 CPARMLS
- 2022-08-31 Price Changed $208,900 ECAR
- 2022-08-31 Price Changed $208,900 NAMLS
- 2022-08-31 Price Changed $208,900 CPARMLS
- 2022-08-17 Listed $229,900 ECAR
- 2022-08-17 Listed $229,900 NAMLS
- 2022-08-12 Listed $229,900 CPARMLS
- 2022-01-24 Sold (Public Records) $160,000 Public Records
- 2022-01-20 Sold (MLS) $160,000 CPARMLS
- 2021-10-27 Listed $165,000 CPARMLS
- 2020-08-10 Listing Removed — CPARMLS
- 2019-03-29 Listed $159,000 CPARMLS
- 2016-03-25 Listing Removed — CPARMLS
- 2016-01-21 Listed $126,000 CPARMLS
- 2012-09-24 Sold (Public Records) $40,500 Public Records
- 2012-09-19 Sold (MLS) $40,500 CPARMLS
- 2011-12-12 Listed $49,900 CPARMLS
- 2005-09-21 Sold (Public Records) $103,100 Public Records
- 2005-07-06 Sold (Public Records) $229,000 Public Records
- 2005-07-01 Sold (MLS) $229,000 CPARMLS
- 2005-03-29 Listed $239,900 CPARMLS
Property tax history
+10.8%/yrLatest (2025): $2,045 · +3.6% YoY. Source: county tax records.
Cash-flow waterfall
monthlySold comps — $/sqft
last 12 mo · ≤1 miLoading sold comps…