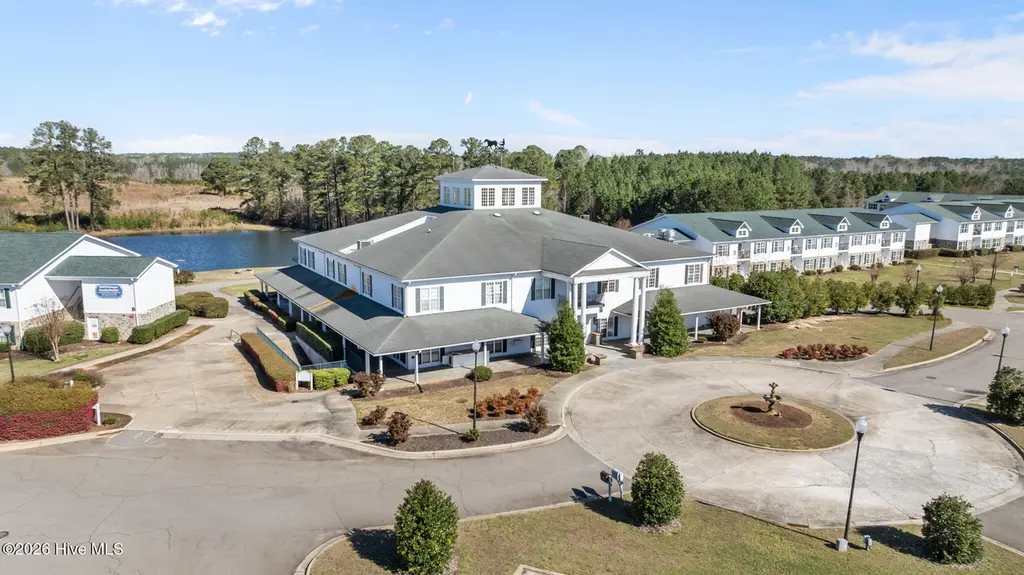
490 Little River Farm Blvd Unit 101a · Carthage, NC
Flood risk No data
- FEMA flood zone
- —
- Chance of flooding over 30 yrs
- —
- Est. flood insurance / yr
- —
Fire risk No data
- Est. fire insurance / yr
- —
Heat risk No data
- Hot days now (above threshold)
- —
- Hot days in 30 yrs
- —
Wind risk No data
- Chance of severe wind over 30 yrs
- —
Air-quality risk No data
- Unhealthy air days now
- —
- Unhealthy air days in 30 yrs
- —
Risk factors via First Street. Map © Google.
Why this score? — see what drove the C+ grade
The composite is a weighted blend of 9 inputs, each scored 0–100. Each bar is that input's sub-score; the figure is the points it added to the 100-point composite (weight × sub-score).
- Cash flow +25.2/30.0
- 1% rule +8.3/10.0
- DSCR +8.3/10.0
- ARV discount +7.5/15.0
- Schools +4.4/10.0
- Rent growth +3.5/5.0
- Livability +3.1/5.0
- Condition / age +2.5/5.0
- Appreciation +0.0/10.0
$115,000
🖨 Deal sheet 📄 Offer letter ✓ Due diligence
Listing remarks
This handsome condominium complex first floor, lake view, condo can be a single family residence or add two other units as short term or long term rental investment. Spacious bedrooms, combined Livingroom, Dining and Kitchen. New flooring, blinds and fully furnished . Location, location, location only 9 minutes away from Hospital in Pinehurst and all recreation shopping of Pinehurst. 11 minutes to Carthage. Relax on your private porch in Rocking Chairs. Pets allowed.
Key facts
- Private porch
- New flooring
- Lake view
Tags
Property features AI
Finance
- Other: Subdivision: Little River Fa
- HOA & community: Homeowners association with annual fee (approximately $2,856 annually / $238 monthly); Community sidewalks and street lights
Exterior
- Parking: Lighted, paved parking
- Utilities: Public water; Sewer available and connected; Water connected; Cable available
- Home design: Condominium; Residential property; Two levels; Private road frontage
- Construction: Brick, stone, fiber cement, and frame construction; Shingle roof; Slab foundation; Built within recent years (year built not provided)
- Exterior features: Porch; In-ground pool (see remarks); Level lot; Has view; Paved road
Interior
- Kitchen: Refrigerator; Dishwasher; Electric range; Microwave
- Bedrooms: 3 total rooms
- Flooring: Laminate
- Bathrooms: 2 full bathrooms
- Heating & cooling: Heat pump; Electric heating; Forced air; Has cooling; Has heating
- Interior features: Eat-in kitchen; Window coverings; Furnished
- Laundry & utility: Gas water heater; Tankless water heater
Neighborhood map
What this means for you Summary
Snapshot
- This is a 2-bed/2.0-bath condo listed at $115k.
Deal economics
- At list price, monthly cash flow is $258 ($3k/yr) — positive.
- The deal already cash-flows at list — no discount required.
- Meets the 1% rule at list price ($2k rent vs $115k).
- Recommended offer: $105k (9.0% below list) — sets the bar for market timing.
- Cap rate 9.0% vs local median 3.3% in Carthage — top-decile yield for the area; either an underpriced asset or a hidden risk that comps aren't pricing in. Stress-test before assuming the spread holds.
Location & tenants
- Location reads 62/100 on livability (#450 in NC) — a middle-class / working-renter tenant base. Strengths: cost of living A+, crime A, housing A; Watch: employment C-, health & safety C-, amenities F.
- Moore County Schools (rural): math 48% / reading 54% proficiency, ranked #58 of 178 in NC (top 33%) — acceptable for families but not a draw, mixed tenant base, ~2y average lease.
- Zoned schools: Sandhills Farm Life Elementary (math 42% / reading 57%, grade D, #417 of 1,410 statewide, top 32%, 394 students, 27% FRL); New Century Middle (math 47% / reading 55%, grade C, #106 of 475 statewide, top 22%, 625 students, 32% FRL); Union Pines High (math 63% / reading 70%, grade B, #150 of 535 statewide, top 28%, 1,438 students, 34% FRL).
- Market conditions: Rents rising fast (+4.0%/yr); 231 active listings in the ZIP; solid renter incomes; 941 units permitted in Moore County in 2024 (0 in 5+ unit buildings).
Forward outlook
- Local home prices are declining (-3.0%/yr); year-one equity from $795 of loan paydown is wiped out by about $3k of value loss. Plan a longer hold.
- Moore County population projected at +29% by 2050 — long-run rental-demand tailwind backs the buy-and-hold thesis.
- At projected returns (-3.0% appreciation + 4.0% rent growth), your $32k cash investment doubles in ~10 years — after that, you're playing with house money.
Negotiation context
- It's been on market 91 days — a 9% lower offer ($105k) is reasonable based on typical stale-listing flexibility.
- Current owner paid $100k; 15% above their basis — modest negotiation headroom, anchor on the comps not their cost.
Questions for the listing agent
- It's been on market 91 days. Have you received any prior offers? Is the seller open to a 9% concession, seller financing, or rate buy-down credit?
- What does the HOA fee cover, when was the last increase, and are there any pending special assessments or reserve-fund shortfalls?
- Any open or pending special assessments — roof, HVAC, plumbing, elevator, façade? What's the per-unit balance and payoff schedule, and is the seller paying it off at close or rolling it to the buyer?
- Why hasn't it sold? Are there any deal-killer items the seller is aware of (foundation, flood, title, zoning, code violations)?
- Is there a deadline driving the sale (1031 exchange, divorce, estate, relocation)? That informs how much negotiation room exists.
- Schools are F-rated, which usually means shorter tenancies and higher turnover. Who's the typical renter profile here, and what's been the actual vacancy rate?
- What's the average days-on-market for RENTAL listings here right now (not sales)? A rising rental-DOM trend means longer vacancies and softer asking-rent achievability than the comps imply.
- What's the recent tenant-quality profile in this submarket — average credit score on applications, eviction rate, late-payment / NSF rate, and stable-employment percentage? A property-management company in the area should have these aggregated.
- How much new apartment / multifamily construction is in the pipeline within 1–3 miles? Heavy new supply (>2% of stock underway) typically softens rents 12–24 months out; light construction supports rent growth.
Investment metrics
- 1% rule
- 1.33% ✓
- Cap rate
- 8.99%
- Cash-on-cash
- 9.63%
- DSCR
- 1.43
- GRM
- 6.2
CMA / ARV
No comps found within radius.
Projected returns pro-forma
-3.0% appreciation · 4.04% rent growth · sell at horizon
- IRR
- -0.3%
- Equity multiple
- 0.99×
- Total profit
- $-434
- Equity at exit
- $17,147
- IRR
- 10.6%
- Equity multiple
- 1.87×
- Total profit
- $28,106
- Equity at exit
- $9,943
Cash invested: $32,200 (down + closing). Projections, not guarantees.
Landlord ↔ Tenant lean methodology
- Overall (STATE)
- 85 Strongly Landlord-Friendly
- State North Carolina
- 85 Strongly Landlord-Friendly · R+3
- County
- — inherits STATE
- City
- — inherits STATE
ZIP-level market 28327
- Home prices YoY
- -33.0%
- Rents YoY
- 4.0%
- Active inventory
- 231
- Price-to-rent
- 6.2×
Monthly cashflow live
- Estimated rent
- $1,535 medium interval (Pro) →
- Mortgage (P&I)
- −$603
- Tax from tax record
- −$65 /mo · $781/yr
- Insurance
- −$48
- HOA
- −$238
- Vacancy / Maint / Mgmt
- −$322
- Net cashflow
- $258
Break-even live
UW: 25.0% down · 7.5% · 30yr · 1.5% tax · 5.0% vac · 8.0% maint · 8.0% mgmt
Financing live
Cash to close
- Down payment
- $28,750
- Closing costs
- $3,450
- Reserves months
- —
- Total cash needed
- —
Loan-product check · same deal, 3 products live
Conventional
25% down · 7.5% · 30yr
- Down + closing
- —
- Monthly P&I
- —
- Monthly cashflow
- —
- DSCR
- —
- Eligible?
- —
Personal DTI + credit; lowest rate.
DSCR
20% down · 8.5% · 30yr
- Down + closing
- —
- Monthly P&I
- —
- Monthly cashflow
- —
- DSCR
- —
- Eligible?
- —
No personal income docs; deal must DSCR.
Hard money
10% down · 12.0% · 12mo
- Down + closing
- —
- Monthly P&I
- —
- Monthly cashflow
- —
- DSCR
- —
- Eligible?
- —
Short-term bridge; refi at stabilization.
HOA detail condo
- Monthly dues
- $238 · $2,856/yr
- Assessments
- None detected in remarks — confirm with the listing agent.
Listing history 18 events
-
2026-06-19days on market $115,000 Active 91 DOM
-
2026-06-18days on market $115,000 Active 90 DOM
-
2026-06-17days on market $115,000 Active 89 DOM
-
2026-06-16days on market $115,000 Active 88 DOM
-
2026-06-15days on market $115,000 Active 87 DOM
-
2026-06-14days on market $115,000 Active 85 DOM
-
2026-06-13days on market $115,000 Active 84 DOM
-
2026-06-10days on market $115,000 Active 82 DOM
-
2026-06-09days on market $115,000 Active 81 DOM
-
2026-06-08days on market $115,000 Active 80 DOM
-
2026-06-07days on market $115,000 Active 79 DOM
-
2026-06-05days on market $115,000 Active 76 DOM
-
2026-06-02days on market $115,000 Active 74 DOM
-
2026-06-01days on market $115,000 Active 73 DOM
-
2026-05-31days on market $115,000 Active 72 DOM
-
2026-05-30days on market $115,000 Active 71 DOM
-
2026-03-19$115,000 Active
-
2021-11-01soldstatus $100,000
ⓘ Source: listings_history table (triggers on properties + properties_extension) + one-shot
backfill from property_details.listing_events for pre-trigger history.
Tax reassessment forecast NC · Resets to sale price
- Current annual tax
- $781 · $65/mo
- Projected year-2 tax
- $943 · $79/mo
- Expected delta
- +$162/yr (+$13/mo · 20.7%)
ⓘ Screening estimate from a state-policy table — verify with the county assessor before closing.
Nearby sold comps map
Loading sold comps map…
Walkable amenities ~0.75 mi
Loading nearby amenities…
Taxation est. · year 1
- Rental income
- $18,417
- − Mortgage interest
- −$6,442
- − Property taxes
- −$781
- − Insurance
- −$575
- − Repairs & maintenance
- −$1,473
- − Management
- −$1,473
- − HOA
- −$2,856
- − Depreciation
- −$3,345
- Taxable income
- $1,471
- Est. tax owed @ 24.0%
- −$353
- After-tax cash flow
- $2,748/yr
For passive investors: Depreciation is non-cash, so a rental often shows a tax loss while cash-flowing — sheltering income. Rental losses are passive: they offset passive income freely, and up to $25,000/yr can offset ordinary (W-2) income if you actively participate and your MAGI is under $100k (phasing out to $0 by $150k); unused losses carry forward. On sale, claimed depreciation is recaptured at up to 25%, and gains may owe capital-gains tax (a 1031 exchange can defer both). Figures are a year-1 estimate at your 24.0% rate — not tax advice; consult a CPA.
Schools (NCES district)
- District
- Moore County Schools
- NCES district ID
- 3703090
- Math proficiency
- 48% ▲ 5.00%
- Reading proficiency
- 54% ▲ 5.00%
- Median HH income
- $50,333
- Composite
- 43.63/100
- National rank
- #2967
- State rank
- #58 of 178 in NC
Livability — Carthage
- Score
- 62/100
- State rank
- #450
- US rank
- #16574
Category grades
Schools grade is shown separately in the Schools card above.
Census & demographics
- Census place
- Carthage, NC
- County
- Moore County · 75,247 people
- City population
- 19,386
- Metro
- Pinehurst-Southern Pines, NC
- Population (ZIP)
- 19,386
- Household income
- $87,434
- Rent vs Own
- Severe rent burden
- 156.0
Population outlook (Moore County) Hauer SSP2
- Today (2025)
- 106,902 people
- By 2030
- 113,134 · +5.8%
- By 2040
- 125,682 · +17.6%
- By 2050
- 137,811 · +28.9%
- By 2075
- 164,387 · +53.8%
- By 2100
- 175,595 · +64.3%
Race, ethnicity, and origin ACS 2023
- Neighborhood character
- Predominantly White (83%)
- Race & ethnicity
- White 83% Hispanic / Latino 8% Black 6% Two or more races 4%
- Hispanic origin (detail)
- Mexican 4% Puerto Rican 1%
- Common ancestry
- Slovak 5% Italian 3% Serbian 2%
- Foreign-born
- 3% · Canada
- Languages at home
- 94% English-only · Spanish 5%
Political lean MEDSL · Moore
- 2024 margin
- Strong R (+29.5) · D 34.8% · R 64.3%
- 2008→2024 swing
- -8.1pp toward R · 2008: -21.4pp · 2024: -29.5pp
- All cycles
- 2024: R+29.5 2020: R+27.4 2016: R+29.6 2012: R+28.1 2008: R+21.4
Not yet ingested
- Civics
- —
Market trends
- HPI YoY
- ▼ -93.86%
- Current HPI
- 190.6404
- Rent YoY
- ▲ 4.04%
- Metro
- Pinehurst-Southern Pines, NC
- State GDP YoY
- ▲ 3.28%
- F500 in state
- 26
Industry mix (Fortune 500 HQ in NC)
| Industry | F500 HQs | Revenue |
|---|---|---|
| Financial Services | 2 | $213B |
|
||
| Retail | 2 | $95B |
|
||
| Industrial Conglomerate | 1 | $38B |
|
||
| Metals / Steel | 1 | $35B |
|
||
| Utilities | 1 | $30B |
|
||
| Industrial Machinery | 1 | $19B |
|
||
Price history
+15.0% since first listed2 events — show timeline
- 2026-03-19 Listed $115,000 Hive MLS
- 2021-11-01 Sold (Public Records) $100,000 Public Records
Property tax history
-4.6%/yrLatest (2024): $781 · -2.3% YoY. Source: county tax records.
Cash-flow waterfall
monthlySold comps — $/sqft
last 12 mo · ≤1 miLoading sold comps…