 🏗️ New Construction
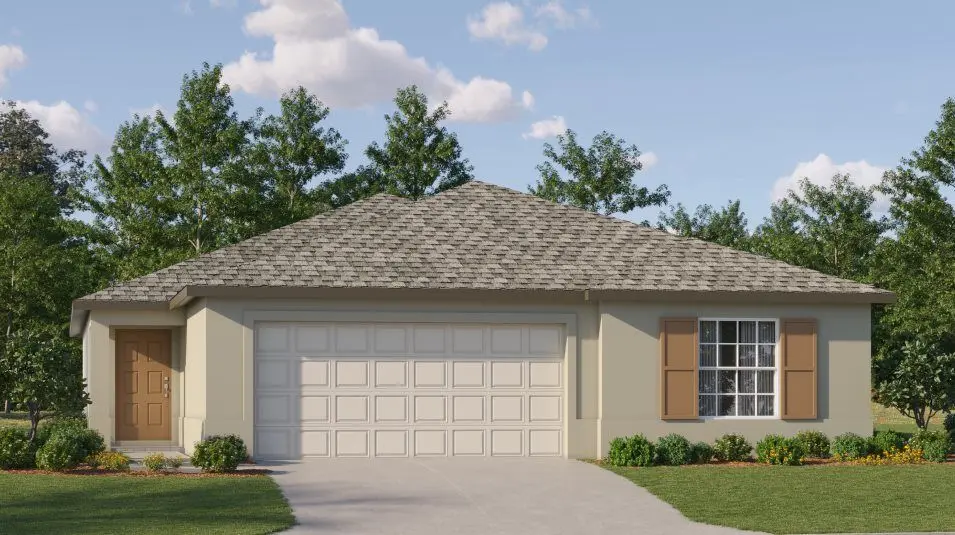
Harrisburg Plan · Balm, FL
Flood risk No data
- FEMA flood zone
- —
- Chance of flooding over 30 yrs
- —
- Est. flood insurance / yr
- —
Fire risk No data
- Est. fire insurance / yr
- —
Heat risk No data
- Hot days now (above threshold)
- —
- Hot days in 30 yrs
- —
Wind risk No data
- Chance of severe wind over 30 yrs
- —
Air-quality risk No data
- Unhealthy air days now
- —
- Unhealthy air days in 30 yrs
- —
Risk factors via First Street. Map © Google.
Why this score? — see what drove the D grade
The composite is a weighted blend of 9 inputs, each scored 0–100. Each bar is that input's sub-score; the figure is the points it added to the 100-point composite (weight × sub-score).
- Cash flow +11.0/30.0
- ARV discount +7.5/15.0
- Schools +4.2/10.0
- Condition / age +4.0/5.0
- Appreciation +3.8/10.0
- 1% rule +3.2/10.0
- DSCR +3.2/10.0
- Livability +3.2/5.0
- Rent growth +1.9/5.0
$339,200
🖨 Deal sheet 📄 Offer letter ✓ Due diligence
Listing remarks
This convenient single-story plan opens to an inviting dining room with shared access to the kitchen and family room, ideal for seamless modern living. Tucked behind the kitchen, three secondary bedrooms enjoy their own wing of the home, while the expansive owner's suite is ideally situated in the back corner, a peaceful retreat.
Key facts
- 2 garage spots
- Listed 56 days
Property features AI
Finance
- Financial info: List price $331,000
Exterior
- Parking: 2-car garage / 2 parking spaces
- Home design: Single-family plan (Harrisburg); New construction
- Exterior features: Living area approximately 1817 (listed)
Interior
- Bedrooms: 4 bedrooms
- Bathrooms: 2 full bathrooms
- Interior features: Open living area (plan); New construction plan: Harrisburg
Neighborhood map
What this means for you Summary
Snapshot
- This is a 4-bed/2.0-bath single-family listed at $339k. Condition is rated good.
Deal economics
- At list price, monthly cash flow is $-140 ($-2k/yr) — negative.
- To cash-flow at today's rent, offer at most $319k (6.0% below list).
- To meet the 1% rule (rent ≥ 1% of price), the offer needs to be $279k (17.8% below list).
- Recommended offer: $279k (17.8% below list) — sets the bar for 1% rule.
Location & tenants
- Location reads 63/100 on livability (#742 in FL) — a middle-class / working-renter tenant base. Strengths: crime A+, employment A+, housing A+; Watch: schools F, amenities F, commute F.
- Hillsborough (suburban): math 47% / reading 50% proficiency, ranked #41 of 73 in FL (top 56%) — families likely to look elsewhere, expect single-tenant / working-renter base with shorter leases.
- Market conditions: Rents soft (-2.5%/yr); 674 active listings in the ZIP; 3 comparable units currently listed for rent nearby; rentals at typical pace (median 24d on market — plan ~3-4 weeks tenant-placement turnaround); solid renter incomes; 9,053 units permitted in Hillsborough County in 2024 (4,555 in 5+ unit buildings).
- This rent runs 34% of the median local income ($98k/yr) — at the standard rent-burdened threshold; future hikes will face affordability resistance.
Forward outlook
- Local home prices are declining (-2.4%/yr); year-one equity from $2k of loan paydown is wiped out by about $8k of value loss. Plan a longer hold.
- Hillsborough County population projected at +37% by 2050 — long-run rental-demand tailwind backs the buy-and-hold thesis.
Negotiation context
- It's been on market 56 days — a 3% lower offer ($329k) is reasonable based on typical stale-listing flexibility.
Questions for the listing agent
- What do current leases actually rent for vs. the listed asking? Can we see a recent rent roll and the last 12 months of T-12 income?
- It's been on market 56 days. Have you received any prior offers? Is the seller open to a 18% concession, seller financing, or rate buy-down credit?
- Is there a deadline driving the sale (1031 exchange, divorce, estate, relocation)? That informs how much negotiation room exists.
- Schools are F-rated, which usually means shorter tenancies and higher turnover. Who's the typical renter profile here, and what's been the actual vacancy rate?
- The area grade is low — what's the realistic commute time and amenity access for the typical tenant pool here? Any planned neighborhood developments (good or bad) we should know about?
- What's the average days-on-market for RENTAL listings here right now (not sales)? A rising rental-DOM trend means longer vacancies and softer asking-rent achievability than the comps imply.
- What's the recent tenant-quality profile in this submarket — average credit score on applications, eviction rate, late-payment / NSF rate, and stable-employment percentage? A property-management company in the area should have these aggregated.
- How much new for-sale + rental construction is in the pipeline within 1–3 miles? Heavy new supply typically softens prices + rents 12–24 months out; constrained supply supports both.
Investment metrics
- 1% rule
- 0.82% ✗
- Cap rate
- 5.80%
- Cash-on-cash
- -1.78%
- DSCR
- 0.92
- GRM
- 10.1
CMA / ARV
No comps found within radius.
Projected returns pro-forma
-2.35% appreciation · 0.0% rent growth · sell at horizon
- IRR
- -18.0%
- Equity multiple
- 0.34×
- Total profit
- $-62,681
- Equity at exit
- $60,538
- IRR
- -16.1%
- Equity multiple
- 0.06×
- Total profit
- $-89,320
- Equity at exit
- $46,730
Cash invested: $94,976 (down + closing). Projections, not guarantees.
Landlord ↔ Tenant lean methodology
- Overall (STATE)
- 87 Strongly Landlord-Friendly
- State Florida
- 87 Strongly Landlord-Friendly · R+3
- County
- — inherits STATE
- City
- — inherits STATE
ZIP-level market 33598
- Home prices YoY
- -0.9%
- Rents YoY
- -2.5%
- Active inventory
- 674
- Price-to-rent
- 10.1×
Monthly cashflow live
- Estimated rent
- $2,789 medium interval (Pro) →
- Mortgage (P&I)
- −$1,779
- Tax est. 1.5%
- −$424 /mo · $5,088/yr
- Insurance
- −$141
- HOA
- −$0
- Vacancy / Maint / Mgmt
- −$586
- Net cashflow
- $-140
Break-even live
UW: 25.0% down · 7.5% · 30yr · 1.5% tax · 5.0% vac · 8.0% maint · 8.0% mgmt
Financing live
Cash to close
- Down payment
- $84,800
- Closing costs
- $10,176
- Reserves months
- —
- Total cash needed
- —
Loan-product check · same deal, 3 products live
Conventional
25% down · 7.5% · 30yr
- Down + closing
- —
- Monthly P&I
- —
- Monthly cashflow
- —
- DSCR
- —
- Eligible?
- —
Personal DTI + credit; lowest rate.
DSCR
20% down · 8.5% · 30yr
- Down + closing
- —
- Monthly P&I
- —
- Monthly cashflow
- —
- DSCR
- —
- Eligible?
- —
No personal income docs; deal must DSCR.
Hard money
10% down · 12.0% · 12mo
- Down + closing
- —
- Monthly P&I
- —
- Monthly cashflow
- —
- DSCR
- —
- Eligible?
- —
Short-term bridge; refi at stabilization.
Rent comps 3 comps
| Address | Beds | Baths | Sqft | Rent | $/sqft | DOM | Units | Dist |
|---|---|---|---|---|---|---|---|---|
| 15007 Coltman Hill Pl Wimauma, FL | 4.0 | 2.5 | 1924 | $2,550 | $1.33 | 24d | 1 | 0.33mi |
| 13181 Garnet Raspberry Ave Wimauma, FL | 4.0 | 2.0 | 1935 | $2,500 | $1.29 | 24d | 1 | 0.90mi |
| 13095 Calcite Blue Ave Wimauma, FL | 4.0 | 2.0 | 1936 | $2,300 | $1.19 | 17d | 1 | 1.03mi |
Listing history 25 events
-
2026-06-18days on market $339,200 Active 56 DOM
-
2026-06-17days on market $339,200 Active 55 DOM
-
2026-06-16days on market $339,200 Active 54 DOM
-
2026-06-15price $339,200 Active 53 DOM
-
2026-06-15days on market $336,600 Active 53 DOM
-
2026-06-13pricedays on market $336,600 Active 51 DOM
-
2026-06-13days on market $336,400 Active 50 DOM
-
2026-06-09days on market $336,400 Active 47 DOM
-
2026-06-08pricedays on market $336,400 Active 46 DOM
-
2026-06-07pricedays on market $334,200 Active 45 DOM
-
2026-06-04days on market $334,100 Active 42 DOM
-
2026-06-03days on market $334,100 Active 41 DOM
-
2026-06-02pricedays on market $334,100 Active 40 DOM
-
2026-06-02price $333,100 Active 39 DOM
-
2026-06-01pricedays on market $332,900 Active 39 DOM
-
2026-05-31pricedays on market $332,700 Active 38 DOM
-
2026-05-17price $331,000 331-char remark
-
2026-05-16price $330,700 331-char remark
-
2026-05-10price $330,500 331-char remark
-
2026-05-09price $330,000 331-char remark
-
2026-05-08price $329,750 331-char remark
-
2026-05-05price $340,225 331-char remark
-
2026-05-01price $345,225 331-char remark
-
2026-04-25price $344,975 331-char remark
-
2026-04-23$344,475 Active 331-char remark
ⓘ Source: listings_history table (triggers on properties + properties_extension) + one-shot
backfill from property_details.listing_events for pre-trigger history.
Nearby sold comps map
Loading sold comps map…
Walkable amenities ~0.75 mi
Loading nearby amenities…
Taxation est. · year 1
- Rental income
- $33,473
- − Mortgage interest
- −$19,000
- − Property taxes
- −$5,088
- − Insurance
- −$1,696
- − Repairs & maintenance
- −$2,678
- − Management
- −$2,678
- − Depreciation
- −$9,868
- Taxable loss
- −$7,535
- Est. tax savings @ 24.0%
- +$1,808
- After-tax cash flow
- $122/yr
For passive investors: Depreciation is non-cash, so a rental often shows a tax loss while cash-flowing — sheltering income. Rental losses are passive: they offset passive income freely, and up to $25,000/yr can offset ordinary (W-2) income if you actively participate and your MAGI is under $100k (phasing out to $0 by $150k); unused losses carry forward. On sale, claimed depreciation is recaptured at up to 25%, and gains may owe capital-gains tax (a 1031 exchange can defer both). Figures are a year-1 estimate at your 24.0% rate — not tax advice; consult a CPA.
Condition & rehab AI · 6 photos
This single-story home is in good condition with a good condition score of 80. It has a cosmetic rehab level and requires minimal repairs. The highest-ROI updates include painting exterior shutters, replacing the kitchen faucet, and installing smart home devices.
Value-add opportunities
- Resale Paint exterior shutters — Enhances curb appeal
- Both Replace kitchen faucet — Improves functionality and aesthetics
- Both Install smart home devices — Enhances convenience and marketability
Renovation cost estimate screening
Value-add ROI direction
- Resale Paint exterior shutters — Enhances curb appeal ↑
- Both Replace kitchen faucet — Improves functionality and aesthetics ↑
- Both Install smart home devices — Enhances convenience and marketability ↑
ⓘ Cost ranges are severity-bucket heuristics (US national rule-of-thumb). Get contractor quotes + a written scope before underwriting a rehab budget.
Schools (NCES district)
- District
- Hillsborough
- NCES district ID
- 1200870
- Math proficiency
- 47% ▼ -8.00%
- Reading proficiency
- 50% ▼ -4.00%
- Median HH income
- $50,622
- Composite
- 41.6/100
- National rank
- #3435
- State rank
- #41 of 73 in FL
Livability — Balm
- Score
- 63/100
- State rank
- #742
- US rank
- #16016
Category grades
Schools grade is shown separately in the Schools card above.
Census & demographics
- Census place
- Balm, FL
- County
- Hillsborough County · 1,540,968 people
- City population
- 196
- Metro
- Tampa-St. Petersburg-Clearwater, FL
- Population (ZIP)
- 32,820
- Household income
- $97,520
- Rent vs Own
- Severe rent burden
- 149.0
Population outlook (Hillsborough County) Hauer SSP2
- Today (2025)
- 1,607,022 people
- By 2030
- 1,733,968 · +7.9%
- By 2040
- 1,979,565 · +23.2%
- By 2050
- 2,203,427 · +37.1%
- By 2075
- 2,667,893 · +66.0%
- By 2100
- 2,891,558 · +79.9%
Race, ethnicity, and origin ACS 2023
- Neighborhood character
- Diverse neighborhood (Simpson 0.67)
- Race & ethnicity
- White 40% Hispanic / Latino 39% Black 14% Two or more races 11% Asian 2%
- Hispanic origin (detail)
- Mexican 26% Puerto Rican 3% Cuban 1%
- Common ancestry
- Romanian 2% Scotch-Irish 2% Lithuanian 1%
- Foreign-born
- 23% · Canada, Jamaica, Guatemala
- Languages at home
- 62% English-only · Spanish 35% Other Indo-European 1% Arabic 1%
Political lean MEDSL · Hillsborough
- 2024 margin
- Toss-up / Even · D 47.8% · R 50.9% · Other 1.3%
- 2008→2024 swing
- -10.2pp toward R · 2008: 7.1pp · 2024: -3.1pp
- All cycles
- 2024: R+3.1 2020: D+6.9 2016: D+6.8 2012: D+6.7 2008: D+7.1
Not yet ingested
- Civics
- —
Market trends
- HPI YoY
- ▼ -2.35%
- Current HPI
- 271.8552
- Rent YoY
- ▼ -2.50%
- Metro
- Tampa-St. Petersburg-Clearwater, FL
- State GDP YoY
- ▲ 3.28%
- F500 in state
- 36
Industry mix (Fortune 500 HQ in FL)
| Industry | F500 HQs | Revenue |
|---|---|---|
| Industrial Technology | 2 | $29B |
|
||
| Insurance | 2 | $17B |
|
||
| Retail | 1 | $60B |
|
||
| Technology Distribution | 1 | $58B |
|
||
| Homebuilding | 1 | $35B |
|
||
| Technology Manufacturing | 1 | $35B |
|
||
Cash-flow waterfall
monthlySold comps — $/sqft
last 12 mo · ≤1 miLoading sold comps…