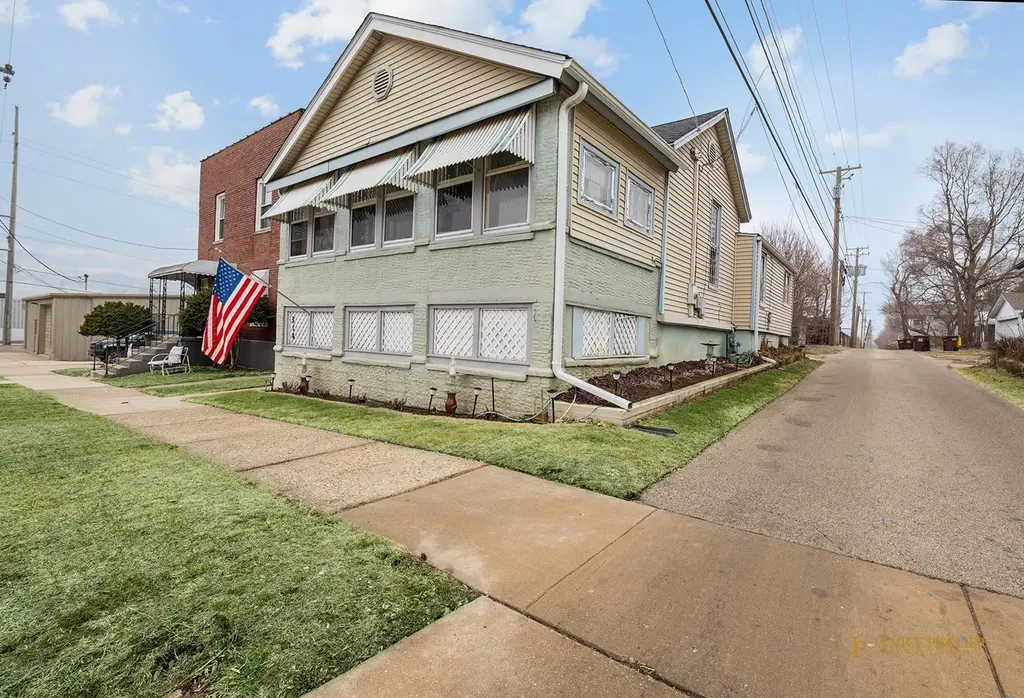
314 Olive St · Rockford, IL
Flood risk 2/10 · Minimal
- FEMA flood zone
- X (unshaded)
- Chance of flooding over 30 yrs
- 0.09%
- Est. flood insurance / yr
- $473 – $860
Fire risk 1/10 · Minimal
- Est. fire insurance / yr
- $804 – $1,492
Heat risk 2/10 · Minimal
- Hot days now (above 101°F)
- 7 days/yr
- Hot days in 30 yrs
- 15 days/yr
Wind risk 2/10 · Minimal
- Chance of severe wind over 30 yrs
- —
Air-quality risk 2/10 · Minimal
- Unhealthy air days now
- 1 days/yr
- Unhealthy air days in 30 yrs
- 2 days/yr
Risk factors via First Street. Map © Google.
Why this score? — see what drove the C- grade
The composite is a weighted blend of 9 inputs, each scored 0–100. Each bar is that input's sub-score; the figure is the points it added to the 100-point composite (weight × sub-score).
- Cash flow +25.5/30.0
- DSCR +8.4/10.0
- 1% rule +6.3/10.0
- Rent growth +4.0/5.0
- Livability +3.1/5.0
- Condition / age +2.5/5.0
- Schools +1.2/10.0
- ARV discount +0.0/15.0
- Appreciation +0.0/10.0
$115,000
🖨 Deal sheet (PDF) 📄 Offer letter ✓ Due diligence
Listing remarks MLS
Check out this adorable home located just seconds from the Rock River and many popular Rockford shops and restaurants. The main floor features two bedrooms, one full bathroom, a kitchen, living room, and a finished front porch that adds extra living space. The basement offers an additional finished living area, along with a half bathroom and plenty of storage. A one-car garage is accessible from the alley behind the home. The property is currently rented on a month-to-month basis for $900 per month, making it a great investment opportunity. It could also serve as a low-maintenance primary residence. Recent improvements include a new roof (2019), furnace (2024), air conditioning system (2025), and hot water heater (2019). "Agent Owned"
Key facts
- One car garage
- New furnace
- Finished living area
Tags
Neighborhood map
What this means for you Summary
Snapshot
- This is a 2-bed/1.5-bath single-family listed at $115k.
Deal economics
- At list price, monthly cash flow is $267 ($3k/yr) — positive.
- The deal already cash-flows at list — no discount required.
- Meets the 1% rule at list price ($1k rent vs $115k).
- Recommended offer: $105k (9.0% below list) — sets the bar for market timing.
- Cap rate 9.1% vs local median 6.1% in Rockford — top-decile yield for the area; either an underpriced asset or a hidden risk that comps aren't pricing in. Stress-test before assuming the spread holds.
Location & tenants
- Location reads 62/100 on livability (#876 in IL) — a middle-class / working-renter tenant base. Strengths: cost of living A+, housing A+, health & safety A+; Watch: crime F, amenities F, commute F.
- Rockford SD 205 (urban): math 12% / reading 16% proficiency, ranked #533 of 620 in IL (top 86%) — low school quality limits family demand, transient renter base, plan for 1-2y turnover; 73% free/reduced lunch — lower-income household profile, screen leases tightly.
- Zoned schools: C Henry Bloom Elem School (math 12% / reading 8%, grade F, #1,517 of 2,056 statewide, top 78%, 410 students, 0% FRL); Abraham Lincoln Middle School (math 3% / reading 7%, grade F, #636 of 665 statewide, top 98%, 699 students, 0% FRL); Rockford East High School (math 7% / reading 13%, grade F, #528 of 693 statewide, top 82%, 1,718 students, 0% FRL) — zoned schools average 0% FRL vs 73% district-wide (73 pts lower); this property's tenant base skews higher-income than the district average.
- Market conditions: Rents rising fast (+5.9%/yr); 157 active listings in the ZIP; 18 comparable units currently listed for rent nearby; rentals lingering (median 45d on market — plan ~5-8 weeks vacancy on turnover, expect pricing pressure); 56% of comp listings sitting > 30 days — soft ceiling on asking rent; solid renter incomes; 285 units permitted in Winnebago County in 2024 (0 in 5+ unit buildings).
Forward outlook
- Local home prices are declining (-3.0%/yr); year-one equity from $795 of loan paydown is wiped out by about $3k of value loss. Plan a longer hold.
- Winnebago County population projected at -20% by 2050 — secular population decline; favor cash flow + early exit over multi-decade hold.
- At projected returns (-3.0% appreciation + 5.9% rent growth), your $32k cash investment doubles in ~9 years — after that, you're playing with house money.
Negotiation context
- It's been on market 91 days — a 9% lower offer ($105k) is reasonable based on typical stale-listing flexibility.
- Current owner paid $60k; list at $115k implies a 92% gain — meaningful room to come down on a strong offer.
Risks & watch-outs
- Watch-outs: built in 1920 — expect roof / HVAC / electrical / plumbing capex.
Questions for the listing agent
- It's been on market 91 days. Have you received any prior offers? Is the seller open to a 9% concession, seller financing, or rate buy-down credit?
- Built in 1920 — when were the roof, HVAC, electrical panel, plumbing, and water heater last replaced?
- Why hasn't it sold? Are there any deal-killer items the seller is aware of (foundation, flood, title, zoning, code violations)?
- Is there a deadline driving the sale (1031 exchange, divorce, estate, relocation)? That informs how much negotiation room exists.
- Schools are F-rated, which usually means shorter tenancies and higher turnover. Who's the typical renter profile here, and what's been the actual vacancy rate?
- Crime grade is F in this area — have there been break-ins, vandalism, or insurance claims at this property in the last 3 years? What carrier currently insures it and at what premium?
- What's the average days-on-market for RENTAL listings here right now (not sales)? A rising rental-DOM trend means longer vacancies and softer asking-rent achievability than the comps imply.
- What's the recent tenant-quality profile in this submarket — average credit score on applications, eviction rate, late-payment / NSF rate, and stable-employment percentage? A property-management company in the area should have these aggregated.
- How much new for-sale + rental construction is in the pipeline within 1–3 miles? Heavy new supply typically softens prices + rents 12–24 months out; constrained supply supports both.
Investment metrics
- 1% rule
- 1.13% ✓
- Cap rate
- 9.08%
- Cash-on-cash
- 9.97%
- DSCR
- 1.44
- GRM
- 7.4
CMA / ARV
- ARV (median comp)
- $97,858
- List price
- $115,000
- Delta
- 17.52%
- Verdict
- OVERPRICED
- Comps
- 20 within 1.0 mi
Show comp detail 12 sales within ~0.75 mi
| Address | Dist | Beds/Ba | Sqft | Sold | Price | $/sf | Match |
|---|---|---|---|---|---|---|---|
| 1136 Jackson St | 0.38mi | 3/1.5 (+1) | 1,330 (+1%) | 7mo | $80,000 | $60 | 69 |
| 1033 Spafford Ave | 0.48mi | 3/1.0 (+1) | 1,328 (+1%) | 1mo | $73,000 | $55 | 68 |
| 900 Ridgewood Rd | 0.52mi | 3/1.0 (+1) | 1,266 (-4%) | 2mo | $195,000 | $154 | 62 |
| 418 Adams st St | 0.50mi | 3/2.0 (+1) | 1,240 (-6%) | 0mo | $170,000 | $137 | 60 |
| 1315 Benton St | 0.58mi | 3/1.5 (+1) | 1,250 (-5%) | 1mo | $160,900 | $129 | 59 |
| 1508 Rural St | 0.62mi | 3/1.0 (+1) | 1,389 (+6%) | 0mo | $165,000 | $119 | 54 |
| 1436 Jackson St | 0.66mi | 3/1.0 (+1) | 1,380 (+5%) | 2mo | $120,000 | $87 | 52 |
| 730 Woodlawn Ave | 0.70mi | 3/1.5 (+1) | 1,232 (-6%) | 2mo | $92,900 | $75 | 51 |
| 621 Napoleon St | 0.70mi | 2/1.0 | 1,437 (+10%) | 1mo | $45,000 | $31 | 49 |
| 1125 Grant Ave | 0.72mi | 3/1.0 (+1) | 1,270 (-3%) | 7mo | $65,000 | $51 | 48 |
| 618 Napoleon St | 0.68mi | 2/1.0 | 1,200 (-8%) | 5mo | $115,000 | $96 | 48 |
| 735 Joslyn St | 0.62mi | 3/1.0 (+1) | 1,170 (-11%) | 3mo | $163,000 | $139 | 44 |
Match score weights: distance 35% · size 25% · config 20% · recency 20%. Top-matched comps best support the ARV.
Projected returns pro-forma
-3.0% appreciation · 5.92% rent growth · sell at horizon
- IRR
- 1.8%
- Equity multiple
- 1.07×
- Total profit
- $2,317
- Equity at exit
- $17,147
- IRR
- 14.0%
- Equity multiple
- 2.27×
- Total profit
- $41,019
- Equity at exit
- $9,943
Cash invested: $32,200 (down + closing). Projections, not guarantees.
Landlord ↔ Tenant lean methodology
- Overall (STATE)
- 43 Moderately Tenant-Leaning
- State Illinois
- 43 Moderately Tenant-Leaning · D+7
- County
- — inherits STATE
- City
- — inherits STATE
ZIP-level market 61107
- Home prices YoY
- -20.1%
- Rents YoY
- 5.9%
- Active inventory
- 157
- Price-to-rent
- 7.4×
Monthly cashflow live
- Estimated rent
- $1,296 high interval (Pro) →
- Mortgage (P&I)
- −$603
- Tax from tax record
- −$106 /mo · $1,269/yr
- Insurance
- −$48
- HOA
- −$0
- Vacancy / Maint / Mgmt
- −$272
- Net cashflow
- $267
Break-even live
Sensitivity live
| Price | -10% $333 | -5% $300 | +0% $267 | +5% $235 | +10% $202 |
|---|---|---|---|---|---|
| Rent | -10% $165 | -5% $216 | +0% $267 | +5% $319 | +10% $370 |
| Rate | -1.0pp $325 | -0.5pp $297 | base $267 | +0.5pp $238 | +1.0pp $207 |
UW: 25.0% down · 7.5% · 30yr · 1.5% tax · 5.0% vac · 8.0% maint · 8.0% mgmt
Financing live
Cash to close
- Down payment
- $28,750
- Closing costs
- $3,450
- Reserves months
- —
- Total cash needed
- —
Loan-product check · same deal, 3 products live
Conventional
25% down · 7.5% · 30yr
- Down + closing
- —
- Monthly P&I
- —
- Monthly cashflow
- —
- DSCR
- —
- Eligible?
- —
Personal DTI + credit; lowest rate.
DSCR
20% down · 8.5% · 30yr
- Down + closing
- —
- Monthly P&I
- —
- Monthly cashflow
- —
- DSCR
- —
- Eligible?
- —
No personal income docs; deal must DSCR.
Hard money
10% down · 12.0% · 12mo
- Down + closing
- —
- Monthly P&I
- —
- Monthly cashflow
- —
- DSCR
- —
- Eligible?
- —
Short-term bridge; refi at stabilization.
Rent comps 18 comps
| Address | Beds | Baths | Sqft | Rent | $/sqft | DOM | Units | Dist |
|---|---|---|---|---|---|---|---|---|
| 607 N 2nd St Unit 607-6 Rockford, IL | 2.0 | 1.0 | 875 | $950 | $1.09 | 45d | 1 | 0.15mi |
| 913 N Main St Rockford, IL | 2.0 | 1.0–2.0 | 1050 | $2,300 | $2.19 | 22d | 1 | 0.34mi |
| 314 N Longwood St Rockford, IL | 2.0 | 1.0 | 1060 | $1,100 | $1.04 | 45d | 1 | 0.40mi |
| 203 Carlton Ter Rockford, IL | 2.0 | 1.0 | 900 | $1,250 | $1.39 | 22d | 1 | 0.41mi |
| 1112 Crosby St Rockford, IL | 2.0 | 1.0 | 1000 | $1,050 | $1.05 | 22d | 1 | 0.44mi |
| 922 N Church St Rockford, IL | 2.0 | 2.0 | 1150 | $1,450 | $1.26 | 45d | 1 | 0.47mi |
| 1138 Revell Ave Rockford, IL | 2.0 | 1.0 | 900 | $800 | $0.89 | 45d | 1 | 0.54mi |
| 226 S Main St Rockford, IL | 1.0 | 1.0 | 1066 | $1,560 | $1.46 | 15d | 3 | 0.61mi |
| 1121 N Church St Rockford, IL | 2.0 | 1.0 | 900 | $1,200 | $1.33 | 22d | 1 | 0.63mi |
| 1405 N Court St Unit 1407 Rockford, IL | 2.0 | 1.0 | 1530 | $1,100 | $0.72 | 45d | 1 | 0.94mi |
| 2422 Benderwirt Ave Unit 2422-1 Rockford, IL | 2.0 | 1.0 | 1150 | $1,025 | $0.89 | 45d | 1 | 1.08mi |
| 1119 9th Ave Unit 1W Rockford, IL | 3.0 | 1.0 | 1155 | $1,600 | $1.39 | 45d | 1 | 1.19mi |
| 1832 N Main St Rockford, IL | 2.0–3.0 | 1.0–2.0 | 872 | $999 | $1.14 | 15d | 1 | 1.26mi |
| 1229 S Church St Unit 2 Rockford, IL | 3.0 | 1.0 | 1096 | $1,300 | $1.19 | 45d | 1 | 1.31mi |
| 2021 2nd Ave Rockford, IL | 2.0 | 1.0 | 1250 | $1,000 | $0.80 | 15d | 1 | 1.33mi |
| 1221 S Court St Rockford, IL | 2.0 | 1.0 | 1170 | $1,350 | $1.15 | 45d | 1 | 1.34mi |
| 1614 Pauline Ave Rockford, IL | 2.0 | 1.0 | 956 | $1,400 | $1.46 | 45d | 1 | 1.38mi |
| 418 Orchard Park Rockford, IL | 3.0 | 1.0 | 1232 | $1,500 | $1.22 | 15d | 1 | 1.47mi |
Listing history 21 events
-
2026-06-21days on market $115,000 Active 91 DOM
-
2026-06-19days on market $115,000 Active 89 DOM
-
2026-06-18days on market $115,000 Active 88 DOM
-
2026-06-17days on market $115,000 Active 87 DOM
-
2026-06-16days on market $115,000 Active 86 DOM
-
2026-06-15days on market $115,000 Active 85 DOM
-
2026-06-14days on market $115,000 Active 83 DOM
-
2026-06-13days on market $115,000 Active 82 DOM
-
2026-06-10days on market $115,000 Active 80 DOM
-
2026-06-09days on market $115,000 Active 79 DOM
-
2026-06-08days on market $115,000 Active 78 DOM
-
2026-06-07days on market $115,000 Active 77 DOM
-
2026-06-03status $115,000 Active 73 DOM
-
2026-05-19status Pending 754-char remark
Show marketing remark (754 chars)
Check out this adorable home located just seconds from the Rock River and many popular Rockford shops and restaurants. The main floor features two bedrooms, one full bathroom, a kitchen, living room, and a finished front porch that adds extra living space. The basement offers an additional finished living area, along with a half bathroom and plenty of storage. A one-car garage is accessible from the alley behind the home. The property is currently rented on a month-to-month basis for $900 per month, making it a great investment opportunity. It could also serve as a low-maintenance primary residence. Recent improvements include a new roof (2019), furnace (2024), air conditioning system (2025), and hot water heater (2019). "Agent Owned"
-
2026-05-13price $115,000 754-char remark
Show marketing remark (754 chars)
Check out this adorable home located just seconds from the Rock River and many popular Rockford shops and restaurants. The main floor features two bedrooms, one full bathroom, a kitchen, living room, and a finished front porch that adds extra living space. The basement offers an additional finished living area, along with a half bathroom and plenty of storage. A one-car garage is accessible from the alley behind the home. The property is currently rented on a month-to-month basis for $900 per month, making it a great investment opportunity. It could also serve as a low-maintenance primary residence. Recent improvements include a new roof (2019), furnace (2024), air conditioning system (2025), and hot water heater (2019). "Agent Owned"
-
2026-04-25price $122,000 754-char remark
Show marketing remark (754 chars)
Check out this adorable home located just seconds from the Rock River and many popular Rockford shops and restaurants. The main floor features two bedrooms, one full bathroom, a kitchen, living room, and a finished front porch that adds extra living space. The basement offers an additional finished living area, along with a half bathroom and plenty of storage. A one-car garage is accessible from the alley behind the home. The property is currently rented on a month-to-month basis for $900 per month, making it a great investment opportunity. It could also serve as a low-maintenance primary residence. Recent improvements include a new roof (2019), furnace (2024), air conditioning system (2025), and hot water heater (2019). "Agent Owned"
-
2026-04-02price $125,000 754-char remark
Show marketing remark (754 chars)
Check out this adorable home located just seconds from the Rock River and many popular Rockford shops and restaurants. The main floor features two bedrooms, one full bathroom, a kitchen, living room, and a finished front porch that adds extra living space. The basement offers an additional finished living area, along with a half bathroom and plenty of storage. A one-car garage is accessible from the alley behind the home. The property is currently rented on a month-to-month basis for $900 per month, making it a great investment opportunity. It could also serve as a low-maintenance primary residence. Recent improvements include a new roof (2019), furnace (2024), air conditioning system (2025), and hot water heater (2019). "Agent Owned"
-
2026-03-06$128,000 Active 754-char remark
Show marketing remark (754 chars)
Check out this adorable home located just seconds from the Rock River and many popular Rockford shops and restaurants. The main floor features two bedrooms, one full bathroom, a kitchen, living room, and a finished front porch that adds extra living space. The basement offers an additional finished living area, along with a half bathroom and plenty of storage. A one-car garage is accessible from the alley behind the home. The property is currently rented on a month-to-month basis for $900 per month, making it a great investment opportunity. It could also serve as a low-maintenance primary residence. Recent improvements include a new roof (2019), furnace (2024), air conditioning system (2025), and hot water heater (2019). "Agent Owned"
-
2021-08-04soldstatus $60,000
-
2001-02-28soldstatus $54,000
-
1989-03-03soldstatus $24,000
ⓘ Source: listings_history table (triggers on properties + properties_extension) + one-shot
backfill from property_details.listing_events for pre-trigger history.
Tax reassessment forecast IL · Partial reset (capped growth)
- Current annual tax
- $1,269 · $106/mo
- Projected year-2 tax
- $1,940 · $162/mo
- Expected delta
- +$671/yr (+$56/mo · 52.9%)
ⓘ Screening estimate from a state-policy table — verify with the county assessor before closing.
Climate risk First Street
- Flood 2/10 Low FEMA zone X (unshaded) · 9% chance over 30 yrs
- Wildfire 1/10 Low
- Heat 2/10 Low 7 d/yr ≥101°F today · 15 d/yr by 30 yrs out
- Wind 2/10 Low
- Air quality 2/10 Low 1 unhealthy d/yr today · 2 by 30 yrs out
Nearby sold comps map
Loading sold comps map…
Walkable amenities ~0.75 mi
Loading nearby amenities…
Taxation est. · year 1
- Rental income
- $15,558
- − Mortgage interest
- −$6,442
- − Property taxes
- −$1,269
- − Insurance
- −$575
- − Repairs & maintenance
- −$1,245
- − Management
- −$1,245
- − Depreciation
- −$3,345
- Taxable income
- $1,437
- Est. tax owed @ 24.0%
- −$345
- After-tax cash flow
- $2,865/yr
For passive investors: Depreciation is non-cash, so a rental often shows a tax loss while cash-flowing — sheltering income. Rental losses are passive: they offset passive income freely, and up to $25,000/yr can offset ordinary (W-2) income if you actively participate and your MAGI is under $100k (phasing out to $0 by $150k); unused losses carry forward. On sale, claimed depreciation is recaptured at up to 25%, and gains may owe capital-gains tax (a 1031 exchange can defer both). Figures are a year-1 estimate at your 24.0% rate — not tax advice; consult a CPA.
Schools (NCES district)
- District
- Rockford SD 205
- NCES district ID
- 1734510
- Math proficiency
- 12% ▼ -2.00%
- Reading proficiency
- 16% ▼ -3.00%
- Median HH income
- $42,533
- Composite
- 12.21/100
- National rank
- #9649
- State rank
- #533 of 620 in IL
Livability — Rockford
- Score
- 62/100
- State rank
- #876
- US rank
- #17035
Category grades
Schools grade is shown separately in the Schools card above.
Census & demographics
- Census place
- Rockford, IL
- County
- Winnebago County · 147,297 people
- City population
- 147,297
- Metro
- Rockford, IL
- Population (ZIP)
- 30,765
- Household income
- $78,574
- Rent vs Own
- Severe rent burden
- 981.0
Population outlook (Winnebago County) Hauer SSP2
- Today (2025)
- 271,080 people
- By 2030
- 260,684 · -3.8%
- By 2040
- 238,405 · -12.1%
- By 2050
- 216,129 · -20.3%
- By 2075
- 172,882 · -36.2%
- By 2100
- 135,336 · -50.1%
Race, ethnicity, and origin ACS 2023
- Neighborhood character
- Predominantly White (68%)
- Race & ethnicity
- White 68% Hispanic / Latino 15% Black 9% Two or more races 9% Asian 4% Native American 1%
- Hispanic origin (detail)
- Mexican 11% Puerto Rican 1%
- Common ancestry
- Romanian 6% Portuguese 4% Lithuanian 2%
- Foreign-born
- 10% · Canada, China
- Languages at home
- 83% English-only · Spanish 11% Arabic 1% Other Indo-European 1%
Political lean MEDSL · Winnebago
- 2024 margin
- Toss-up / Even · D 49.5% · R 49.0% · Other 1.5%
- 2008→2024 swing
- -12.2pp toward R · 2008: 12.8pp · 2024: 0.6pp
- All cycles
- 2024: D+0.6 2020: D+2.5 2016: R+1.2 2012: D+5.7 2008: D+12.8
Not yet ingested
- Civics
- —
Market trends
- HPI YoY
- ▼ -62.46%
- Current HPI
- 248.8598
- Rent YoY
- ▲ 5.92%
- Metro
- Rockford, IL
- State GDP YoY
- ▲ 1.59%
- F500 in state
- 60
Industry mix (Fortune 500 HQ in IL)
| Industry | F500 HQs | Revenue |
|---|---|---|
| Insurance | 4 | $201B |
|
||
| Consumer Goods | 4 | $87B |
|
||
| Industrial Machinery | 3 | $64B |
|
||
| Healthcare | 2 | $55B |
|
||
| Retail / Pharmacy | 1 | $148B |
|
||
| Agriculture / Food | 1 | $86B |
|
||
Price history
+379.2% since first listed8 events — show timeline
- 2026-05-19 Pending — NWIAR
- 2026-05-13 Price Changed $115,000 NWIAR
- 2026-04-25 Price Changed $122,000 NWIAR
- 2026-04-02 Price Changed $125,000 NWIAR
- 2026-03-06 Listed $128,000 NWIAR
- 2021-08-04 Sold (Public Records) $60,000 Public Records
- 2001-02-28 Sold (Public Records) $54,000 Public Records
- 1989-03-03 Sold (Public Records) $24,000 Public Records
Property tax history
-2.8%/yrLatest (2024): $1,269 · +10.1% YoY. Source: county tax records.
Cash-flow waterfall
monthlySold comps — $/sqft
last 12 mo · ≤1 miLoading sold comps…