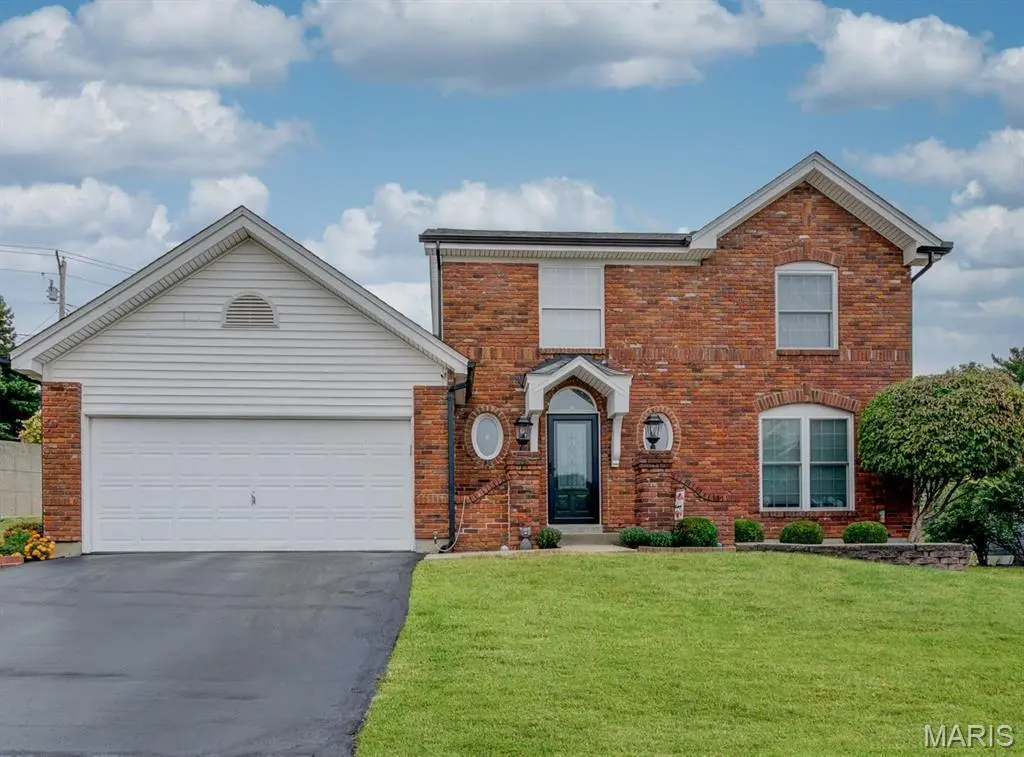
2136 Riding Spur Dr · Maryland Heights, MO
Flood risk 1/10 · Minimal
- FEMA flood zone
- X (unshaded)
- Chance of flooding over 30 yrs
- 0.0%
- Est. flood insurance / yr
- $473 – $860
Fire risk 1/10 · Minimal
- Est. fire insurance / yr
- $1,054 – $1,958
Heat risk 4/10 · Minor
- Hot days now (above 106°F)
- 7 days/yr
- Hot days in 30 yrs
- 21 days/yr
Wind risk 2/10 · Minimal
- Chance of severe wind over 30 yrs
- 1.0%
Air-quality risk 2/10 · Minimal
- Unhealthy air days now
- 2 days/yr
- Unhealthy air days in 30 yrs
- 2 days/yr
Risk factors via First Street. Map © Google.
Why this score? — see what drove the D grade
The composite is a weighted blend of 9 inputs, each scored 0–100. Each bar is that input's sub-score; the figure is the points it added to the 100-point composite (weight × sub-score).
- ARV discount +11.6/15.0
- Appreciation +10.0/10.0
- Cash flow +5.2/30.0
- Schools +5.1/10.0
- Livability +3.6/5.0
- Condition / age +2.5/5.0
- Rent growth +1.8/5.0
- 1% rule +0.5/10.0
- DSCR +0.0/10.0
$395,000
🖨 Deal sheet 📄 Offer letter ✓ Due diligence
Listing remarks
Gracious 1.5-story home in the highly rated Parkway School District offering 2,602 finished sq. ft. , 4 baths and an ideal floor plan! The main-level primary suite features a luxury bath and walk-in closet, while the welcoming upper level includes two extra bedrooms, full bath and versatile loft space. Enjoy main-floor laundry and an open vaulted layout highlighted by an impressive two-story great room filled with streaming natural light, gas fireplace and granite-topped bar area. Expansive kitchen and breakfast room with abundant cabinets, granite counters, center island and bay window with French door. Move-in ready with neutral decor, gleaming wood floors, striking wood staircase, closet
Key facts
- Expansive kitchen
- Two-story great room
- Finished lower level
Tags
Property features AI
Finance
- Other: Living area information available from public records (total living area recorded); Directions: Marine Ave to Marine Terrace Dr, Rt on Riding Spur Dr; or Marine Ave to Polo Parc Dr, Left on Riding Spur Dr
- HOA & community: Polo Parc HOA with annual fee of $500 covering common area maintenance; Association management
Exterior
- Parking: Attached, covered garage facing front; 2-car garage (approximately 20 x 20) — 2 parking spaces total
- Security: Smoke detector(s)
- Utilities: Public water; Public sewer; Ameren electric service; Electricity connected; Natural gas connected; Water available
- Home design: Single-family residence; Private ownership; Updated/remodeled condition; One and one-half levels; House structure
- Construction: Brick and frame construction; Architectural shingle roof; Concrete perimeter foundation; Basement present (partially finished)
- Exterior features: Front porch; Patio; Back yard with landscaping and a few trees; Irregular lot; Concrete road frontage on a city street
Interior
- Kitchen: Electric cooktop; Range; Dishwasher; Disposal; Microwave; Refrigerator; Kitchen island
- Bedrooms: 3 bedrooms total, including 1 main-level bedroom and 2 upper-level bedrooms; Loft (upper level); Den (lower level); Office (lower level); Recreation room (lower level)
- Flooring: Carpet; Tile; Wood
- Bathrooms: 3 full bathrooms; 1 half bathroom (main level)
- Heating & cooling: Forced air heating (natural gas); Central electric air conditioning
- Interior features: Granite counters; Kitchen island; Vaulted ceilings; Double-pane windows with screens; Gas log fireplace in the great room; Basement partially finished with storage and an 8'+ poured concrete area; Smoke detector(s)
- Laundry & utility: Washer and dryer included; Main-level laundry
Neighborhood map
What this means for you Summary
Snapshot
- This is a 3-bed/2.5-bath single-family listed at $395k.
Deal economics
- At list price, monthly cash flow is $-888 ($-11k/yr) — negative.
- To cash-flow at today's rent, offer at most $238k (39.7% below list).
- To meet the 1% rule (rent ≥ 1% of price), the offer needs to be $217k (45.0% below list).
- Recommended offer: $217k (45.0% below list) — sets the bar for 1% rule.
Location & tenants
- Location reads 71/100 on livability (#101 in MO) — a middle-class / working-renter tenant base. Strengths: cost of living A+, housing A+, crime A-; Watch: health & safety C-, amenities F, commute F.
- Parkway C-2 (suburban): math 49% / reading 62% proficiency, ranked #18 of 324 in MO (top 6%) — acceptable for families but not a draw, mixed tenant base, ~2y average lease; only 14% free/reduced lunch — higher-income household profile.
- Zoned schools: Mckelvey Primary (234 students, 8% FRL); North High (math 35% / reading 70%, grade C-, #89 of 521 statewide, top 17%, 1,074 students, 34% FRL).
- Market conditions: Rents soft (-3.0%/yr); 170 active listings in the ZIP; 7 comparable units currently listed for rent nearby; rentals leasing fast (median 2d on market — plan ~1-2 weeks tenant-placement turnaround); solid renter incomes; 920 units permitted in St. Louis County in 2024 (250 in 5+ unit buildings).
- This rent runs 31% of the median local income ($85k/yr) — at the standard rent-burdened threshold; future hikes will face affordability resistance.
Forward outlook
- In year one you build about $42k of equity ($3k loan paydown + $40k appreciation (10.0% local appreciation)).
- By year 2, paydown + projected appreciation supports a ~$68k cash-out refi (75% LTV) — recoverable capital for the next deal without selling this one.
Negotiation context
- Only 3 days on market — expect competitive offers; lowballing is unlikely to land.
- Current owner paid $230k; list at $395k implies a 72% gain — meaningful room to come down on a strong offer.
Questions for the listing agent
- What do current leases actually rent for vs. the listed asking? Can we see a recent rent roll and the last 12 months of T-12 income?
- What does the HOA fee cover, when was the last increase, and are there any pending special assessments or reserve-fund shortfalls?
- Is there a deadline driving the sale (1031 exchange, divorce, estate, relocation)? That informs how much negotiation room exists.
- Schools are B-rated — typically a magnet for longer-tenancy family renters. What's the average tenant stay here, and is there a school-zone premium baked into asking?
- The area grade is low — what's the realistic commute time and amenity access for the typical tenant pool here? Any planned neighborhood developments (good or bad) we should know about?
- What's the average days-on-market for RENTAL listings here right now (not sales)? A rising rental-DOM trend means longer vacancies and softer asking-rent achievability than the comps imply.
- What's the recent tenant-quality profile in this submarket — average credit score on applications, eviction rate, late-payment / NSF rate, and stable-employment percentage? A property-management company in the area should have these aggregated.
- How much new for-sale + rental construction is in the pipeline within 1–3 miles? Heavy new supply typically softens prices + rents 12–24 months out; constrained supply supports both.
Investment metrics
- 1% rule
- 0.55% ✗
- Cap rate
- 3.60%
- Cash-on-cash
- -9.63%
- DSCR
- 0.57
- GRM
- 15.2
CMA / ARV
- ARV (median comp)
- $434,139
- List price
- $395,000
- Delta
- -9.02%
- Verdict
- FAIR
- Comps
- 20 within 1.0 mi
Show comp detail 12 sales within ~0.75 mi
| Address | Dist | Beds/Ba | Sqft | Sold | Price | $/sf | Match |
|---|---|---|---|---|---|---|---|
| 12935 Polo Parc Dr | 0.09mi | 3/2.5 | 1,836 (-2%) | 10mo | $425,000 | $231 | 84 |
| 2132 Riding Spur Dr | 0.01mi | 4/3.0 (+1) | 1,751 (-7%) | 13mo | $325,000 | $186 | 71 |
| 12833 Polo Parc Dr | 0.14mi | 4/3.5 (+1) | 2,055 (+10%) | 10mo | $449,500 | $219 | 60 |
| 1431 Glenlea Dr | 0.58mi | 3/2.0 | 1,868 (-0%) | 13mo | $295,000 | $158 | 60 |
| 12853 Glenbernie Ln | 0.36mi | 3/2.0 | 1,649 (-12%) | 5mo | $295,000 | $179 | 57 |
| 12725 Bennington Common Ln | 0.66mi | 3/2.5 | 2,055 (+10%) | 1mo | $299,900 | $146 | 53 |
| 12792 Bennington Common Ln | 0.66mi | 3/3.0 | 1,720 (-8%) | 1mo | $265,000 | $154 | 52 |
| 1433 Glenlea Dr | 0.58mi | 3/2.0 | 1,605 (-14%) | 1mo | $335,000 | $209 | 46 |
| 1834 Chelmsford Ct | 0.69mi | 4/3.0 (+1) | 2,000 (+7%) | 7mo | $359,900 | $180 | 44 |
| 12712 Glenette Dr | 0.68mi | 3/2.0 | 1,708 (-9%) | 12mo | $335,000 | $196 | 42 |
| 1956 Lakehurst Dr | 0.60mi | 4/2.5 (+1) | 2,120 (+13%) | 5mo | $464,900 | $219 | 41 |
| 1923 Springtree Dr | 0.70mi | 3/3.0 | 2,040 (+9%) | 14mo | $389,900 | $191 | 39 |
Match score weights: distance 35% · size 25% · config 20% · recency 20%. Top-matched comps best support the ARV.
Projected returns pro-forma
10.0% appreciation · 0.0% rent growth · sell at horizon
- IRR
- 16.9%
- Equity multiple
- 2.38×
- Total profit
- $152,178
- Equity at exit
- $355,847
- IRR
- 15.6%
- Equity multiple
- 5.35×
- Total profit
- $481,114
- Equity at exit
- $767,398
Cash invested: $110,600 (down + closing). Projections, not guarantees.
Landlord ↔ Tenant lean methodology
- Overall (STATE)
- 81 Strongly Landlord-Friendly
- State Missouri
- 81 Strongly Landlord-Friendly · R+10
- County
- — inherits STATE
- City
- — inherits STATE
ZIP-level market 63146
- Home prices YoY
- 4.9%
- Rents YoY
- -3.0%
- Active inventory
- 170
- Price-to-rent
- 15.2×
Monthly cashflow live
- Estimated rent
- $2,172 high interval (Pro) →
- Mortgage (P&I)
- −$2,071
- Tax from tax record
- −$326 /mo · $3,908/yr
- Insurance
- −$165
- HOA
- −$42
- Vacancy / Maint / Mgmt
- −$456
- Net cashflow
- $-888
Break-even live
UW: 25.0% down · 7.5% · 30yr · 1.5% tax · 5.0% vac · 8.0% maint · 8.0% mgmt
Financing live
Cash to close
- Down payment
- $98,750
- Closing costs
- $11,850
- Reserves months
- —
- Total cash needed
- —
Loan-product check · same deal, 3 products live
Conventional
25% down · 7.5% · 30yr
- Down + closing
- —
- Monthly P&I
- —
- Monthly cashflow
- —
- DSCR
- —
- Eligible?
- —
Personal DTI + credit; lowest rate.
DSCR
20% down · 8.5% · 30yr
- Down + closing
- —
- Monthly P&I
- —
- Monthly cashflow
- —
- DSCR
- —
- Eligible?
- —
No personal income docs; deal must DSCR.
Hard money
10% down · 12.0% · 12mo
- Down + closing
- —
- Monthly P&I
- —
- Monthly cashflow
- —
- DSCR
- —
- Eligible?
- —
Short-term bridge; refi at stabilization.
Rent comps 7 comps
| Address | Beds | Baths | Sqft | Rent | $/sqft | DOM | Units | Dist |
|---|---|---|---|---|---|---|---|---|
| 2050 Lakerun Ct Maryland Heights, MO | 1.0–3.0 | 1.0–2.5 | 1213 | $2,180 | $1.80 | 2d | 15 | 0.70mi |
| 1951 Oberlin Dr St. Louis, MO | 1.0–3.0 | 1.0–2.5 | 993 | $2,128 | $2.14 | 2d | 23 | 0.71mi |
| 12806 Willowyck Dr Saint Louis, MO | 3.0 | 2.0 | 1456 | $2,500 | $1.72 | 44d | 1 | 0.77mi |
| 1895 Boulder Springs Dr St. Louis, MO | 1.0–3.0 | 1.0–2.5 | 1083 | $2,900 | $2.68 | 2d | 6 | 1.13mi |
| 12401 Boulder Springs Pkwy St. Louis, MO | 1.0–3.0 | 1.0–2.0 | 1006 | $2,867 | $2.85 | 2d | 10 | 1.20mi |
| 12082 Foxpoint Dr Maryland Heights, MO | 3.0 | 3.0 | 1934 | $2,591 | $1.34 | 2d | 1 | 1.23mi |
| 2302 Canyonlands Dr Unit E Maryland Heights, MO | 3.0 | 2.0 | 1442 | $1,800 | $1.25 | 44d | 1 | 1.24mi |
HOA detail
- Monthly dues
- $42 · $504/yr
- Likely covers
- gas
Listing history 6 events
-
2026-05-17status Pending 1607-char remark
-
2026-05-13$395,000 Active 1607-char remark
-
2001-09-04soldstatus $229,900
-
1994-10-31soldstatus $150,000
-
1990-05-01soldstatus $143,500
-
1988-11-01soldstatus $153,280
ⓘ Source: listings_history table (triggers on properties + properties_extension) + one-shot
backfill from property_details.listing_events for pre-trigger history.
Tax reassessment forecast MO · Resets to sale price
- Current annual tax
- $3,908 · $326/mo
- Projected year-2 tax
- $3,908 · $326/mo
- Expected delta
- $0/yr ($0/mo · -0.0%)
ⓘ Screening estimate from a state-policy table — verify with the county assessor before closing.
Climate risk First Street
- Flood 1/10 Low FEMA zone X (unshaded) · 0% chance over 30 yrs
- Wildfire 1/10 Low
- Heat 4/10 Moderate 7 d/yr ≥106°F today · 21 d/yr by 30 yrs out
- Wind 2/10 Low 100% chance of damaging wind over 30 yrs
- Air quality 2/10 Low 2 unhealthy d/yr today · 2 by 30 yrs out
Nearby sold comps map
Loading sold comps map…
Walkable amenities ~0.75 mi
Loading nearby amenities…
Taxation est. · year 1
- Rental income
- $26,066
- − Mortgage interest
- −$22,126
- − Property taxes
- −$3,908
- − Insurance
- −$1,975
- − Repairs & maintenance
- −$2,085
- − Management
- −$2,085
- − HOA
- −$504
- − Depreciation
- −$11,491
- Taxable loss
- −$18,109
- Est. tax savings @ 24.0%
- +$4,346
- After-tax cash flow
- $-6,306/yr
For passive investors: Depreciation is non-cash, so a rental often shows a tax loss while cash-flowing — sheltering income. Rental losses are passive: they offset passive income freely, and up to $25,000/yr can offset ordinary (W-2) income if you actively participate and your MAGI is under $100k (phasing out to $0 by $150k); unused losses carry forward. On sale, claimed depreciation is recaptured at up to 25%, and gains may owe capital-gains tax (a 1031 exchange can defer both). Figures are a year-1 estimate at your 24.0% rate — not tax advice; consult a CPA.
Schools (NCES district)
- District
- Parkway C-2
- NCES district ID
- 2923580
- Math proficiency
- 49% ▼ -11.00%
- Reading proficiency
- 62% ▼ -2.00%
- Median HH income
- $83,551
- Composite
- 50.5/100
- National rank
- #1851
- State rank
- #18 of 324 in MO
Livability — Maryland Heights
- Score
- 71/100
- State rank
- #101
- US rank
- #6808
Category grades
Schools grade is shown separately in the Schools card above.
Census & demographics
- Census place
- Maryland Heights, MO
- County
- Saint Louis County · 888,823 people
- City population
- 21,924
- Metro
- St. Louis, MO-IL
- Population (ZIP)
- 30,678
- Household income
- $84,756
- Rent vs Own
- Severe rent burden
- 1156.0
Population outlook (St. Louis County) Hauer SSP2
- Today (2025)
- 1,025,227 people
- By 2030
- 1,028,023 · +0.3%
- By 2040
- 1,020,940 · -0.4%
- By 2050
- 1,007,280 · -1.8%
- By 2075
- 987,277 · -3.7%
- By 2100
- 921,984 · -10.1%
Race, ethnicity, and origin ACS 2023
- Neighborhood character
- Diverse neighborhood (Simpson 0.56)
- Race & ethnicity
- White 63% Asian 17% Black 13% Two or more races 4% Hispanic / Latino 3%
- Common ancestry
- Scotch-Irish 3% Romanian 3% Italian 2%
- Foreign-born
- 19% · China, South Korea, Canada
- Languages at home
- 79% English-only · Other Asian/Pacific 7% Other Indo-European 4% Chinese 3%
Political lean MEDSL · St. Louis
- 2024 margin
- Strong D (+23.4) · D 60.8% · R 37.4% · Other 1.7%
- 2008→2024 swing
- +3.5pp toward D · 2008: 19.9pp · 2024: 23.4pp
- All cycles
- 2024: D+23.4 2020: D+24.0 2016: D+16.2 2012: D+13.7 2008: D+19.9
Not yet ingested
- Civics
- —
Market trends
- HPI YoY
- ▲ 33.10%
- Current HPI
- 711.49
- Rent YoY
- ▼ -2.96%
- Metro
- St. Louis, MO-IL
- State GDP YoY
- ▲ 1.84%
- F500 in state
- 20
Industry mix (Fortune 500 HQ in MO)
| Industry | F500 HQs | Revenue |
|---|---|---|
| Healthcare | 1 | $163B |
|
||
| Insurance | 1 | $21B |
|
||
| Industrial Technology | 1 | $17B |
|
||
| Retail | 1 | $16B |
|
||
| Industrial Distribution | 1 | $10B |
|
||
| Utilities | 1 | $9B |
|
||
Price history
+157.7% since first listed7 events — show timeline
- 2026-06-15 Sold (MLS) — MARIS as Distributed by MLS Grid
- 2026-05-17 Pending — MARIS as Distributed by MLS Grid
- 2026-05-13 Listed $395,000 MARIS as Distributed by MLS Grid
- 2001-09-04 Sold (Public Records) $229,900 Public Records
- 1994-10-31 Sold (Public Records) $150,000 Public Records
- 1990-05-01 Sold (Public Records) $143,500 Public Records
- 1988-11-01 Sold (Public Records) $153,280 Public Records
Property tax history
+2.3%/yrLatest (2022): $3,908 · -1.0% YoY. Source: county tax records.
Cash-flow waterfall
monthlySold comps — $/sqft
last 12 mo · ≤1 miLoading sold comps…