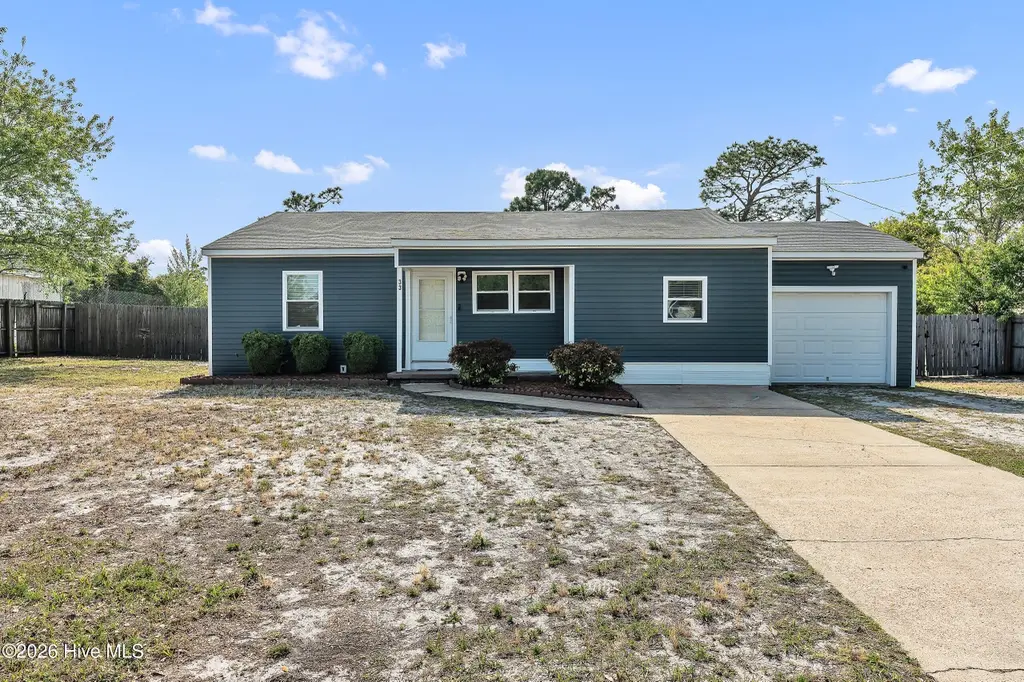
33 Riegel Dr · Swansboro, NC
Flood risk 1/10 · Minimal
- FEMA flood zone
- X (unshaded)
- Chance of flooding over 30 yrs
- 0.0%
- Est. flood insurance / yr
- $507 – $1,088
Fire risk 6/10 · Moderate
- Est. fire insurance / yr
- $906 – $1,684
Heat risk 9/10 · Severe
- Hot days now (above 105°F)
- 7 days/yr
- Hot days in 30 yrs
- 20 days/yr
Wind risk 8/10 · Major
- Chance of severe wind over 30 yrs
- 99.0%
Air-quality risk 2/10 · Minimal
- Unhealthy air days now
- 0 days/yr
- Unhealthy air days in 30 yrs
- 2 days/yr
Risk factors via First Street. Map © Google.
Why this score? — see what drove the D+ grade
The composite is a weighted blend of 9 inputs, each scored 0–100. Each bar is that input's sub-score; the figure is the points it added to the 100-point composite (weight × sub-score).
- ARV discount +14.4/15.0
- Cash flow +13.4/30.0
- DSCR +4.0/10.0
- Schools +3.9/10.0
- Livability +3.9/5.0
- Rent growth +3.2/5.0
- Condition / age +2.5/5.0
- 1% rule +2.4/10.0
- Appreciation +0.0/10.0
$230,000
🖨 Deal sheet (PDF) 📄 Offer letter ✓ Due diligence
Listing remarks
Discover this adorable and move-in-ready 3-bedroom, 2-bathroom home nestled in the heart of Hubert, where coastal charm meets everyday convenience. This like-new gem has been thoughtfully updated and is ready to impress from the moment you arrive. Inside, you'll find three sizable bedrooms offering plenty of space, along with a dedicated office perfect for remote work or quiet study. The updated kitchen is a true highlight, featuring modern finishes that make cooking and entertaining a genuine pleasure. Beautiful flooring flows seamlessly throughout the home, complemented by tons of natural lighting that fills every room with warmth and energy. Fresh interior paint throughout gives the enti
Key facts
- Large back deck
- Covered patio
- Updated kitchen
Tags
Property features AI
Exterior
- Parking: Attached 2-car garage; 2 parking spaces total
- Utilities: Water connected
- Home design: Single-family residence; One story; Entry level: 1
- Construction: Vinyl siding and frame construction; Shingle roof; Slab foundation; Built on a 0.36-acre lot (approx. 100 x 160 x 100 x 160)
- Exterior features: Covered patio/porch; Deck; Patio; Wood fencing; Has view; Paved road access
Interior
- Bathrooms: 2 full bathrooms
- Heating & cooling: Central air conditioning; Electric heating; Heat pump
- Interior features: Ceiling fan(s); 6 total rooms
Neighborhood map
What this means for you Summary
Snapshot
- This is a 3-bed/1.0-bath single-family listed at $230k.
Deal economics
- At list price, monthly cash flow is $4 ($45/yr) — positive.
- The deal already cash-flows at list — no discount required.
- To meet the 1% rule (rent ≥ 1% of price), the offer needs to be $171k (25.6% below list).
- Recommended offer: $171k (25.6% below list) — sets the bar for 1% rule.
- Cap rate 6.3% vs local median 3.5% in Swansboro — top-decile yield for the area; either an underpriced asset or a hidden risk that comps aren't pricing in. Stress-test before assuming the spread holds.
Location & tenants
- Location reads 77/100 on livability (#32 in NC, #3,124 nationally) — a middle-class / working-renter tenant base. Strengths: housing A+, health & safety A+, crime A; Watch: amenities F, commute F.
- Onslow County Schools (other): math 42% / reading 49% proficiency, ranked #84 of 178 in NC (top 47%) — families likely to look elsewhere, expect single-tenant / working-renter base with shorter leases.
- Zoned schools: Sand Ridge Elementary (math 57% / reading 54%, grade C, #293 of 1,410 statewide, top 21%, 581 students, 58% FRL); Swansboro Middle (math 52% / reading 55%, grade C+, #87 of 475 statewide, top 19%, 967 students, 43% FRL); Swansboro High (math 77% / reading 68%, grade B+, #104 of 535 statewide, top 19%, 1,115 students, 38% FRL).
- Zoned-school proficiency averages 60% at this address vs 46% district-wide (+15 pts) — the actual schools serving this property are materially stronger than the Onslow County Schools average implies; a family-tenant draw the district grade alone would hide.
- Market conditions: Rents rising (+2.6%/yr); 322 active listings in the ZIP; 7 comparable units currently listed for rent nearby; rentals at typical pace (median 22d on market — plan ~3-4 weeks tenant-placement turnaround); 1,246 units permitted in Onslow County in 2024 (0 in 5+ unit buildings).
- This rent runs 31% of the median local income ($67k/yr) — at the standard rent-burdened threshold; future hikes will face affordability resistance.
Forward outlook
- Local home prices are declining (-3.0%/yr); year-one equity from $2k of loan paydown is wiped out by about $7k of value loss. Plan a longer hold.
Negotiation context
- It's been on market 64 days — a 6% lower offer ($216k) is reasonable based on typical stale-listing flexibility.
- Current owner paid $32k; list at $230k implies a 630% gain — meaningful room to come down on a strong offer.
Risks & watch-outs
- Climate carrying-cost: severe wind risk, 99% chance of damaging wind over 30y; major wildfire risk; extreme-heat days projected 7→20/yr by 2055 (HVAC capex compounding) — expect insurance premiums to compound above CPI over the hold.
Questions for the listing agent
- It's been on market 64 days. Have you received any prior offers? Is the seller open to a 26% concession, seller financing, or rate buy-down credit?
- Built in 1968 — when were the roof, HVAC, electrical panel, plumbing, and water heater last replaced?
- Why hasn't it sold? Are there any deal-killer items the seller is aware of (foundation, flood, title, zoning, code violations)?
- Is there a deadline driving the sale (1031 exchange, divorce, estate, relocation)? That informs how much negotiation room exists.
- The area grade is low — what's the realistic commute time and amenity access for the typical tenant pool here? Any planned neighborhood developments (good or bad) we should know about?
- What's the average days-on-market for RENTAL listings here right now (not sales)? A rising rental-DOM trend means longer vacancies and softer asking-rent achievability than the comps imply.
- What's the recent tenant-quality profile in this submarket — average credit score on applications, eviction rate, late-payment / NSF rate, and stable-employment percentage? A property-management company in the area should have these aggregated.
- How much new for-sale + rental construction is in the pipeline within 1–3 miles? Heavy new supply typically softens prices + rents 12–24 months out; constrained supply supports both.
Investment metrics
- 1% rule
- 0.74% ✗
- Cap rate
- 6.31%
- Cash-on-cash
- 0.07%
- DSCR
- 1.00
- GRM
- 11.2
CMA / ARV
- ARV (on-the-fly)
- $271,488
- Comps found
- 12
Show comp detail 12 sales within ~0.75 mi
| Address | Dist | Beds/Ba | Sqft | Sold | Price | $/sf | Match |
|---|---|---|---|---|---|---|---|
| 608 Calabash Dr | 0.47mi | 3/2.0 | 1,182 (-2%) | 1mo | $249,000 | $211 | 69 |
| 223 Lockwood Ct | 0.34mi | 3/2.0 | 1,291 (+6%) | 1mo | $278,000 | $215 | 68 |
| 205 Michel Ct | 0.60mi | 3/2.0 | 1,228 (+1%) | 1mo | $265,000 | $216 | 65 |
| 314 Dayrell Dr | 0.32mi | 3/2.0 | 1,351 (+12%) | 1mo | $275,000 | $204 | 61 |
| 104 Crown Point Rd | 0.37mi | 3/2.0 | 1,089 (-10%) | 2mo | $207,500 | $191 | 60 |
| 503 Amber Ave | 0.75mi | 3/2.0 | 1,201 (-1%) | 1mo | $275,000 | $229 | 59 |
| 601 Cannon Ct | 0.74mi | 3/2.0 | 1,184 (-2%) | 2mo | $257,000 | $217 | 56 |
| 201 Michel Ct | 0.63mi | 3/2.0 | 1,103 (-9%) | 0mo | $247,000 | $224 | 51 |
| 405 Hooks Ln | 0.45mi | 3/2.0 | 1,052 (-13%) | 2mo | $236,500 | $225 | 51 |
| 142 Parnell Rd | 0.51mi | 3/2.0 | 1,050 (-13%) | 2mo | $235,000 | $224 | 48 |
| 183 Parnell Rd | 0.53mi | 3/2.0 | 1,040 (-14%) | 2mo | $269,500 | $259 | 46 |
| 127 Glenwood Dr | 0.71mi | 3/2.0 | 1,051 (-13%) | 1mo | $250,000 | $238 | 40 |
Match score weights: distance 35% · size 25% · config 20% · recency 20%. Top-matched comps best support the ARV.
Projected returns pro-forma
-3.0% appreciation · 2.61% rent growth · sell at horizon
- IRR
- -16.6%
- Equity multiple
- 0.41×
- Total profit
- $-37,821
- Equity at exit
- $34,294
- IRR
- -9.2%
- Equity multiple
- 0.44×
- Total profit
- $-35,845
- Equity at exit
- $19,886
Cash invested: $64,400 (down + closing). Projections, not guarantees.
Landlord ↔ Tenant lean methodology
- Overall (STATE)
- 85 Strongly Landlord-Friendly
- State North Carolina
- 85 Strongly Landlord-Friendly · R+3
- County
- — inherits STATE
- City
- — inherits STATE
ZIP-level market 28539
- Home prices YoY
- -23.9%
- Rents YoY
- 2.6%
- Active inventory
- 322
- Price-to-rent
- 11.2×
Monthly cashflow live
- Estimated rent
- $1,711 high interval (Pro) →
- Mortgage (P&I)
- −$1,206
- Tax from tax record
- −$46 /mo · $552/yr
- Insurance
- −$96
- HOA
- −$0
- Vacancy / Maint / Mgmt
- −$359
- Net cashflow
- $4
Break-even live
Sensitivity live
| Price | -10% $134 | -5% $69 | +0% $4 | +5% $-61 | +10% $-126 |
|---|---|---|---|---|---|
| Rent | -10% $-131 | -5% $-64 | +0% $4 | +5% $71 | +10% $139 |
| Rate | -1.0pp $120 | -0.5pp $62 | base $4 | +0.5pp $-56 | +1.0pp $-116 |
UW: 25.0% down · 7.5% · 30yr · 1.5% tax · 5.0% vac · 8.0% maint · 8.0% mgmt
Financing live
Cash to close
- Down payment
- $57,500
- Closing costs
- $6,900
- Reserves months
- —
- Total cash needed
- —
Loan-product check · same deal, 3 products live
Conventional
25% down · 7.5% · 30yr
- Down + closing
- —
- Monthly P&I
- —
- Monthly cashflow
- —
- DSCR
- —
- Eligible?
- —
Personal DTI + credit; lowest rate.
DSCR
20% down · 8.5% · 30yr
- Down + closing
- —
- Monthly P&I
- —
- Monthly cashflow
- —
- DSCR
- —
- Eligible?
- —
No personal income docs; deal must DSCR.
Hard money
10% down · 12.0% · 12mo
- Down + closing
- —
- Monthly P&I
- —
- Monthly cashflow
- —
- DSCR
- —
- Eligible?
- —
Short-term bridge; refi at stabilization.
Rent comps 7 comps
| Address | Beds | Baths | Sqft | Rent | $/sqft | DOM | Units | Dist |
|---|---|---|---|---|---|---|---|---|
| 21 Crown Point Rd Hubert, NC | 4.0 | 2.5 | 1290 | $1,450 | $1.12 | 21d | 1 | 0.17mi |
| 400 Dayrell Dr Hubert, NC | 3.0 | 2.0 | 1267 | $1,800 | $1.42 | 21d | 1 | 0.30mi |
| 212 W Volant St Hubert, NC | 3.0 | 2.0 | 1223 | $1,750 | $1.43 | 21d | 1 | 0.35mi |
| 309 N Winchester Ln Hubert, NC | 4.0 | 2.0 | 1456 | $1,700 | $1.17 | 21d | 1 | 0.65mi |
| 136 Byrum Run Hubert, NC | 3.0 | 2.0 | 1164 | $1,800 | $1.55 | 21d | 1 | 1.37mi |
| 104 Parrot Landing Dr Hubert, NC | 2.0 | 2.5 | 1300 | $1,650 | $1.27 | 21d | 1 | 1.44mi |
| 104 Parrot Landing Dr Unit 104 Hubert, NC | 2.0 | 2.5 | 1300 | $1,650 | $1.27 | 21d | 1 | 1.44mi |
Listing history 18 events
-
2026-06-19days on market $230,000 Active 64 DOM
-
2026-06-18days on market $230,000 Active 63 DOM
-
2026-06-17days on market $230,000 Active 62 DOM
-
2026-06-16days on market $230,000 Active 61 DOM
-
2026-06-15days on market $230,000 Active 60 DOM
-
2026-06-14days on market $230,000 Active 58 DOM
-
2026-06-13days on market $230,000 Active 57 DOM
-
2026-06-10days on market $230,000 Active 55 DOM
-
2026-06-09days on market $230,000 Active 54 DOM
-
2026-06-09pricedays on market $230,000 Active 53 DOM
-
2026-06-07days on market $240,000 Active 52 DOM
-
2026-06-03days on market $240,000 Active 48 DOM
-
2026-06-02days on market $240,000 Active 47 DOM
-
2026-06-01days on market $240,000 Active 46 DOM
-
2026-05-31days on market $240,000 Active 45 DOM
-
2026-05-30days on market $240,000 Active 44 DOM
-
2026-04-16$240,000 Active
-
1991-08-16soldstatus $31,500
ⓘ Source: listings_history table (triggers on properties + properties_extension) + one-shot
backfill from property_details.listing_events for pre-trigger history.
Tax reassessment forecast NC · Resets to sale price
- Current annual tax
- $552 · $46/mo
- Projected year-2 tax
- $1,886 · $157/mo
- Expected delta
- +$1,334/yr (+$111/mo · 241.4%)
ⓘ Screening estimate from a state-policy table — verify with the county assessor before closing.
Climate risk First Street
- Flood 1/10 Low FEMA zone X (unshaded) · 0% chance over 30 yrs
- Wildfire 6/10 Major
- Heat 9/10 Extreme 7 d/yr ≥105°F today · 20 d/yr by 30 yrs out
- Wind 8/10 Severe 99% chance of damaging wind over 30 yrs
- Air quality 2/10 Low 0 unhealthy d/yr today · 2 by 30 yrs out
Nearby sold comps map
Loading sold comps map…
Walkable amenities ~0.75 mi
Loading nearby amenities…
Taxation est. · year 1
- Rental income
- $20,533
- − Mortgage interest
- −$12,884
- − Property taxes
- −$552
- − Insurance
- −$1,150
- − Repairs & maintenance
- −$1,643
- − Management
- −$1,643
- − Depreciation
- −$6,691
- Taxable loss
- −$4,029
- Est. tax savings @ 24.0%
- +$967
- After-tax cash flow
- $1,012/yr
For passive investors: Depreciation is non-cash, so a rental often shows a tax loss while cash-flowing — sheltering income. Rental losses are passive: they offset passive income freely, and up to $25,000/yr can offset ordinary (W-2) income if you actively participate and your MAGI is under $100k (phasing out to $0 by $150k); unused losses carry forward. On sale, claimed depreciation is recaptured at up to 25%, and gains may owe capital-gains tax (a 1031 exchange can defer both). Figures are a year-1 estimate at your 24.0% rate — not tax advice; consult a CPA.
Schools (NCES district)
- District
- Onslow County Schools
- NCES district ID
- 3703450
- Math proficiency
- 42% ▲ 6.00%
- Reading proficiency
- 49% ▲ 5.00%
- Median HH income
- $46,076
- Composite
- 38.66/100
- National rank
- #4148
- State rank
- #84 of 178 in NC
Livability — Swansboro
- Score
- 77/100
- State rank
- #32
- US rank
- #3124
Category grades
Schools grade is shown separately in the Schools card above.
Census & demographics
- County
- Onslow County · 164,453 people
- Metro
- Jacksonville, NC
- Population (ZIP)
- 18,351
- Household income
- $66,976
- Rent vs Own
- Severe rent burden
- 602.0
Population outlook (Onslow County) Hauer SSP2
- Today (2025)
- 189,789 people
- By 2030
- 194,463 · +2.5%
- By 2040
- 193,629 · +2.0%
- By 2050
- 193,248 · +1.8%
- By 2075
- 196,995 · +3.8%
- By 2100
- 201,513 · +6.2%
Race, ethnicity, and origin ACS 2023
- Neighborhood character
- Predominantly White (82%)
- Race & ethnicity
- White 82% Two or more races 7% Hispanic / Latino 6% Black 6% Asian 1%
- Hispanic origin (detail)
- Mexican 3% Puerto Rican 2%
- Common ancestry
- Slovak 3% Romanian 3% Lithuanian 2%
- Foreign-born
- 3% · Canada
- Languages at home
- 93% English-only · Spanish 3% Other Asian/Pacific 1% Other Indo-European 1%
Political lean MEDSL · Onslow
- 2024 margin
- Solid R (+35.9) · D 31.5% · R 67.5% · Other 1.0%
- 2008→2024 swing
- -14.5pp toward R · 2008: -21.5pp · 2024: -35.9pp
- All cycles
- 2024: R+35.9 2020: R+30.2 2016: R+34.6 2012: R+27.0 2008: R+21.5
Not yet ingested
- Civics
- —
Market trends
- HPI YoY
- ▼ -58.68%
- Current HPI
- 186.871
- Rent YoY
- ▲ 2.61%
- Metro
- Jacksonville, NC
- State GDP YoY
- ▲ 3.28%
- F500 in state
- 26
Industry mix (Fortune 500 HQ in NC)
| Industry | F500 HQs | Revenue |
|---|---|---|
| Financial Services | 2 | $213B |
|
||
| Retail | 2 | $95B |
|
||
| Industrial Conglomerate | 1 | $38B |
|
||
| Metals / Steel | 1 | $35B |
|
||
| Utilities | 1 | $30B |
|
||
| Industrial Machinery | 1 | $19B |
|
||
Price history
+661.9% since first listed2 events — show timeline
- 2026-04-16 Listed $240,000 Hive MLS
- 1991-08-16 Sold (Public Records) $31,500 Public Records
Property tax history
-0.6%/yrLatest (2025): $552 · +0.0% YoY. Source: county tax records.
Cash-flow waterfall
monthlySold comps — $/sqft
last 12 mo · ≤1 miLoading sold comps…