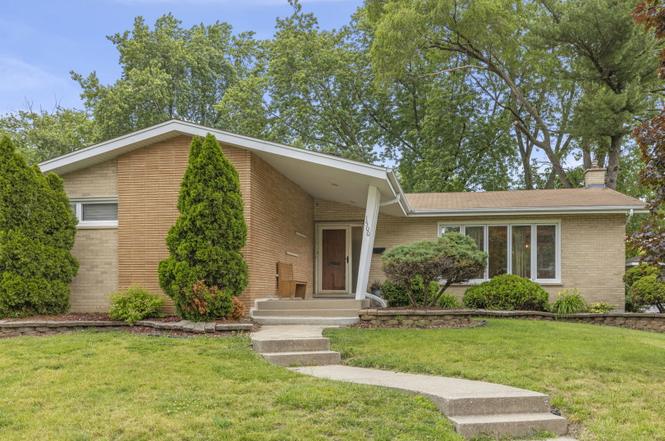
1500 Carson Dr · Homewood, IL
Flood risk No data
- FEMA flood zone
- —
- Chance of flooding over 30 yrs
- —
- Est. flood insurance / yr
- —
Fire risk No data
- Est. fire insurance / yr
- —
Heat risk No data
- Hot days now (above threshold)
- —
- Hot days in 30 yrs
- —
Wind risk No data
- Chance of severe wind over 30 yrs
- —
Air-quality risk No data
- Unhealthy air days now
- —
- Unhealthy air days in 30 yrs
- —
Risk factors via First Street. Map © Google.
Why this score? — see what drove the D- grade
The composite is a weighted blend of 9 inputs, each scored 0–100. Each bar is that input's sub-score; the figure is the points it added to the 100-point composite (weight × sub-score).
- Cash flow +16.3/30.0
- DSCR +5.0/10.0
- 1% rule +4.4/10.0
- Livability +4.0/5.0
- ARV discount +2.5/15.0
- Rent growth +2.5/5.0
- Condition / age +2.5/5.0
- Schools +2.4/10.0
- Appreciation +0.0/10.0
$319,900
🖨 Deal sheet (PDF) 📄 Offer letter ✓ Due diligence
Listing remarks
This updated ranch sits on a quiet street in Homewood, with the kind of easy rhythm you feel the moment you walk through the door. Hardwood floors run through the main living area, where the brightly lit living room opens to a dining room and on to a updated kitchen with stainless steel appliances and granite counters. Three bedrooms share the main level, served by two full baths, a jack and jill between two of the bedrooms and a hall bath with a walk in shower. Downstairs is where the home stretches out. The finished basement nearly doubles the living space, with a wide open family room ready for movie nights, a home gym, or whatever the season calls for. A bonus room works as a guest room
Key facts
- Finished basement
- Updated kitchen
- Granite counters
Tags
Property features AI
Finance
- Other: Fee simple ownership
- HOA & community: No master association fee required
Exterior
- Parking: Owned garage (2.5 garage spaces, 2.5 total parking)
- Home design: Detached single-family home; Single-story
- Construction: Built 61–70 years ago; Built before 1978
Interior
- Bedrooms: 3 bedrooms; Additional room listed as 'Bedroom 4' (possible flexible/bonus room)
- Bathrooms: 2 full bathrooms
- Interior features: Full basement; Dining room; Family room; Living room
- Laundry & utility: Laundry room
Neighborhood map
What this means for you Summary
Snapshot
- This is a 4-bed/2.0-bath single-family listed at $320k.
Deal economics
- At list price, monthly cash flow is $174 ($2k/yr) — positive.
- The deal already cash-flows at list — no discount required.
- To meet the 1% rule (rent ≥ 1% of price), the offer needs to be $302k (5.6% below list).
- Recommended offer: $302k (5.6% below list) — sets the bar for 1% rule.
Location & tenants
- Location reads 81/100 on livability (#81 in IL, #1,314 nationally) — a professional / high-income tenant draw. Strengths: commute A+, employment A+, cost of living A+; Watch: amenities F.
- Homewood Flossmoor Chsd 233 (suburban): math 21% / reading 27% proficiency, ranked #272 of 620 in IL (top 44%) — low school quality limits family demand, transient renter base, plan for 1-2y turnover.
- Zoned schools: Willow School (607 students, 0% FRL); James Hart School (math 22% / reading 37%, grade F, #256 of 665 statewide, top 41%, 711 students, 0% FRL); Homewood-Flossmoor High School (math 21% / reading 27%, grade F, #304 of 693 statewide, top 44%, 2,798 students, 0% FRL).
- Market conditions: 102 active listings in the ZIP; 6 comparable units currently listed for rent nearby; rentals at typical pace (median 24d on market — plan ~3-4 weeks tenant-placement turnaround); 6,272 units permitted in Cook County in 2024 (4,658 in 5+ unit buildings).
Forward outlook
- Local home prices are declining (-3.0%/yr); year-one equity from $2k of loan paydown is wiped out by about $10k of value loss. Plan a longer hold.
Negotiation context
- Only 10 days on market — expect competitive offers; lowballing is unlikely to land.
Questions for the listing agent
- Built in 1964 — when were the roof, HVAC, electrical panel, plumbing, and water heater last replaced?
- Is there a deadline driving the sale (1031 exchange, divorce, estate, relocation)? That informs how much negotiation room exists.
- Schools are D-rated, which usually means shorter tenancies and higher turnover. Who's the typical renter profile here, and what's been the actual vacancy rate?
- The area grade is low — what's the realistic commute time and amenity access for the typical tenant pool here? Any planned neighborhood developments (good or bad) we should know about?
- What's the average days-on-market for RENTAL listings here right now (not sales)? A rising rental-DOM trend means longer vacancies and softer asking-rent achievability than the comps imply.
- What's the recent tenant-quality profile in this submarket — average credit score on applications, eviction rate, late-payment / NSF rate, and stable-employment percentage? A property-management company in the area should have these aggregated.
- How much new for-sale + rental construction is in the pipeline within 1–3 miles? Heavy new supply typically softens prices + rents 12–24 months out; constrained supply supports both.
Investment metrics
- 1% rule
- 0.94% ✗
- Cap rate
- 6.95%
- Cash-on-cash
- 2.33%
- DSCR
- 1.10
- GRM
- 8.8
CMA / ARV
- ARV (on-the-fly)
- $287,936
- Comps found
- 12
Show comp detail 12 sales within ~0.75 mi
| Address | Dist | Beds/Ba | Sqft | Sold | Price | $/sf | Match |
|---|---|---|---|---|---|---|---|
| 18834 Loomis Ave | 0.18mi | 4/2.5 | 1,785 (+9%) | 2mo | $313,500 | $176 | 73 |
| 18823 Ashland Ave | 0.16mi | 4/2.0 | 1,418 (-13%) | 1mo | $250,000 | $176 | 69 |
| 1307 Thomas St | 0.47mi | 4/2.0 | 1,487 (-9%) | 1mo | $319,000 | $215 | 62 |
| 1631 187th St | 0.19mi | 3/1.5 (-1) | 1,878 (+15%) | 0mo | $260,000 | $138 | 59 |
| 939 Coach Rd | 0.67mi | 4/3.0 | 1,712 (+5%) | 1mo | $279,000 | $163 | 56 |
| 18630 Highland Ave | 0.44mi | 3/1.5 (-1) | 1,485 (-9%) | 2mo | $270,000 | $182 | 56 |
| 18441 Marshfield Ave | 0.37mi | 3/1.5 (-1) | 1,855 (+13%) | 1mo | $345,000 | $186 | 53 |
| 1308 W 191st St | 0.50mi | 3/2.0 (-1) | 1,820 (+11%) | 3mo | $251,000 | $138 | 51 |
| 1037 185th Pl | 0.59mi | 3/2.0 (-1) | 1,800 (+10%) | 1mo | $400,000 | $222 | 50 |
| 1041 Coach Rd | 0.54mi | 4/2.0 | 1,407 (-14%) | 2mo | $289,000 | $205 | 50 |
| 18234 Riegel Rd | 0.65mi | 3/2.0 (-1) | 1,786 (+9%) | 1mo | $150,000 | $84 | 49 |
| 18350 Carpenter St | 0.72mi | 5/2.5 (+1) | 1,865 (+14%) | 2mo | $260,000 | $139 | 35 |
Match score weights: distance 35% · size 25% · config 20% · recency 20%. Top-matched comps best support the ARV.
Projected returns pro-forma
-3.0% appreciation · 3.0% rent growth · sell at horizon
- IRR
- -12.6%
- Equity multiple
- 0.55×
- Total profit
- $-40,703
- Equity at exit
- $47,698
- IRR
- -3.5%
- Equity multiple
- 0.77×
- Total profit
- $-20,980
- Equity at exit
- $27,659
Cash invested: $89,572 (down + closing). Projections, not guarantees.
Landlord ↔ Tenant lean methodology
- Overall (STATE)
- 43 Moderately Tenant-Leaning
- State Illinois
- 43 Moderately Tenant-Leaning · D+7
- County
- — inherits STATE
- City
- — inherits STATE
ZIP-level market 60430
- Home prices YoY
- -32.1%
- Active inventory
- 102
- Price-to-rent
- 8.8×
Monthly cashflow live
- Estimated rent
- $3,019 high interval (Pro) →
- Mortgage (P&I)
- −$1,678
- Tax est. 1.5%
- −$400 /mo · $4,798/yr
- Insurance
- −$133
- HOA
- −$0
- Vacancy / Maint / Mgmt
- −$634
- Net cashflow
- $174
Break-even live
Sensitivity live
| Price | -10% $395 | -5% $285 | +0% $174 | +5% $64 | +10% $-47 |
|---|---|---|---|---|---|
| Rent | -10% $-64 | -5% $55 | +0% $174 | +5% $293 | +10% $413 |
| Rate | -1.0pp $335 | -0.5pp $255 | base $174 | +0.5pp $91 | +1.0pp $7 |
UW: 25.0% down · 7.5% · 30yr · 1.5% tax · 5.0% vac · 8.0% maint · 8.0% mgmt
Financing live
Cash to close
- Down payment
- $79,975
- Closing costs
- $9,597
- Reserves months
- —
- Total cash needed
- —
Loan-product check · same deal, 3 products live
Conventional
25% down · 7.5% · 30yr
- Down + closing
- —
- Monthly P&I
- —
- Monthly cashflow
- —
- DSCR
- —
- Eligible?
- —
Personal DTI + credit; lowest rate.
DSCR
20% down · 8.5% · 30yr
- Down + closing
- —
- Monthly P&I
- —
- Monthly cashflow
- —
- DSCR
- —
- Eligible?
- —
No personal income docs; deal must DSCR.
Hard money
10% down · 12.0% · 12mo
- Down + closing
- —
- Monthly P&I
- —
- Monthly cashflow
- —
- DSCR
- —
- Eligible?
- —
Short-term bridge; refi at stabilization.
Rent comps 6 comps
| Address | Beds | Baths | Sqft | Rent | $/sqft | DOM | Units | Dist |
|---|---|---|---|---|---|---|---|---|
| 1332 Jamie Ln Homewood, IL | 4.0 | 2.5 | 1576 | $3,171 | $2.01 | 26d | 1 | 0.24mi |
| 1601 183rd St Unit 1237861P Homewood, IL | 3.0 | 1.5 | 1528 | $8,665 | $5.67 | 24d | 1 | 0.57mi |
| 1802 Evergreen Rd Homewood, IL | 4.0 | 2.0 | 1716 | $2,836 | $1.65 | 0d | 1 | 0.66mi |
| 18117 Loomis Ave Homewood, IL | 4.0 | 2.0 | 1500 | $2,800 | $1.87 | 5d | 1 | 0.80mi |
| 705 W Fitzhenry Ct Glenwood, IL | 3.0 | 2.0 | 1600 | $2,950 | $1.84 | 22d | 1 | 1.40mi |
| 705 W Fitzhenry Ct Glenwood, IL | 3.0 | 2.0 | 1700 | $2,950 | $1.74 | 26d | 1 | 1.40mi |
Listing history 7 events
-
2026-06-21days on market $319,900 Coming Soon 10 DOM
-
2026-06-18days on market $319,900 Coming Soon 7 DOM
-
2026-06-17days on market $319,900 Coming Soon 6 DOM
-
2026-06-16days on market $319,900 Coming Soon 5 DOM
-
2026-06-15days on market $319,900 Coming Soon 4 DOM
-
2026-06-13remarks 699-char remark
-
2026-06-13$319,900 Coming Soon 2 DOM
ⓘ Source: listings_history table (triggers on properties + properties_extension) + one-shot
backfill from property_details.listing_events for pre-trigger history.
Nearby sold comps map
Loading sold comps map…
Walkable amenities ~0.75 mi
Loading nearby amenities…
Taxation est. · year 1
- Rental income
- $36,226
- − Mortgage interest
- −$17,919
- − Property taxes
- −$4,798
- − Insurance
- −$1,600
- − Repairs & maintenance
- −$2,898
- − Management
- −$2,898
- − Depreciation
- −$9,306
- Taxable loss
- −$3,194
- Est. tax savings @ 24.0%
- +$767
- After-tax cash flow
- $2,856/yr
For passive investors: Depreciation is non-cash, so a rental often shows a tax loss while cash-flowing — sheltering income. Rental losses are passive: they offset passive income freely, and up to $25,000/yr can offset ordinary (W-2) income if you actively participate and your MAGI is under $100k (phasing out to $0 by $150k); unused losses carry forward. On sale, claimed depreciation is recaptured at up to 25%, and gains may owe capital-gains tax (a 1031 exchange can defer both). Figures are a year-1 estimate at your 24.0% rate — not tax advice; consult a CPA.
Schools (NCES district)
- District
- Homewood Flossmoor Chsd 233
- NCES district ID
- 1719560
- Math proficiency
- 21% ▼ -15.00%
- Reading proficiency
- 27% ▼ -13.00%
- Median HH income
- $83,564
- Composite
- 24.42/100
- National rank
- #7681
- State rank
- #272 of 620 in IL
Livability — Homewood
- Score
- 81/100
- State rank
- #81
- US rank
- #1314
Category grades
Schools grade is shown separately in the Schools card above.
Census & demographics
- Census place
- Homewood, IL
- City population
- 19,993
- Population (ZIP)
- 19,993
Population outlook (Cook County) Hauer SSP2
- Today (2025)
- 5,347,519 people
- By 2030
- 5,357,703 · +0.2%
- By 2040
- 5,324,924 · -0.4%
- By 2050
- 5,230,762 · -2.2%
- By 2075
- 4,785,735 · -10.5%
- By 2100
- 4,188,836 · -21.7%
Race, ethnicity, and origin ACS 2023
- Neighborhood character
- Diverse neighborhood (Simpson 0.62)
- Race & ethnicity
- Black 44% White 42% Hispanic / Latino 9% Two or more races 6% Asian 1%
- Hispanic origin (detail)
- Mexican 7%
- Common ancestry
- Romanian 5% Iranian 2% Italian 2%
- Foreign-born
- 6% · Canada, Dominican Republic
- Languages at home
- 91% English-only · Spanish 5% Russian/Polish/Slavic 1% German/W. Germanic 1%
Political lean MEDSL · Cook
- 2024 margin
- Solid D (+42.0) · D 70.4% · R 28.4% · Other 1.2%
- 2008→2024 swing
- -11.4pp toward R · 2008: 53.4pp · 2024: 42.0pp
- All cycles
- 2024: D+42.0 2020: D+50.3 2016: D+53.0 2012: D+49.4 2008: D+53.4
Not yet ingested
- Civics
- —
Market trends
- HPI YoY
- ▼ -105.00%
- Current HPI
- 222.2923
- Rent YoY
- —
- Metro
- —
- State GDP YoY
- ▲ 1.59%
- F500 in state
- 60
Industry mix (Fortune 500 HQ in IL)
| Industry | F500 HQs | Revenue |
|---|---|---|
| Insurance | 4 | $201B |
|
||
| Consumer Goods | 4 | $87B |
|
||
| Industrial Machinery | 3 | $64B |
|
||
| Healthcare | 2 | $55B |
|
||
| Retail / Pharmacy | 1 | $148B |
|
||
| Agriculture / Food | 1 | $86B |
|
||
Cash-flow waterfall
monthlySold comps — $/sqft
last 12 mo · ≤1 miLoading sold comps…