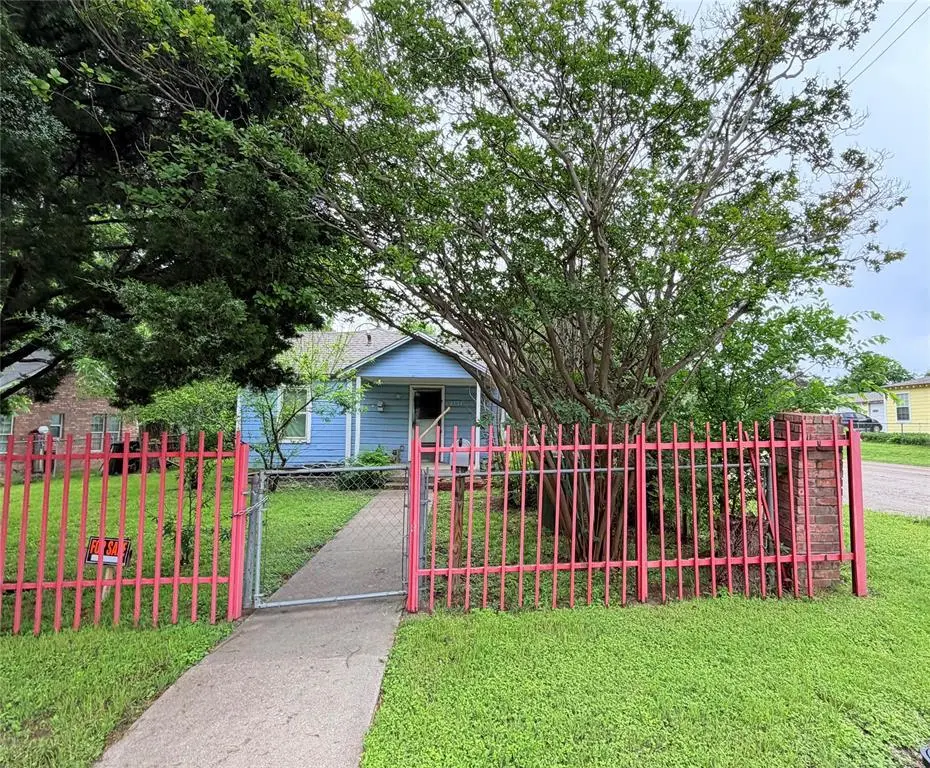
2724 Flint Ave · Waco, TX
Flood risk 1/10 · Minimal
- FEMA flood zone
- X (unshaded)
- Chance of flooding over 30 yrs
- 0.0%
- Est. flood insurance / yr
- $507 – $1,088
Fire risk 1/10 · Minimal
- Est. fire insurance / yr
- $1,222 – $2,270
Heat risk 7/10 · Major
- Hot days now (above 109°F)
- 7 days/yr
- Hot days in 30 yrs
- 24 days/yr
Wind risk 6/10 · Moderate
- Chance of severe wind over 30 yrs
- 60.0%
Air-quality risk 1/10 · Minimal
- Unhealthy air days now
- 0 days/yr
- Unhealthy air days in 30 yrs
- 0 days/yr
Risk factors via First Street. Map © Google.
Why this score? — see what drove the C- grade
The composite is a weighted blend of 9 inputs, each scored 0–100. Each bar is that input's sub-score; the figure is the points it added to the 100-point composite (weight × sub-score).
- ARV discount +15.0/15.0
- Cash flow +14.2/30.0
- Appreciation +6.8/10.0
- DSCR +4.3/10.0
- Livability +3.7/5.0
- 1% rule +3.4/10.0
- Rent growth +3.2/5.0
- Condition / age +2.5/5.0
- Schools +1.8/10.0
$115,000
🖨 Deal sheet 📄 Offer letter ✓ Due diligence
Listing remarks
Opportunity is knocking! Investor special with major upside potential in Waco. This property offers a unique chance to complete a renovation that is already in progress. The front portion of the home features existing living space with updates started including flooring while the rear addition is currently in framing stage and ready to be finished out. Ideal for investors, flippers, or buyers looking to add value. The structure and expansion have already been started which saves time and allows the next owner to bring their vision to life. Conveniently located and sitting on a fenced lot, this property has strong potential for resale or rental once completed.
Key facts
- 5,009 sq ft lot
- Built 1950
- Listed 44 days
Property features AI
Finance
- Other: Property located at the corner of South 28th in the Bell J D subdivision; Directions: Located right at the corner of South 28th
- Financial info: Listing accepts Cash and Conventional financing; Second mortgage: No
- HOA & community: No association
Exterior
- Parking: No garage
- Utilities: City water; City sewer; Electricity connected; Not in a municipal utility district
- Home design: Single Family Residence; Residential property; One story; Property is attached
- Construction: Built in 1950; Wood and other construction materials; Shingle roof; Pillar/Post/Pier and slab foundation
- Exterior features: Chain link/metal fencing; Fenced yard; Lot less than 0.5 acre (approx. 0.115 acre)
Interior
- Kitchen: No appliances listed
- Bedrooms: 2 bedrooms total; Primary bedroom on level 1 (9 x 10)
- Flooring: Carpet; Concrete
- Bathrooms: 2 full bathrooms
- Interior features: One living area and one dining area; Other interior features
- Laundry & utility: No laundry appliances listed
Neighborhood map
What this means for you Summary
Snapshot
- This is a 2-bed/1.0-bath single-family listed at $115k.
Deal economics
- At list price, monthly cash flow is $18 ($221/yr) — positive.
- The deal already cash-flows at list — no discount required.
- To meet the 1% rule (rent ≥ 1% of price), the offer needs to be $96k (16.2% below list).
- Recommended offer: $96k (16.2% below list) — sets the bar for 1% rule.
- Cap rate 6.5% vs local median 3.9% in Waco — top-decile yield for the area; either an underpriced asset or a hidden risk that comps aren't pricing in. Stress-test before assuming the spread holds.
Location & tenants
- Location reads 74/100 on livability (#166 in TX, #4,378 nationally) — a middle-class / working-renter tenant base. Strengths: cost of living A+, housing A+, health & safety A+; Watch: crime D, commute F, employment D-.
- Waco ISD (urban): math 20% / reading 24% proficiency, ranked #773 of 826 in TX (top 94%) — low school quality limits family demand, transient renter base, plan for 1-2y turnover; 81% free/reduced lunch — lower-income household profile, screen leases tightly.
- Zoned schools: Bell'S Hill El (math 31% / reading 31%, grade F, #2,429 of 4,322 statewide, top 57%, 760 students, 96% FRL).
- Market conditions: Rents rising (+2.6%/yr); 43 active listings in the ZIP; 17 comparable units currently listed for rent nearby; rentals at typical pace (median 21d on market — plan ~3-4 weeks tenant-placement turnaround); 1,014 units permitted in McLennan County in 2024 (200 in 5+ unit buildings).
Forward outlook
- In year one you build about $5k of equity ($795 loan paydown + $4k appreciation (3.6% local appreciation)).
- McLennan County population projected at +17% by 2050 — long-run rental-demand tailwind backs the buy-and-hold thesis.
- At projected returns (3.6% appreciation + 2.6% rent growth), your $32k cash investment doubles in ~6 years — after that, you're playing with house money.
- By year 7, paydown + projected appreciation supports a ~$31k cash-out refi (75% LTV) — recoverable capital for the next deal without selling this one.
Negotiation context
- It's been on market 44 days — a 3% lower offer ($112k) is reasonable based on typical stale-listing flexibility.
Risks & watch-outs
- Watch-outs: built in 1950 — expect roof / HVAC / electrical / plumbing capex.
- Climate carrying-cost: major wind risk, 60% chance of damaging wind over 30y; extreme-heat days projected 7→24/yr by 2055 (HVAC capex compounding) — expect insurance premiums to compound above CPI over the hold.
Questions for the listing agent
- It's been on market 44 days. Have you received any prior offers? Is the seller open to a 16% concession, seller financing, or rate buy-down credit?
- Built in 1950 — when were the roof, HVAC, electrical panel, plumbing, and water heater last replaced?
- Is there a deadline driving the sale (1031 exchange, divorce, estate, relocation)? That informs how much negotiation room exists.
- Schools are D-rated, which usually means shorter tenancies and higher turnover. Who's the typical renter profile here, and what's been the actual vacancy rate?
- Crime grade is D in this area — have there been break-ins, vandalism, or insurance claims at this property in the last 3 years? What carrier currently insures it and at what premium?
- What's the average days-on-market for RENTAL listings here right now (not sales)? A rising rental-DOM trend means longer vacancies and softer asking-rent achievability than the comps imply.
- What's the recent tenant-quality profile in this submarket — average credit score on applications, eviction rate, late-payment / NSF rate, and stable-employment percentage? A property-management company in the area should have these aggregated.
- How much new for-sale + rental construction is in the pipeline within 1–3 miles? Heavy new supply typically softens prices + rents 12–24 months out; constrained supply supports both.
Investment metrics
- 1% rule
- 0.84% ✗
- Cap rate
- 6.48%
- Cash-on-cash
- 0.69%
- DSCR
- 1.03
- GRM
- 9.9
CMA / ARV
- ARV (median comp)
- $145,425
- List price
- $115,000
- Delta
- -20.92%
- Verdict
- UNDERPRICED
- Comps
- 20 within 1.0 mi
Projected returns pro-forma
3.57% appreciation · 2.62% rent growth · sell at horizon
- IRR
- 9.5%
- Equity multiple
- 1.56×
- Total profit
- $18,121
- Equity at exit
- $55,411
- IRR
- 11.5%
- Equity multiple
- 2.81×
- Total profit
- $58,146
- Equity at exit
- $88,392
Cash invested: $32,200 (down + closing). Projections, not guarantees.
Landlord ↔ Tenant lean methodology
- Overall (STATE)
- 87 Strongly Landlord-Friendly
- State Texas
- 87 Strongly Landlord-Friendly · R+5
- County
- — inherits STATE
- City
- — inherits STATE
ZIP-level market 76711
- Home prices YoY
- 1.4%
- Rents YoY
- 2.6%
- Active inventory
- 43
- Price-to-rent
- 9.9×
Monthly cashflow live
- Estimated rent
- $964 high interval (Pro) →
- Mortgage (P&I)
- −$603
- Tax from tax record
- −$92 /mo · $1,105/yr
- Insurance
- −$48
- HOA
- −$0
- Vacancy / Maint / Mgmt
- −$202
- Net cashflow
- $18
Break-even live
UW: 25.0% down · 7.5% · 30yr · 1.5% tax · 5.0% vac · 8.0% maint · 8.0% mgmt
Financing live
Cash to close
- Down payment
- $28,750
- Closing costs
- $3,450
- Reserves months
- —
- Total cash needed
- —
Loan-product check · same deal, 3 products live
Conventional
25% down · 7.5% · 30yr
- Down + closing
- —
- Monthly P&I
- —
- Monthly cashflow
- —
- DSCR
- —
- Eligible?
- —
Personal DTI + credit; lowest rate.
DSCR
20% down · 8.5% · 30yr
- Down + closing
- —
- Monthly P&I
- —
- Monthly cashflow
- —
- DSCR
- —
- Eligible?
- —
No personal income docs; deal must DSCR.
Hard money
10% down · 12.0% · 12mo
- Down + closing
- —
- Monthly P&I
- —
- Monthly cashflow
- —
- DSCR
- —
- Eligible?
- —
Short-term bridge; refi at stabilization.
Rent comps 17 comps
| Address | Beds | Baths | Sqft | Rent | $/sqft | DOM | Units | Dist |
|---|---|---|---|---|---|---|---|---|
| 700 S Valley Mills Dr Waco, TX | 1.0–2.0 | 1.0–1.5 | 850 | $995 | $1.17 | 13d | 2 | 0.69mi |
| 2812 W Waco Dr Unit 15 Waco, TX | 1.0 | 1.0 | 580 | $950 | $1.64 | 21d | 1 | 0.95mi |
| 1726 Austin Ave Unit 208 Waco, TX | 1.0 | 1.0 | 560 | $1,895 | $3.38 | 43d | 1 | 0.99mi |
| 1726 Austin Ave Unit 210 Waco, TX | 1.0 | 1.0 | 660 | $2,095 | $3.17 | 43d | 1 | 0.99mi |
| 2100 S 19th St Waco, TX | 1.0 | 1.0 | 684 | $1,300 | $1.90 | 21d | 1 | 1.01mi |
| 1508 S 13th St Waco, TX | 1.0–2.0 | 1.0 | 775 | $895 | $1.15 | 13d | 1 | 1.12mi |
| 1214 Baylor Ave Waco, TX | 1.0–2.0 | 1.0–2.0 | 736 | $1,095 | $1.49 | 43d | 2 | 1.14mi |
| 3528 W Waco Dr Apt 207 Waco, TX | 1.0 | 1.0 | 500 | $950 | $1.90 | 21d | 1 | 1.16mi |
| 1625 Columbus Ave Unit A Waco, TX | 1.0 | 1.0 | 550 | $700 | $1.27 | 43d | 1 | 1.19mi |
| 3638 W Waco Dr Waco, TX | 1.0 | 1.0 | 731 | $902 | $1.23 | 13d | 8 | 1.19mi |
| 1800 Primrose Dr Waco, TX | 1.0–4.0 | 1.0–2.0 | 942 | $992 | $1.05 | 13d | 33 | 1.26mi |
| 1120 James Ave Unit Brownstone 205 Waco, TX | 1.0 | 1.0 | 650 | $795 | $1.22 | 21d | 1 | 1.27mi |
| 1721 S 11th St Waco, TX | 3.0 | 3.0 | 435 | $525 | $1.21 | 21d | 1 | 1.31mi |
| 2006 Gorman Ave Waco, TX | 1.0 | 1.0 | 553 | $700 | $1.27 | 43d | 1 | 1.38mi |
| 508 N 38th St Unit 514-C Waco, TX | 1.0 | 1.0 | 711 | $750 | $1.05 | 21d | 1 | 1.39mi |
| 508 N 38th St Waco, TX | 1.0 | 1.0 | 711 | $795 | $1.12 | 21d | 1 | 1.39mi |
| 1724 Morrow Ave Unit D Waco, TX | 1.0 | 1.0 | 650 | $775 | $1.19 | 43d | 1 | 1.41mi |
Listing history 20 events
-
2026-06-18price $115,000 Active 44 DOM
-
2026-06-18days on market $120,000 Active 44 DOM
-
2026-06-17days on market $120,000 Active 43 DOM
-
2026-06-16days on market $120,000 Active 42 DOM
-
2026-06-15days on market $120,000 Active 41 DOM
-
2026-06-14days on market $120,000 Active 39 DOM
-
2026-06-13days on market $120,000 Active 38 DOM
-
2026-06-10days on market $120,000 Active 36 DOM
-
2026-06-09days on market $120,000 Active 35 DOM
-
2026-06-08days on market $120,000 Active 34 DOM
-
2026-06-07days on market $120,000 Active 33 DOM
-
2026-06-05days on market $120,000 Active 30 DOM
-
2026-06-03days on market $120,000 Active 29 DOM
-
2026-06-02days on market $120,000 Active 28 DOM
-
2026-06-01days on market $120,000 Active 27 DOM
-
2026-05-31days on market $120,000 Active 26 DOM
-
2026-05-30days on market $120,000 Active 25 DOM
-
2026-04-23$120,000 Active 676-char remark
-
2025-08-29soldstatus
-
1993-01-22soldstatus
ⓘ Source: listings_history table (triggers on properties + properties_extension) + one-shot
backfill from property_details.listing_events for pre-trigger history.
Tax reassessment forecast TX · Resets to sale price
- Current annual tax
- $1,105 · $92/mo
- Projected year-2 tax
- $2,104 · $175/mo
- Expected delta
- +$1,000/yr (+$83/mo · 90.5%)
ⓘ Screening estimate from a state-policy table — verify with the county assessor before closing.
Climate risk First Street
- Flood 1/10 Low FEMA zone X (unshaded) · 0% chance over 30 yrs
- Wildfire 1/10 Low
- Heat 7/10 Severe 7 d/yr ≥109°F today · 24 d/yr by 30 yrs out
- Wind 6/10 Major 60% chance of damaging wind over 30 yrs
- Air quality 1/10 Low 0 unhealthy d/yr today · 0 by 30 yrs out
Nearby sold comps map
Loading sold comps map…
Walkable amenities ~0.75 mi
Loading nearby amenities…
Taxation est. · year 1
- Rental income
- $11,566
- − Mortgage interest
- −$6,442
- − Property taxes
- −$1,105
- − Insurance
- −$575
- − Repairs & maintenance
- −$925
- − Management
- −$925
- − Depreciation
- −$3,345
- Taxable loss
- −$1,751
- Est. tax savings @ 24.0%
- +$420
- After-tax cash flow
- $641/yr
For passive investors: Depreciation is non-cash, so a rental often shows a tax loss while cash-flowing — sheltering income. Rental losses are passive: they offset passive income freely, and up to $25,000/yr can offset ordinary (W-2) income if you actively participate and your MAGI is under $100k (phasing out to $0 by $150k); unused losses carry forward. On sale, claimed depreciation is recaptured at up to 25%, and gains may owe capital-gains tax (a 1031 exchange can defer both). Figures are a year-1 estimate at your 24.0% rate — not tax advice; consult a CPA.
Schools (NCES district)
- District
- Waco ISD
- NCES district ID
- 4844280
- Math proficiency
- 20% ▼ -14.00%
- Reading proficiency
- 24% ▼ -6.00%
- Median HH income
- $29,208
- Composite
- 17.57/100
- National rank
- #9043
- State rank
- #773 of 826 in TX
Livability — Waco
- Score
- 74/100
- State rank
- #166
- US rank
- #4378
Category grades
Schools grade is shown separately in the Schools card above.
Census & demographics
- Census place
- Waco, TX
- County
- McLennan County · 213,088 people
- City population
- 125,319
- Metro
- Waco, TX
- Population (ZIP)
- 9,676
- Household income
- $53,185
- Rent vs Own
- Severe rent burden
- 424.0
Population outlook (McLennan County) Hauer SSP2
- Today (2025)
- 264,191 people
- By 2030
- 273,578 · +3.6%
- By 2040
- 291,506 · +10.3%
- By 2050
- 308,044 · +16.6%
- By 2075
- 349,648 · +32.3%
- By 2100
- 364,779 · +38.1%
Race, ethnicity, and origin ACS 2023
- Neighborhood character
- Diverse neighborhood (Simpson 0.56)
- Race & ethnicity
- Hispanic / Latino 61% Two or more races 43% White 23% Black 12% Native American 3% Asian 2%
- Hispanic origin (detail)
- Mexican 56%
- Common ancestry
- Lithuanian 1% Italian 1% Portuguese 1%
- Foreign-born
- 27% · Canada, China
- Languages at home
- 53% English-only · Spanish 45% Tagalog/Filipino 1% Other Indo-European 1%
Political lean MEDSL · McLennan
- 2024 margin
- Solid R (+30.9) · D 34.0% · R 64.9% · Other 1.0%
- 2008→2024 swing
- -7.0pp toward R · 2008: -23.9pp · 2024: -30.9pp
- All cycles
- 2024: R+30.9 2020: R+23.4 2016: R+27.1 2012: R+29.8 2008: R+23.9
Not yet ingested
- Civics
- —
Market trends
- HPI YoY
- ▲ 3.57%
- Current HPI
- 261.7166
- Rent YoY
- ▲ 2.62%
- Metro
- Waco, TX
- State GDP YoY
- ▲ 3.95%
- F500 in state
- 110
Industry mix (Fortune 500 HQ in TX)
| Industry | F500 HQs | Revenue |
|---|---|---|
| Energy | 16 | $1,198B |
|
||
| Technology | 5 | $198B |
|
||
| Engineering / Construction | 4 | $72B |
|
||
| Energy Services | 3 | $60B |
|
||
| Utilities | 3 | $41B |
|
||
| Healthcare | 2 | $330B |
|
||
Price history
-4.2% since first listed4 events — show timeline
- 2026-06-18 Price Changed $115,000 NTREIS
- 2026-04-23 Listed $120,000 NTREIS
- 2025-08-29 Sold (Public Records) — Public Records
- 1993-01-22 Sold (Public Records) — Public Records
Property tax history
+9.2%/yrLatest (2025): $1,105 · +19.6% YoY. Source: county tax records.
Cash-flow waterfall
monthlySold comps — $/sqft
last 12 mo · ≤1 miLoading sold comps…