370 Webb Acres · Mountain View, AR
Flood risk 1/10 · Minimal
- FEMA flood zone
- X
- Chance of flooding over 30 yrs
- 0.0%
- Est. flood insurance / yr
- $507 – $1,088
Fire risk 5/10 · Moderate
- Est. fire insurance / yr
- $1,499 – $2,785
Heat risk 4/10 · Minor
- Hot days now (above 108°F)
- 7 days/yr
- Hot days in 30 yrs
- 19 days/yr
Wind risk 2/10 · Minimal
- Chance of severe wind over 30 yrs
- 4.0%
Air-quality risk 2/10 · Minimal
- Unhealthy air days now
- 0 days/yr
- Unhealthy air days in 30 yrs
- 1 days/yr
Risk factors via First Street. Map © Google.
Why this score? — see what drove the C+ grade
The composite is a weighted blend of 9 inputs, each scored 0–100. Each bar is that input's sub-score; the figure is the points it added to the 100-point composite (weight × sub-score).
- Cash flow +30.0/30.0
- 1% rule +10.0/10.0
- DSCR +10.0/10.0
- Schools +3.1/10.0
- Livability +2.9/5.0
- Rent growth +2.5/5.0
- Condition / age +2.5/5.0
- ARV discount +0.0/15.0
- Appreciation +0.0/10.0
$59,000
🖨 Deal sheet 📄 Offer letter ✓ Due diligence
Listing remarks
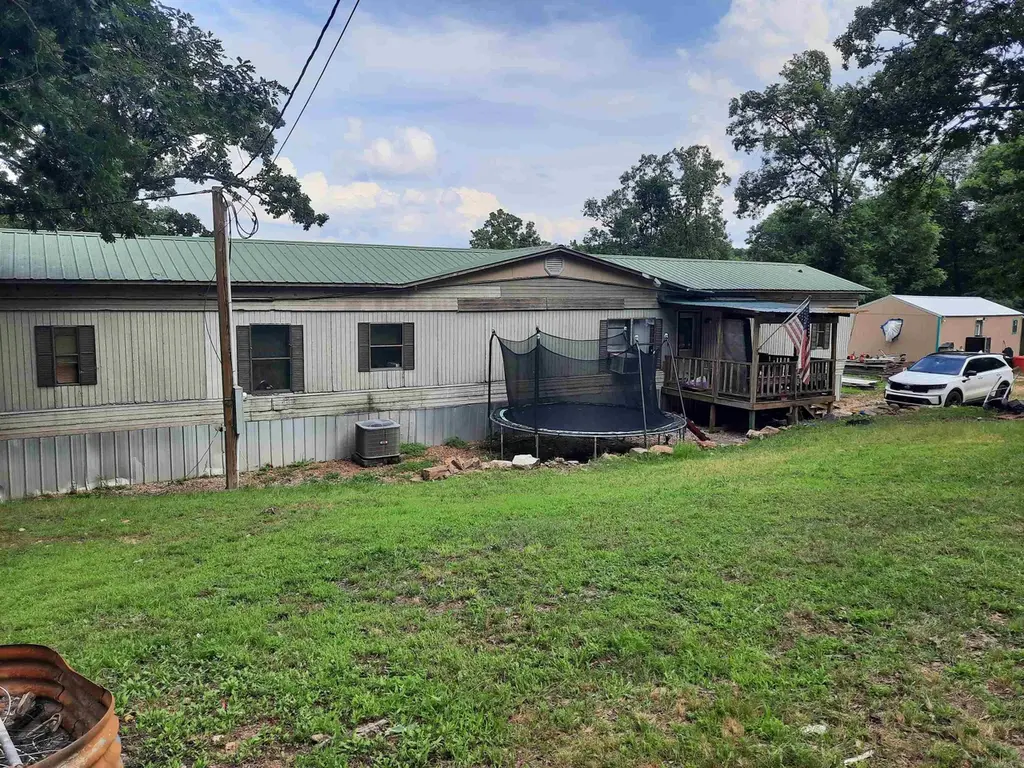
Here is a very affordable home, complete with shop, located in country but convenient to town on 3.20 acres. Mobile home has metal roof, front porch and covered back deck, home offer 3 bedrooms, plus a nursey off primary bedroom, 1 1/2 bath, needs some TLC but ready for you to make it your own. Take a look.
Key facts
- Shop
- Metal roof
- 3.20 acres
Tags
Property features AI
Finance
- Other: Approximately 3.2 acres
Exterior
- Parking: Other parking (see remarks)
- Utilities: Septic system; Public water; Municipal electric service (Entergy)
- Home design: Single-family property; Entry level not specified; Facing direction not specified
- Construction: Metal/vinyl siding; Not permanent foundation
- Exterior features: Metal roof; Gravel road access; Sloped, wooded and cleared lot in a subdivision; Rural property
Interior
- Kitchen: Free-standing stove
- Flooring: Vinyl flooring; Laminate flooring
- Bathrooms: 1 full bath; 1 half bath
- Heating & cooling: Central heating; Central cooling
- Interior features: Vinyl and laminate flooring; Wood-burning fireplace (site-built)
Neighborhood map
What this means for you Summary
Snapshot
- This is a 3-bed/1.5-bath manufactured listed at $59k.
Deal economics
- At list price, monthly cash flow is $446 ($5k/yr) — positive.
- The deal already cash-flows at list — no discount required.
- Meets the 1% rule at list price ($1k rent vs $59k).
- Recommended offer: $58k (1.5% below list) — sets the bar for market timing.
- Cap rate 15.4% vs local median 2.5% in Mountain View — top-decile yield for the area; either an underpriced asset or a hidden risk that comps aren't pricing in. Stress-test before assuming the spread holds.
Location & tenants
- Location reads 58/100 on livability (#316 in AR) — a working-class tenant base; expect higher turnover. Strengths: cost of living A+; Watch: schools D-, crime D-, amenities F.
- Mountain View School District (rural): math 34% / reading 41% proficiency, ranked #107 of 238 in AR (top 45%) — families likely to look elsewhere, expect single-tenant / working-renter base with shorter leases.
- Market conditions: 164 active listings in the ZIP; 2 units permitted in Stone County in 2024 (0 in 5+ unit buildings).
Forward outlook
- Local home prices are declining (-3.0%/yr); year-one equity from $408 of loan paydown is wiped out by about $2k of value loss. Plan a longer hold.
- Stone County population projected to shrink 6% by 2050 — rents likely to lag national; underwrite the cash flow, not the appreciation.
- At projected returns (-3.0% appreciation + 3.0% rent growth), your $17k cash investment doubles in ~4 years — after that, you're playing with house money.
Negotiation context
- It's been on market 15 days — a 2% lower offer ($58k) is reasonable based on typical stale-listing flexibility.
- 2 sale attempts since 9y ago with the ask held roughly flat each time — persistent listings suggest the price (not the market) is what's stuck; bring a comps-based counter.
- Current owner paid $20k; list at $59k implies a 195% gain — meaningful room to come down on a strong offer.
Risks & watch-outs
- Climate carrying-cost: moderate wildfire risk — expect insurance premiums to compound above CPI over the hold.
Questions for the listing agent
- Is there a deadline driving the sale (1031 exchange, divorce, estate, relocation)? That informs how much negotiation room exists.
- Schools are D-rated, which usually means shorter tenancies and higher turnover. Who's the typical renter profile here, and what's been the actual vacancy rate?
- Crime grade is D in this area — have there been break-ins, vandalism, or insurance claims at this property in the last 3 years? What carrier currently insures it and at what premium?
- What's the average days-on-market for RENTAL listings here right now (not sales)? A rising rental-DOM trend means longer vacancies and softer asking-rent achievability than the comps imply.
- What's the recent tenant-quality profile in this submarket — average credit score on applications, eviction rate, late-payment / NSF rate, and stable-employment percentage? A property-management company in the area should have these aggregated.
- How much new for-sale + rental construction is in the pipeline within 1–3 miles? Heavy new supply typically softens prices + rents 12–24 months out; constrained supply supports both.
Investment metrics
- 1% rule
- 1.83% ✓
- Cap rate
- 15.37%
- Cash-on-cash
- 32.42%
- DSCR
- 2.44
- GRM
- 4.5
CMA / ARV
- ARV (on-the-fly)
- $41,344
- Comps found
- 1
Show comp detail 1 sale within ~0.75 mi
| Address | Dist | Beds/Ba | Sqft | Sold | Price | $/sf | Match |
|---|---|---|---|---|---|---|---|
| 794 Blue Ridge Dr | 0.65mi | 3/1.0 | 1,064 (-12%) | 10mo | $36,500 | $34 | 38 |
Match score weights: distance 35% · size 25% · config 20% · recency 20%. Top-matched comps best support the ARV.
Projected returns pro-forma
-3.0% appreciation · 3.0% rent growth · sell at horizon
- IRR
- 27.5%
- Equity multiple
- 2.14×
- Total profit
- $18,885
- Equity at exit
- $8,797
- IRR
- 35.0%
- Equity multiple
- 4.22×
- Total profit
- $53,119
- Equity at exit
- $5,101
Cash invested: $16,520 (down + closing). Projections, not guarantees.
Landlord ↔ Tenant lean methodology
- Overall (STATE)
- 92 Strongly Landlord-Friendly
- State Arkansas
- 92 Strongly Landlord-Friendly · R+14
- County
- — inherits STATE
- City
- — inherits STATE
ZIP-level market 72560
- Home prices YoY
- -23.2%
- Active inventory
- 164
- Price-to-rent
- 4.5×
Monthly cashflow live
- Estimated rent
- $1,081 medium interval (Pro) →
- Mortgage (P&I)
- −$309
- Tax est. 1.5%
- −$74 /mo · $885/yr
- Insurance
- −$25
- HOA
- −$0
- Vacancy / Maint / Mgmt
- −$227
- Net cashflow
- $446
Break-even live
UW: 25.0% down · 7.5% · 30yr · 1.5% tax · 5.0% vac · 8.0% maint · 8.0% mgmt
Financing live
Cash to close
- Down payment
- $14,750
- Closing costs
- $1,770
- Reserves months
- —
- Total cash needed
- —
Loan-product check · same deal, 3 products live
Conventional
25% down · 7.5% · 30yr
- Down + closing
- —
- Monthly P&I
- —
- Monthly cashflow
- —
- DSCR
- —
- Eligible?
- —
Personal DTI + credit; lowest rate.
DSCR
20% down · 8.5% · 30yr
- Down + closing
- —
- Monthly P&I
- —
- Monthly cashflow
- —
- DSCR
- —
- Eligible?
- —
No personal income docs; deal must DSCR.
Hard money
10% down · 12.0% · 12mo
- Down + closing
- —
- Monthly P&I
- —
- Monthly cashflow
- —
- DSCR
- —
- Eligible?
- —
Short-term bridge; refi at stabilization.
Listing history 12 events
-
2026-06-19days on market $59,000 Active 15 DOM
-
2026-06-18days on market $59,000 Active 14 DOM
-
2026-06-17days on market $59,000 Active 13 DOM
-
2026-06-16days on market $59,000 Active 12 DOM
-
2026-06-15days on market $59,000 Active 11 DOM
-
2026-06-14days on market $59,000 Active 9 DOM
-
2026-06-12statusdays on market $59,000 Active 8 DOM
-
2026-06-09days on market $59,000 New Listing 5 DOM
-
2026-06-08days on market $59,000 New Listing 4 DOM
-
2026-06-07days on market $59,000 New Listing 3 DOM
-
2026-06-07remarks 308-char remark
-
2026-06-07$59,000 New Listing 2 DOM
ⓘ Source: listings_history table (triggers on properties + properties_extension) + one-shot
backfill from property_details.listing_events for pre-trigger history.
Climate risk First Street
- Flood 1/10 Low FEMA zone X · 0% chance over 30 yrs
- Wildfire 5/10 Major
- Heat 4/10 Moderate 7 d/yr ≥108°F today · 19 d/yr by 30 yrs out
- Wind 2/10 Low 4% chance of damaging wind over 30 yrs
- Air quality 2/10 Low 0 unhealthy d/yr today · 1 by 30 yrs out
Nearby sold comps map
Loading sold comps map…
Walkable amenities ~0.75 mi
Loading nearby amenities…
Taxation est. · year 1
- Rental income
- $12,974
- − Mortgage interest
- −$3,305
- − Property taxes
- −$885
- − Insurance
- −$295
- − Repairs & maintenance
- −$1,038
- − Management
- −$1,038
- − Depreciation
- −$1,716
- Taxable income
- $4,697
- Est. tax owed @ 24.0%
- −$1,127
- After-tax cash flow
- $4,229/yr
For passive investors: Depreciation is non-cash, so a rental often shows a tax loss while cash-flowing — sheltering income. Rental losses are passive: they offset passive income freely, and up to $25,000/yr can offset ordinary (W-2) income if you actively participate and your MAGI is under $100k (phasing out to $0 by $150k); unused losses carry forward. On sale, claimed depreciation is recaptured at up to 25%, and gains may owe capital-gains tax (a 1031 exchange can defer both). Figures are a year-1 estimate at your 24.0% rate — not tax advice; consult a CPA.
Schools (NCES district)
- District
- Mountain View School District
- NCES district ID
- 0510200
- Math proficiency
- 34% ▼ -20.00%
- Reading proficiency
- 41% ▼ -13.00%
- Median HH income
- $31,281
- Composite
- 30.61/100
- National rank
- #6192
- State rank
- #107 of 238 in AR
Livability — Mountain View
- Score
- 58/100
- State rank
- #316
- US rank
- #20958
Category grades
Schools grade is shown separately in the Schools card above.
Census & demographics
- City population
- 7,650
- Population (ZIP)
- 7,650
Population outlook (Stone County) Hauer SSP2
- Today (2025)
- 12,440 people
- By 2030
- 12,372 · -0.5%
- By 2040
- 12,081 · -2.9%
- By 2050
- 11,628 · -6.5%
- By 2075
- 10,863 · -12.7%
- By 2100
- 9,420 · -24.3%
Race, ethnicity, and origin ACS 2023
- Neighborhood character
- Predominantly White (89%)
- Race & ethnicity
- White 89% Two or more races 6% Hispanic / Latino 3% Native American 1%
- Common ancestry
- Slovak 4% Iranian 3% Lithuanian 1%
- Foreign-born
- 1% · Canada
- Languages at home
- 97% English-only · German/W. Germanic 2% Spanish 1%
Political lean MEDSL · Stone
- 2024 margin
- Solid R (+61.7) · D 18.1% · R 79.7% · Other 2.2%
- 2008→2024 swing
- -25.3pp toward R · 2008: -36.4pp · 2024: -61.7pp
- All cycles
- 2024: R+61.7 2020: R+57.9 2016: R+52.3 2012: R+45.2 2008: R+36.4
Not yet ingested
- Civics
- —
Market trends
- HPI YoY
- ▼ -48.20%
- Current HPI
- 159.8996
- Rent YoY
- —
- Metro
- —
- State GDP YoY
- ▲ 3.80%
- F500 in state
- 10
Industry mix (Fortune 500 HQ in AR)
| Industry | F500 HQs | Revenue |
|---|---|---|
| Retail | 1 | $681B |
|
||
| Food / Agriculture | 1 | $53B |
|
||
| Retail / Energy | 1 | $22B |
|
||
| Transportation / Logistics | 1 | $12B |
|
||
| Energy | 1 | $4B |
|
||
Price history
+195.0% since first listed4 events — show timeline
- 2026-06-03 Listed $59,000 CARMLS
- 2017-07-05 Listing Removed — CARMLS
- 2017-04-05 Listed $27,000 CARMLS
- 2007-04-26 Sold (Public Records) $20,000 Public Records
Cash-flow waterfall
monthlySold comps — $/sqft
last 12 mo · ≤1 miLoading sold comps…