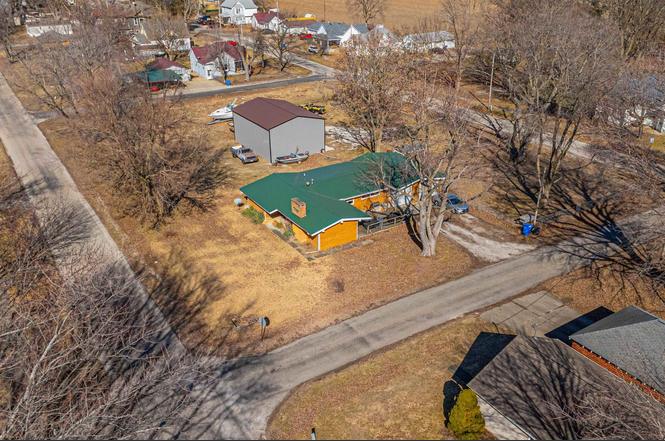
300 N Clinton St · Middletown, IL
Flood risk No data
- FEMA flood zone
- —
- Chance of flooding over 30 yrs
- —
- Est. flood insurance / yr
- —
Fire risk No data
- Est. fire insurance / yr
- —
Heat risk No data
- Hot days now (above threshold)
- —
- Hot days in 30 yrs
- —
Wind risk No data
- Chance of severe wind over 30 yrs
- —
Air-quality risk No data
- Unhealthy air days now
- —
- Unhealthy air days in 30 yrs
- —
Risk factors via First Street. Map © Google.
Why this score? — see what drove the D- grade
The composite is a weighted blend of 9 inputs, each scored 0–100. Each bar is that input's sub-score; the figure is the points it added to the 100-point composite (weight × sub-score).
- Cash flow +13.9/30.0
- Appreciation +5.0/10.0
- DSCR +4.2/10.0
- Livability +2.9/5.0
- 1% rule +2.8/10.0
- Rent growth +2.5/5.0
- Condition / age +2.5/5.0
- Schools +2.2/10.0
- ARV discount +0.0/15.0
$149,000
🖨 Deal sheet (PDF) 📄 Offer letter ✓ Due diligence
Listing remarks
Perched upon an entire city block (. 88 acre), this spacious wood sided 3-bedroom ranch style home has a lot to offer including a newer 30X40 3+ car detached garage with three 10X10 roll up overhead doors and amazing exterior space to roam! Interior of home offers an inviting foyer, spacious living room with a central fireplace, large updated eat-in kitchen with an exterior access point, three bedrooms -- two with hardwood flooring, large full hall bath, and convenient hall laundry facilities with adjacent mechanicals. Property also features a large front porch/deck, two car attached garage, some vinyl replacement windows, metal roof, large newer storage shed, fenced side yard, and an updat
Key facts
- Fenced side yard
- Front porch
- Water heater
Tags
Property features AI
Exterior
- Parking: 2-car garage (attached and detached; oversized)
- Utilities: Public water; Septic system
- Home design: Single-family residence; Built in 1955
- Construction: Metal roof; Crawl space basement
- Exterior features: Corner, level lot; Shed(s); Replacement windows; Outbuilding
Interior
- Kitchen: Kitchen on main level
- Bedrooms: 3 bedrooms — all on the main level; Bedroom 1: hardwood flooring, 14' x 11', egress window; Bedroom 2: carpet, 10' x 10', egress window; Bedroom 3: hardwood, 10' x 8', egress window
- Flooring: Hardwood; Carpet; Luxury vinyl plank
- Bathrooms: 1 full bathroom
- Heating & cooling: Forced air heating; Central air conditioning
- Interior features: Vaulted/cathedral/tray ceilings; Ceiling fan(s); Living room fireplace (1)
- Laundry & utility: Main-level laundry
Neighborhood map
What this means for you Summary
Snapshot
- This is a 3-bed/1.0-bath single-family listed at $149k.
Deal economics
- At list price, monthly cash flow is $16 ($186/yr) — positive.
- The deal already cash-flows at list — no discount required.
- To meet the 1% rule (rent ≥ 1% of price), the offer needs to be $117k (21.8% below list).
- Recommended offer: $117k (21.8% below list) — sets the bar for 1% rule.
Location & tenants
- Location reads 58/100 on livability (#1,088 in IL) — a working-class tenant base; expect higher turnover. Strengths: cost of living A+, housing A+; Watch: crime D-, amenities F, commute F.
- New Holland-Middletown Ed 88 (rural): math 15% / reading 25% proficiency, ranked #684 of 919 in IL (top 74%) — low school quality limits family demand, transient renter base, plan for 1-2y turnover.
- Zoned schools: New Holland-Middletown Elem Sch (math 5% / reading 24%, grade F, #1,259 of 2,056 statewide, top 62%, 75 students, 0% FRL); Lincoln Comm High School (math 21% / reading 27%, grade F, #304 of 693 statewide, top 44%, 786 students, 0% FRL) — zoned schools average 0% FRL vs 44% district-wide (44 pts lower); this property's tenant base skews higher-income than the district average.
- Market conditions: 5 active listings in the ZIP; 10 units permitted in Logan County in 2024 (0 in 5+ unit buildings).
Forward outlook
- In year one you build about $6k of equity ($1k loan paydown + $4k appreciation (3.0% local appreciation)).
- Logan County population projected at -11% by 2050 — secular population decline; favor cash flow + early exit over multi-decade hold.
- At projected returns (3.0% appreciation + 3.0% rent growth), your $42k cash investment doubles in ~6 years — after that, you're playing with house money.
- By year 7, paydown + projected appreciation supports a ~$35k cash-out refi (75% LTV) — recoverable capital for the next deal without selling this one.
Negotiation context
- It's been on market 117 days — a 9% lower offer ($136k) is reasonable based on typical stale-listing flexibility.
Risks & watch-outs
- Watch-outs: built in 1955 — expect roof / HVAC / electrical / plumbing capex.
Questions for the listing agent
- It's been on market 117 days. Have you received any prior offers? Is the seller open to a 22% concession, seller financing, or rate buy-down credit?
- Built in 1955 — when were the roof, HVAC, electrical panel, plumbing, and water heater last replaced?
- Why hasn't it sold? Are there any deal-killer items the seller is aware of (foundation, flood, title, zoning, code violations)?
- Is there a deadline driving the sale (1031 exchange, divorce, estate, relocation)? That informs how much negotiation room exists.
- Schools are F-rated, which usually means shorter tenancies and higher turnover. Who's the typical renter profile here, and what's been the actual vacancy rate?
- Crime grade is D in this area — have there been break-ins, vandalism, or insurance claims at this property in the last 3 years? What carrier currently insures it and at what premium?
- The area grade is low — what's the realistic commute time and amenity access for the typical tenant pool here? Any planned neighborhood developments (good or bad) we should know about?
- What's the average days-on-market for RENTAL listings here right now (not sales)? A rising rental-DOM trend means longer vacancies and softer asking-rent achievability than the comps imply.
- What's the recent tenant-quality profile in this submarket — average credit score on applications, eviction rate, late-payment / NSF rate, and stable-employment percentage? A property-management company in the area should have these aggregated.
- How much new for-sale + rental construction is in the pipeline within 1–3 miles? Heavy new supply typically softens prices + rents 12–24 months out; constrained supply supports both.
Investment metrics
- 1% rule
- 0.78% ✗
- Cap rate
- 6.42%
- Cash-on-cash
- 0.45%
- DSCR
- 1.02
- GRM
- 10.7
CMA / ARV
- ARV (on-the-fly)
- $104,085
- Comps found
- 3
Show comp detail 3 sales within ~0.75 mi
| Address | Dist | Beds/Ba | Sqft | Sold | Price | $/sf | Match |
|---|---|---|---|---|---|---|---|
| 101 S Anson St | 0.20mi | 3/1.0 | 1,300 (+1%) | 1mo | $62,000 | $48 | 88 |
| 603 N Madison St | 0.18mi | 3/1.0 | 1,230 (-4%) | 9mo | $100,000 | $81 | 77 |
| 306 N Anson St | 0.13mi | 2/2.0 (-1) | 1,248 (-3%) | 17mo | $114,000 | $91 | 66 |
Match score weights: distance 35% · size 25% · config 20% · recency 20%. Top-matched comps best support the ARV.
Projected returns pro-forma
3.0% appreciation · 3.0% rent growth · sell at horizon
- IRR
- 7.9%
- Equity multiple
- 1.45×
- Total profit
- $18,880
- Equity at exit
- $66,997
- IRR
- 10.5%
- Equity multiple
- 2.58×
- Total profit
- $65,766
- Equity at exit
- $103,250
Cash invested: $41,720 (down + closing). Projections, not guarantees.
Landlord ↔ Tenant lean methodology
- Overall (STATE)
- 43 Moderately Tenant-Leaning
- State Illinois
- 43 Moderately Tenant-Leaning · D+7
- County
- — inherits STATE
- City
- — inherits STATE
ZIP-level market 62666
- Active inventory
- 5
- Price-to-rent
- 10.7×
Monthly cashflow live
- Estimated rent
- $1,166 medium interval (Pro) →
- Mortgage (P&I)
- −$781
- Tax from tax record
- −$62 /mo · $743/yr
- Insurance
- −$62
- HOA
- −$0
- Vacancy / Maint / Mgmt
- −$245
- Net cashflow
- $16
Break-even live
Sensitivity live
| Price | -10% $100 | -5% $58 | +0% $16 | +5% $-27 | +10% $-69 |
|---|---|---|---|---|---|
| Rent | -10% $-77 | -5% $-31 | +0% $16 | +5% $62 | +10% $108 |
| Rate | -1.0pp $91 | -0.5pp $53 | base $16 | +0.5pp $-23 | +1.0pp $-62 |
UW: 25.0% down · 7.5% · 30yr · 1.5% tax · 5.0% vac · 8.0% maint · 8.0% mgmt
Financing live
Cash to close
- Down payment
- $37,250
- Closing costs
- $4,470
- Reserves months
- —
- Total cash needed
- —
Loan-product check · same deal, 3 products live
Conventional
25% down · 7.5% · 30yr
- Down + closing
- —
- Monthly P&I
- —
- Monthly cashflow
- —
- DSCR
- —
- Eligible?
- —
Personal DTI + credit; lowest rate.
DSCR
20% down · 8.5% · 30yr
- Down + closing
- —
- Monthly P&I
- —
- Monthly cashflow
- —
- DSCR
- —
- Eligible?
- —
No personal income docs; deal must DSCR.
Hard money
10% down · 12.0% · 12mo
- Down + closing
- —
- Monthly P&I
- —
- Monthly cashflow
- —
- DSCR
- —
- Eligible?
- —
Short-term bridge; refi at stabilization.
Listing history 20 events
-
2026-06-21days on market $149,000 Active 117 DOM
-
2026-06-21days on market $149,000 Active 116 DOM
-
2026-06-18days on market $149,000 Active 114 DOM
-
2026-06-17days on market $149,000 Active 113 DOM
-
2026-06-16days on market $149,000 Active 112 DOM
-
2026-06-15days on market $149,000 Active 111 DOM
-
2026-06-13days on market $149,000 Active 109 DOM
-
2026-06-12days on market $149,000 Active 108 DOM
-
2026-06-09days on market $149,000 Active 105 DOM
-
2026-06-08days on market $149,000 Active 104 DOM
-
2026-06-07days on market $149,000 Active 103 DOM
-
2026-06-05days on market $149,000 Active 101 DOM
-
2026-06-04days on market $149,000 Active 99 DOM
-
2026-06-02days on market $149,000 Active 98 DOM
-
2026-06-01days on market $149,000 Active 97 DOM
-
2026-05-31days on market $149,000 Active 96 DOM
-
2026-05-31days on market $149,000 Active 95 DOM
-
2026-04-15price $149,000
-
2026-03-20price $159,000
-
2026-02-22$170,000 Active
ⓘ Source: listings_history table (triggers on properties + properties_extension) + one-shot
backfill from property_details.listing_events for pre-trigger history.
Tax reassessment forecast IL · Partial reset (capped growth)
- Current annual tax
- $743 · $62/mo
- Projected year-2 tax
- $2,062 · $172/mo
- Expected delta
- +$1,320/yr (+$110/mo · 177.8%)
ⓘ Screening estimate from a state-policy table — verify with the county assessor before closing.
Nearby sold comps map
Loading sold comps map…
Walkable amenities ~0.75 mi
Loading nearby amenities…
Taxation est. · year 1
- Rental income
- $13,988
- − Mortgage interest
- −$8,346
- − Property taxes
- −$743
- − Insurance
- −$745
- − Repairs & maintenance
- −$1,119
- − Management
- −$1,119
- − Depreciation
- −$4,335
- Taxable loss
- −$2,419
- Est. tax savings @ 24.0%
- +$580
- After-tax cash flow
- $767/yr
For passive investors: Depreciation is non-cash, so a rental often shows a tax loss while cash-flowing — sheltering income. Rental losses are passive: they offset passive income freely, and up to $25,000/yr can offset ordinary (W-2) income if you actively participate and your MAGI is under $100k (phasing out to $0 by $150k); unused losses carry forward. On sale, claimed depreciation is recaptured at up to 25%, and gains may owe capital-gains tax (a 1031 exchange can defer both). Figures are a year-1 estimate at your 24.0% rate — not tax advice; consult a CPA.
Schools (NCES district)
- District
- New Holland-Middletown Ed 88
- NCES district ID
- 1700103
- Math proficiency
- 15% ▲ 5.00%
- Reading proficiency
- 25% ▲ 5.00%
- Median HH income
- $55,706
- Composite
- 21.68/100
- National rank
- #13592
- State rank
- #684 of 919 in IL
Livability — Middletown
- Score
- 58/100
- State rank
- #1088
- US rank
- #20717
Category grades
Schools grade is shown separately in the Schools card above.
Census & demographics
- Census place
- Middletown, IL
- Population (ZIP)
- 483
Population outlook (Logan County) Hauer SSP2
- Today (2025)
- 28,066 people
- By 2030
- 27,370 · -2.5%
- By 2040
- 26,078 · -7.1%
- By 2050
- 24,908 · -11.3%
- By 2075
- 22,504 · -19.8%
- By 2100
- 19,226 · -31.5%
Race, ethnicity, and origin ACS 2023
- Neighborhood character
- Predominantly White (98%)
- Race & ethnicity
- White 98% Two or more races 2%
- Common ancestry
- Slovak 6% Iranian 2% Italian 1%
- Languages at home
- 99% English-only · German/W. Germanic 1%
Political lean MEDSL · Logan
- 2024 margin
- Solid R (+41.5) · D 28.2% · R 69.8% · Other 2.0%
- 2008→2024 swing
- -24.6pp toward R · 2008: -16.9pp · 2024: -41.5pp
- All cycles
- 2024: R+41.5 2020: R+39.8 2016: R+40.1 2012: R+32.1 2008: R+16.9
Not yet ingested
- Civics
- —
Market trends
- HPI YoY
- —
- Current HPI
- —
- Rent YoY
- —
- Metro
- —
- State GDP YoY
- ▲ 1.59%
- F500 in state
- 60
Industry mix (Fortune 500 HQ in IL)
| Industry | F500 HQs | Revenue |
|---|---|---|
| Insurance | 4 | $201B |
|
||
| Consumer Goods | 4 | $87B |
|
||
| Industrial Machinery | 3 | $64B |
|
||
| Healthcare | 2 | $55B |
|
||
| Retail / Pharmacy | 1 | $148B |
|
||
| Agriculture / Food | 1 | $86B |
|
||
Price history
-12.4% since first listed3 events — show timeline
- 2026-04-15 Price Changed $149,000 RMLSA as Distributed by MLS Grid
- 2026-03-20 Price Changed $159,000 RMLSA as Distributed by MLS Grid
- 2026-02-22 Listed $170,000 RMLSA as Distributed by MLS Grid
Property tax history
-1.3%/yrLatest (2022): $743 · +0.9% YoY. Source: county tax records.
Cash-flow waterfall
monthlySold comps — $/sqft
last 12 mo · ≤1 miLoading sold comps…