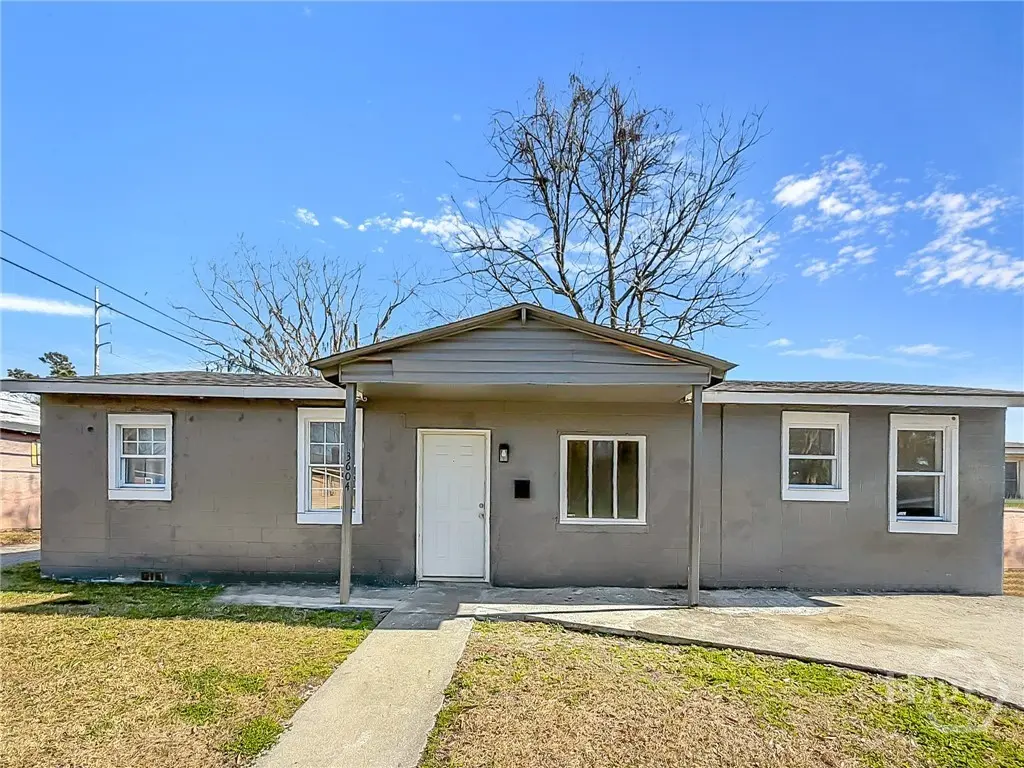
3604 Stevens St · Savannah, GA
Flood risk 1/10 · Minimal
- FEMA flood zone
- X (unshaded)
- Chance of flooding over 30 yrs
- 0.0%
- Est. flood insurance / yr
- $507 – $1,088
Fire risk 2/10 · Minimal
- Est. fire insurance / yr
- $963 – $1,789
Heat risk 9/10 · Severe
- Hot days now (above 108°F)
- 7 days/yr
- Hot days in 30 yrs
- 18 days/yr
Wind risk 9/10 · Severe
- Chance of severe wind over 30 yrs
- 99.0%
Air-quality risk 2/10 · Minimal
- Unhealthy air days now
- 2 days/yr
- Unhealthy air days in 30 yrs
- 2 days/yr
Risk factors via First Street. Map © Google.
Why this score? — see what drove the D- grade
The composite is a weighted blend of 9 inputs, each scored 0–100. Each bar is that input's sub-score; the figure is the points it added to the 100-point composite (weight × sub-score).
- Cash flow +17.5/30.0
- DSCR +5.5/10.0
- Livability +4.3/5.0
- 1% rule +3.8/10.0
- Condition / age +2.5/5.0
- Rent growth +2.3/5.0
- Schools +2.0/10.0
- ARV discount +0.0/15.0
- Appreciation +0.0/10.0
$185,000
🖨 Deal sheet (PDF) 📄 Offer letter ✓ Due diligence
Listing remarks MLS
BRING OFFERS TODAY, THIS SELLER IS READY TO SELL!!! - THIS NICELY RENOVATED HOME IS IN THE PERFECT LOCATION AND IS WAITING FOR YOU!!! JUST 5 MINS TO THE SCAD VICTORY VILLAGE AREA, WITH 3 BEDROOMS, 2 BATHROOMS AND OVER 1100 SQFT, THIS HOME HAS A FAMILY ROOM, ,DINING ROOM AND AN OPEN KITCHEN. THE KITCHEN AND BOTH BATHROOMS ARE NEW PLUS THERE’S NO CARPET INSIDE.
Key facts
- Renovated home
- New kitchen
- Family room
Tags
Neighborhood map
What this means for you Summary
Snapshot
- This is a 2-bed/1.0-bath other listed at $185k.
Deal economics
- At list price, monthly cash flow is $141 ($2k/yr) — positive.
- The deal already cash-flows at list — no discount required.
- To meet the 1% rule (rent ≥ 1% of price), the offer needs to be $163k (11.9% below list).
- Recommended offer: $163k (11.9% below list) — sets the bar for 1% rule.
- Cap rate 7.2% vs local median 4.0% in Savannah — top-decile yield for the area; either an underpriced asset or a hidden risk that comps aren't pricing in. Stress-test before assuming the spread holds.
Location & tenants
- Location reads 86/100 on livability (#1 in GA, #397 nationally) — a professional / high-income tenant draw. Strengths: crime A+, amenities A+, commute A+; Watch: employment D, schools F.
- Savannah-Chatham County (urban): math 20% / reading 26% proficiency, ranked #134 of 174 in GA (top 77%) — low school quality limits family demand, transient renter base, plan for 1-2y turnover.
- Market conditions: Rents soft (-0.7%/yr); 276 active listings in the ZIP; 40 comparable units currently listed for rent nearby; rentals lingering (median 46d on market — plan ~5-8 weeks vacancy on turnover, expect pricing pressure); 50% of comp listings sitting > 30 days — soft ceiling on asking rent; 2,694 units permitted in Chatham County in 2024 (973 in 5+ unit buildings).
Forward outlook
- Local home prices are declining (-3.0%/yr); year-one equity from $1k of loan paydown is wiped out by about $6k of value loss. Plan a longer hold.
- Chatham County population projected at +33% by 2050 — long-run rental-demand tailwind backs the buy-and-hold thesis.
Negotiation context
- It's been on market 118 days — a 9% lower offer ($168k) is reasonable based on typical stale-listing flexibility.
- 2 sale attempts since 16y ago with the ask held roughly flat each time — persistent listings suggest the price (not the market) is what's stuck; bring a comps-based counter.
- Current owner paid $45k; list at $185k implies a 311% gain — meaningful room to come down on a strong offer.
Risks & watch-outs
- Watch-outs: built in 1945 — expect roof / HVAC / electrical / plumbing capex.
- Climate carrying-cost: severe wind risk, 99% chance of damaging wind over 30y; extreme-heat days projected 7→18/yr by 2055 (HVAC capex compounding) — expect insurance premiums to compound above CPI over the hold.
Questions for the listing agent
- It's been on market 118 days. Have you received any prior offers? Is the seller open to a 12% concession, seller financing, or rate buy-down credit?
- Built in 1945 — when were the roof, HVAC, electrical panel, plumbing, and water heater last replaced?
- Why hasn't it sold? Are there any deal-killer items the seller is aware of (foundation, flood, title, zoning, code violations)?
- Is there a deadline driving the sale (1031 exchange, divorce, estate, relocation)? That informs how much negotiation room exists.
- Schools are F-rated, which usually means shorter tenancies and higher turnover. Who's the typical renter profile here, and what's been the actual vacancy rate?
- The area grade is low — what's the realistic commute time and amenity access for the typical tenant pool here? Any planned neighborhood developments (good or bad) we should know about?
- What's the average days-on-market for RENTAL listings here right now (not sales)? A rising rental-DOM trend means longer vacancies and softer asking-rent achievability than the comps imply.
- What's the recent tenant-quality profile in this submarket — average credit score on applications, eviction rate, late-payment / NSF rate, and stable-employment percentage? A property-management company in the area should have these aggregated.
- How much new for-sale + rental construction is in the pipeline within 1–3 miles? Heavy new supply typically softens prices + rents 12–24 months out; constrained supply supports both.
Investment metrics
- 1% rule
- 0.88% ✗
- Cap rate
- 7.21%
- Cash-on-cash
- 3.26%
- DSCR
- 1.15
- GRM
- 9.5
CMA / ARV
- ARV (median comp)
- $148,160
- List price
- $185,000
- Delta
- 24.87%
- Verdict
- OVERPRICED
- Comps
- 20 within 1.0 mi
Projected returns pro-forma
-3.0% appreciation · 0.0% rent growth · sell at horizon
- IRR
- -14.3%
- Equity multiple
- 0.50×
- Total profit
- $-25,847
- Equity at exit
- $27,584
- IRR
- -10.8%
- Equity multiple
- 0.43×
- Total profit
- $-29,652
- Equity at exit
- $15,995
Cash invested: $51,800 (down + closing). Projections, not guarantees.
Landlord ↔ Tenant lean methodology
- Overall (STATE)
- 90 Strongly Landlord-Friendly
- State Georgia
- 90 Strongly Landlord-Friendly · R+3
- County
- — inherits STATE
- City
- — inherits STATE
ZIP-level market 31405
- Home prices YoY
- -32.4%
- Rents YoY
- -0.7%
- Active inventory
- 276
- Price-to-rent
- 9.5×
Monthly cashflow live
- Estimated rent
- $1,630 high interval (Pro) →
- Mortgage (P&I)
- −$970
- Tax from tax record
- −$100 /mo · $1,194/yr
- Insurance
- −$77
- HOA
- −$0
- Vacancy / Maint / Mgmt
- −$342
- Net cashflow
- $141
Break-even live
Sensitivity live
| Price | -10% $245 | -5% $193 | +0% $141 | +5% $88 | +10% $36 |
|---|---|---|---|---|---|
| Rent | -10% $12 | -5% $76 | +0% $141 | +5% $205 | +10% $269 |
| Rate | -1.0pp $234 | -0.5pp $188 | base $141 | +0.5pp $93 | +1.0pp $44 |
UW: 25.0% down · 7.5% · 30yr · 1.5% tax · 5.0% vac · 8.0% maint · 8.0% mgmt
Financing live
Cash to close
- Down payment
- $46,250
- Closing costs
- $5,550
- Reserves months
- —
- Total cash needed
- —
Loan-product check · same deal, 3 products live
Conventional
25% down · 7.5% · 30yr
- Down + closing
- —
- Monthly P&I
- —
- Monthly cashflow
- —
- DSCR
- —
- Eligible?
- —
Personal DTI + credit; lowest rate.
DSCR
20% down · 8.5% · 30yr
- Down + closing
- —
- Monthly P&I
- —
- Monthly cashflow
- —
- DSCR
- —
- Eligible?
- —
No personal income docs; deal must DSCR.
Hard money
10% down · 12.0% · 12mo
- Down + closing
- —
- Monthly P&I
- —
- Monthly cashflow
- —
- DSCR
- —
- Eligible?
- —
Short-term bridge; refi at stabilization.
Rent comps 40 comps
| Address | Beds | Baths | Sqft | Rent | $/sqft | DOM | Units | Dist |
|---|---|---|---|---|---|---|---|---|
| 1014 W 53rd St Savannah, GA | 3.0 | 2.0 | 1048 | $1,600 | $1.53 | 15d | 1 | 0.03mi |
| 3302 Bulloch St Savannah, GA | 2.0 | 1.0 | 744 | $995 | $1.34 | 25d | 1 | 0.21mi |
| 601 W 54th St Savannah, GA | 1.0–4.0 | 1.0–2.0 | 881 | $1,417 | $1.61 | 25d | 1 | 0.27mi |
| 1003 W 46th St Savannah, GA | 3.0 | 1.0 | 1100 | $1,625 | $1.48 | 15d | 1 | 0.37mi |
| 628 W 48th St Savannah, GA | 3.0 | 1.0 | 975 | $1,699 | $1.74 | 15d | 1 | 0.37mi |
| 3212 Burroughs St Savannah, GA | 3.0 | 1.0 | 814 | $1,400 | $1.72 | 25d | 1 | 0.40mi |
| 3708 Montgomery St Savannah, GA | 2.0 | 1.0 | 725 | $1,400 | $1.93 | 15d | 1 | 0.45mi |
| 119 W 52nd St Savannah, GA | 2.0 | 1.0 | 1020 | $1,800 | $1.76 | 45d | 1 | 0.48mi |
| 4401 Meding St Savannah, GA | 3.0 | 2.0 | 1030 | $1,500 | $1.46 | 25d | 1 | 0.49mi |
| 2705 Stevens St Savannah, GA | 3.0 | 1.0 | 900 | $1,585 | $1.76 | 45d | 1 | 0.52mi |
| 1005 W Victory Dr Savannah, GA | 3.0 | 2.0 | 1056 | $1,950 | $1.85 | 25d | 1 | 0.53mi |
| 607 W 44th St Unit B Savannah, GA | 3.0 | 1.0 | 1050 | $1,650 | $1.57 | 45d | 1 | 0.55mi |
| 118 W 56th St Savannah, GA | 2.0 | 1.0 | 936 | $1,625 | $1.74 | 15d | 1 | 0.56mi |
| 20 W 54th St Savannah, GA | 2.0 | 1.0 | 950 | $1,200 | $1.26 | 25d | 1 | 0.61mi |
| 4 W 53rd St Unit 4 Savannah, GA | 2.0 | 1.0 | 960 | $1,400 | $1.46 | 45d | 1 | 0.63mi |
| 1109 W 41st St Savannah, GA | 3.0 | 1.0 | 960 | $1,620 | $1.69 | 45d | 1 | 0.64mi |
| 12 W 51st St Savannah, GA | 2.0 | 1.0 | 932 | $2,500 | $2.68 | 25d | 1 | 0.64mi |
| 2 W 53rd St #3 Savannah, GA | 2.0 | 1.0 | 1122 | $1,750 | $1.56 | 45d | 1 | 0.64mi |
| 111 W 48th St Unit A Savannah, GA | 1.0 | 1.0 | 750 | $1,500 | $2.00 | 15d | 1 | 0.66mi |
| 1011 W 40th St Savannah, GA | 3.0 | 2.0 | 1125 | $1,995 | $1.77 | 15d | 1 | 0.68mi |
| 3301 Bull St Unit 4 Savannah, GA | 2.0 | 1.0 | 1000 | $1,750 | $1.75 | 25d | 1 | 0.70mi |
| 2613 Montgomery St Unit B204 Savannah, GA | 1.0 | 1.0 | 578 | $2,168 | $3.75 | 45d | 1 | 0.70mi |
| 2613 Montgomery St Unit A203 Savannah, GA | 1.0 | 1.0 | 587 | $2,201 | $3.75 | 45d | 1 | 0.70mi |
| 2613 Montgomery St Unit A205 Savannah, GA | 1.0 | 1.0 | 561 | $2,300 | $4.10 | 45d | 1 | 0.70mi |
| 2613 Montgomery St Unit A204 Savannah, GA | 1.0 | 1.0 | 587 | $2,671 | $4.55 | 45d | 1 | 0.70mi |
| 2613 Montgomery St Unit A206 Savannah, GA | 1.0 | 1.0 | 561 | $2,104 | $3.75 | 45d | 1 | 0.70mi |
| 2613 Montgomery St Unit A208 Savannah, GA | 1.0 | 1.0 | 718 | $2,836 | $3.95 | 45d | 1 | 0.70mi |
| 2613 Montgomery St Unit A207 Savannah, GA | 1.0 | 1.0 | 719 | $2,876 | $4.00 | 45d | 1 | 0.70mi |
| 2613 Montgomery St Unit A212 Savannah, GA | 1.0 | 1.0 | 719 | $2,948 | $4.10 | 45d | 1 | 0.70mi |
| 2613 Montgomery St Unit A211 Savannah, GA | 1.0 | 1.0 | 718 | $3,411 | $4.75 | 45d | 1 | 0.70mi |
| 2613 Montgomery St Unit B303 Savannah, GA | 2.0 | 2.0 | 879 | $3,472 | $3.95 | 45d | 1 | 0.70mi |
| 2613 Montgomery St Savannah, GA | 1.0 | 1.0 | 549 | $2,348 | $4.27 | 25d | 15 | 0.70mi |
| 3211 Bull St Unit A Savannah, GA | 2.0 | 1.0 | 1000 | $1,975 | $1.98 | 45d | 1 | 0.71mi |
| 4909 Meding St Savannah, GA | 2.0 | 1.0 | 720 | $1,350 | $1.88 | 45d | 1 | 0.73mi |
| 7 Pearl St Unit 5 Savannah, GA | 1.0 | 1.0 | 550 | $1,500 | $2.73 | 25d | 1 | 0.76mi |
| 11 W 45th St Unit B Savannah, GA | 1.0 | 1.0 | 900 | $1,975 | $2.19 | 15d | 1 | 0.76mi |
| 2604 Jefferson St Savannah, GA | 2.0 | 1.0 | 910 | $1,900 | $2.09 | 45d | 1 | 0.77mi |
| 2221 Harden St Savannah, GA | 3.0 | 1.0 | 1000 | $1,550 | $1.55 | 45d | 1 | 0.78mi |
| 2203 Harden St Unit A Savannah, GA | 3.0 | 1.0 | 900 | $2,100 | $2.33 | 15d | 1 | 0.80mi |
| 2123 Harden St Savannah, GA | 2.0 | 1.0 | 1000 | $1,550 | $1.55 | 25d | 1 | 0.81mi |
Listing history 11 events
-
2026-06-05statusdays on market $185,000 Pending 118 DOM
-
2026-06-03days on market $185,000 Active Under Contract 117 DOM
-
2026-06-02days on market $185,000 Active Under Contract 116 DOM
-
2026-06-01days on market $185,000 Active Under Contract 115 DOM
-
2026-05-31days on market $185,000 Active Under Contract 114 DOM
-
2026-05-30days on market $185,000 Active Under Contract 113 DOM
-
2026-02-07$185,000 Active 367-char remark
Show marketing remark (367 chars)
BRING OFFERS TODAY, THIS SELLER IS READY TO SELL!!! - THIS NICELY RENOVATED HOME IS IN THE PERFECT LOCATION AND IS WAITING FOR YOU!!! JUST 5 MINS TO THE SCAD VICTORY VILLAGE AREA, WITH 3 BEDROOMS, 2 BATHROOMS AND OVER 1100 SQFT, THIS HOME HAS A FAMILY ROOM, ,DINING ROOM AND AN OPEN KITCHEN. THE KITCHEN AND BOTH BATHROOMS ARE NEW PLUS THERE’S NO CARPET INSIDE.
-
2021-06-11soldstatus $45,000
-
2011-08-16soldstatus $10,000
-
2010-09-29historical
-
2010-08-25$19,500
ⓘ Source: listings_history table (triggers on properties + properties_extension) + one-shot
backfill from property_details.listing_events for pre-trigger history.
Tax reassessment forecast GA · Resets to sale price
- Current annual tax
- $1,194 · $100/mo
- Projected year-2 tax
- $1,702 · $142/mo
- Expected delta
- +$508/yr (+$42/mo · 42.5%)
ⓘ Screening estimate from a state-policy table — verify with the county assessor before closing.
Climate risk First Street
- Flood 1/10 Low FEMA zone X (unshaded) · 0% chance over 30 yrs
- Wildfire 2/10 Low
- Heat 9/10 Extreme 7 d/yr ≥108°F today · 18 d/yr by 30 yrs out
- Wind 9/10 Extreme 99% chance of damaging wind over 30 yrs
- Air quality 2/10 Low 2 unhealthy d/yr today · 2 by 30 yrs out
Nearby sold comps map
Loading sold comps map…
Walkable amenities ~0.75 mi
Loading nearby amenities…
Taxation est. · year 1
- Rental income
- $19,557
- − Mortgage interest
- −$10,363
- − Property taxes
- −$1,194
- − Insurance
- −$925
- − Repairs & maintenance
- −$1,565
- − Management
- −$1,565
- − Depreciation
- −$5,382
- Taxable loss
- −$1,436
- Est. tax savings @ 24.0%
- +$345
- After-tax cash flow
- $2,034/yr
For passive investors: Depreciation is non-cash, so a rental often shows a tax loss while cash-flowing — sheltering income. Rental losses are passive: they offset passive income freely, and up to $25,000/yr can offset ordinary (W-2) income if you actively participate and your MAGI is under $100k (phasing out to $0 by $150k); unused losses carry forward. On sale, claimed depreciation is recaptured at up to 25%, and gains may owe capital-gains tax (a 1031 exchange can defer both). Figures are a year-1 estimate at your 24.0% rate — not tax advice; consult a CPA.
Schools (NCES district)
- District
- Savannah-Chatham County
- NCES district ID
- 1301020
- Math proficiency
- 20% ▼ -11.00%
- Reading proficiency
- 26% ▼ -5.00%
- Median HH income
- $47,443
- Composite
- 20.14/100
- National rank
- #8639
- State rank
- #134 of 174 in GA
Livability — Savannah
- Score
- 86/100
- State rank
- #1
- US rank
- #397
Category grades
Schools grade is shown separately in the Schools card above.
Census & demographics
- Census place
- Savannah, GA
- County
- Chatham County · 271,602 people
- City population
- 216,564
- Metro
- Savannah, GA
- Population (ZIP)
- 40,764
- Household income
- $65,710
- Rent vs Own
- Severe rent burden
- 1712.0
Population outlook (Chatham County) Hauer SSP2
- Today (2025)
- 332,584 people
- By 2030
- 355,508 · +6.9%
- By 2040
- 400,030 · +20.3%
- By 2050
- 443,019 · +33.2%
- By 2075
- 534,579 · +60.7%
- By 2100
- 583,863 · +75.6%
Race, ethnicity, and origin ACS 2023
- Neighborhood character
- Diverse neighborhood (Simpson 0.63)
- Race & ethnicity
- Black 47% White 38% Hispanic / Latino 8% Two or more races 6% Asian 3%
- Hispanic origin (detail)
- Mexican 3% Puerto Rican 1%
- Common ancestry
- Italian 1% Slovak 1% Romanian 1%
- Foreign-born
- 7% · Canada, China, Jamaica
- Languages at home
- 88% English-only · Spanish 6% Other Indo-European 2% Chinese 1%
Political lean MEDSL · Chatham
- 2024 margin
- D (+18.0) · D 58.6% · R 40.6%
- 2008→2024 swing
- +3.6pp toward D · 2008: 14.4pp · 2024: 18.0pp
- All cycles
- 2024: D+18.0 2020: D+18.8 2016: D+14.5 2012: D+12.0 2008: D+14.4
Not yet ingested
- Civics
- —
Market trends
- HPI YoY
- ▼ -147.33%
- Current HPI
- 307.4442
- Rent YoY
- ▼ -0.66%
- Metro
- Savannah, GA
- State GDP YoY
- ▲ 2.66%
- F500 in state
- 28
Industry mix (Fortune 500 HQ in GA)
| Industry | F500 HQs | Revenue |
|---|---|---|
| Paper / Packaging | 2 | $29B |
|
||
| Retail | 1 | $160B |
|
||
| Transportation / Logistics | 1 | $91B |
|
||
| Airlines | 1 | $62B |
|
||
| Consumer Goods | 1 | $47B |
|
||
| Utilities | 1 | $25B |
|
||
Price history
+848.7% since first listed5 events — show timeline
- 2026-02-07 Listed $185,000 Hive MLS
- 2021-06-11 Sold (Public Records) $45,000 Public Records
- 2011-08-16 Sold (Public Records) $10,000 Public Records
- 2010-09-29 Listing Removed — Hive MLS
- 2010-08-25 Listed $19,500 Hive MLS
Property tax history
+11.8%/yrLatest (2025): $1,194 · +80.5% YoY. Source: county tax records.
Cash-flow waterfall
monthlySold comps — $/sqft
last 12 mo · ≤1 miLoading sold comps…