5390 NE 134th Ave · East Bronson, FL
Flood risk 1/10 · Minimal
- FEMA flood zone
- X (unshaded)
- Chance of flooding over 30 yrs
- 0.0%
- Est. flood insurance / yr
- $507 – $1,088
Fire risk 6/10 · Moderate
- Est. fire insurance / yr
- $947 – $1,759
Heat risk 8/10 · Major
- Hot days now (above 107°F)
- 7 days/yr
- Hot days in 30 yrs
- 21 days/yr
Wind risk 9/10 · Severe
- Chance of severe wind over 30 yrs
- 99.0%
Air-quality risk 2/10 · Minimal
- Unhealthy air days now
- 2 days/yr
- Unhealthy air days in 30 yrs
- 2 days/yr
Risk factors via First Street. Map © Google.
Why this score? — see what drove the D- grade
The composite is a weighted blend of 9 inputs, each scored 0–100. Each bar is that input's sub-score; the figure is the points it added to the 100-point composite (weight × sub-score).
- Cash flow +11.7/30.0
- ARV discount +7.5/15.0
- Schools +3.6/10.0
- DSCR +3.4/10.0
- 1% rule +3.1/10.0
- Livability +3.1/5.0
- Rent growth +2.5/5.0
- Condition / age +2.5/5.0
- Appreciation +0.0/10.0
$234,900
🖨 Deal sheet (PDF) 📄 Offer letter ✓ Due diligence
Listing remarks
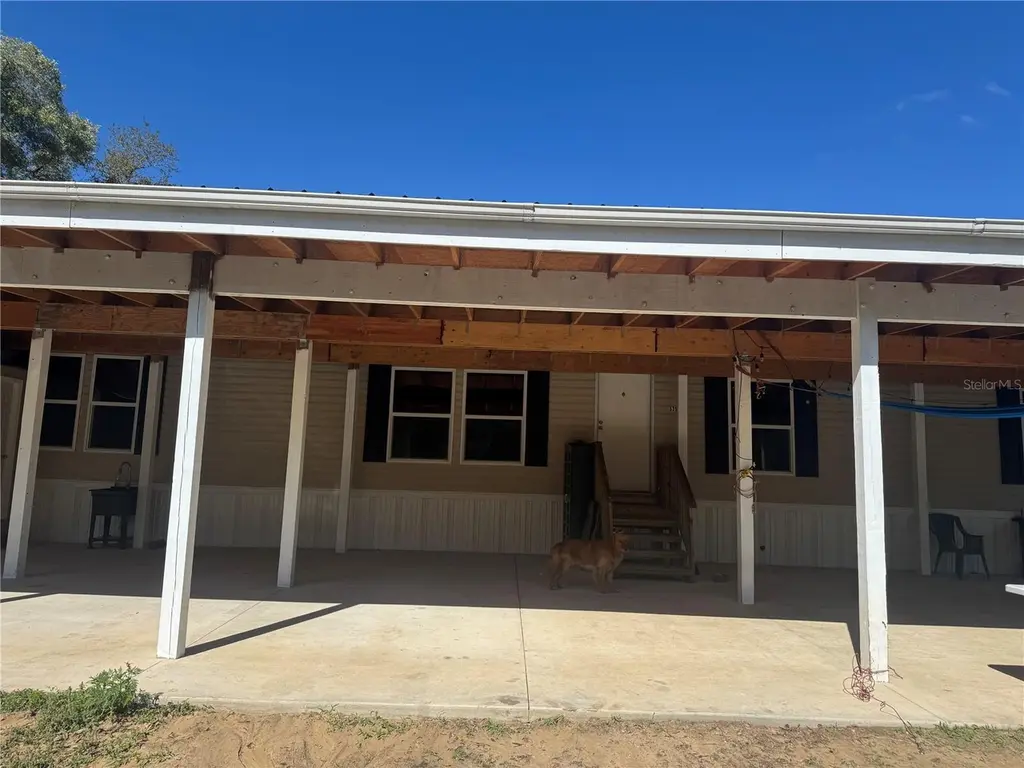
GREAT PROPERTY CENTRALLY LOCATED OFF HIGHWAY 27 CLOSE TO WILLISTON AND BRONSON . 33 ACRES 2024 DOUBLE WIDE HOME WITH 5 BEDROOMS 3 FULL BATHROOMS LAUNDRY ROOM AMPLE OPEN KITCHEN LOTS OF CLOSETS FOR STORAGE ALL VINYL FLOORS AND AN EXTERIOR COVERED FRONT PORCH 20X64 GREAT FOR FAMILY ENTERTAINING AND ENJOY THE FLORIDA WEATHER. MAKE IT YOURS TODAY!
Key facts
- Ample open kitchen
- 0.33 acre lot
- 3 parking spots
Tags
Property features AI
Finance
- Other: Homestead exempt; Lot approx. 0.33 acres (quarter to less than half acre)
Exterior
- Parking: Carport with 3 spaces
- Utilities: Well water; Septic tank; Cable available; Electricity available
- Home design: Residential manufactured home (double wide); One level; East-facing
- Construction: Vinyl siding; Shingle roof; Block foundation; Crawlspace foundation; Built as double wide manufactured home
- Exterior features: Balcony; Dirt road access
Interior
- Kitchen: Dishwasher; Microwave; Range; Refrigerator
- Bedrooms: 5 bedrooms
- Flooring: Vinyl
- Bathrooms: 3 full bathrooms
- Heating & cooling: Central heating; Central air conditioning
- Interior features: Eat-in kitchen; Living room/dining room combo
- Laundry & utility: Dedicated laundry room
Neighborhood map
What this means for you Summary
Snapshot
- This is a 5-bed/2.0-bath manufactured listed at $235k.
Deal economics
- At list price, monthly cash flow is $-68 ($-820/yr) — negative.
- To cash-flow at today's rent, offer at most $223k (5.1% below list).
- To meet the 1% rule (rent ≥ 1% of price), the offer needs to be $189k (19.4% below list).
- Recommended offer: $189k (19.4% below list) — sets the bar for 1% rule.
- Cap rate 5.9% vs local median 3.4% in East Bronson — top-decile yield for the area; either an underpriced asset or a hidden risk that comps aren't pricing in. Stress-test before assuming the spread holds.
Location & tenants
- Location reads 62/100 on livability (#768 in FL) — a middle-class / working-renter tenant base. Strengths: crime A+, cost of living A+, housing A+; Watch: health & safety D, schools F, amenities F.
- Levy (rural): math 45% / reading 43% proficiency, ranked #54 of 73 in FL (top 74%) — families likely to look elsewhere, expect single-tenant / working-renter base with shorter leases; 62% free/reduced lunch — lower-income household profile, screen leases tightly.
- Market conditions: 358 active listings in the ZIP; 199 units permitted in Levy County in 2024 (0 in 5+ unit buildings).
Forward outlook
- Local home prices are declining (-3.0%/yr); year-one equity from $2k of loan paydown is wiped out by about $7k of value loss. Plan a longer hold.
- Levy County population projected at -28% by 2050 — secular population decline; favor cash flow + early exit over multi-decade hold.
Negotiation context
- It's been on market 76 days — a 6% lower offer ($221k) is reasonable based on typical stale-listing flexibility.
- Current owner paid $1k; list at $235k implies a 16946% gain — meaningful room to come down on a strong offer.
Risks & watch-outs
- Climate carrying-cost: severe wind risk, 99% chance of damaging wind over 30y; major wildfire risk; extreme-heat days projected 7→21/yr by 2055 (HVAC capex compounding) — expect insurance premiums to compound above CPI over the hold.
Questions for the listing agent
- What do current leases actually rent for vs. the listed asking? Can we see a recent rent roll and the last 12 months of T-12 income?
- It's been on market 76 days. Have you received any prior offers? Is the seller open to a 19% concession, seller financing, or rate buy-down credit?
- Why hasn't it sold? Are there any deal-killer items the seller is aware of (foundation, flood, title, zoning, code violations)?
- Is there a deadline driving the sale (1031 exchange, divorce, estate, relocation)? That informs how much negotiation room exists.
- Schools are F-rated, which usually means shorter tenancies and higher turnover. Who's the typical renter profile here, and what's been the actual vacancy rate?
- The area grade is low — what's the realistic commute time and amenity access for the typical tenant pool here? Any planned neighborhood developments (good or bad) we should know about?
- What's the average days-on-market for RENTAL listings here right now (not sales)? A rising rental-DOM trend means longer vacancies and softer asking-rent achievability than the comps imply.
- What's the recent tenant-quality profile in this submarket — average credit score on applications, eviction rate, late-payment / NSF rate, and stable-employment percentage? A property-management company in the area should have these aggregated.
- How much new for-sale + rental construction is in the pipeline within 1–3 miles? Heavy new supply typically softens prices + rents 12–24 months out; constrained supply supports both.
Investment metrics
- 1% rule
- 0.81% ✗
- Cap rate
- 5.94%
- Cash-on-cash
- -1.25%
- DSCR
- 0.94
- GRM
- 10.3
CMA / ARV
No comps found within radius.
Projected returns pro-forma
-3.0% appreciation · 3.0% rent growth · sell at horizon
- IRR
- -18.4%
- Equity multiple
- 0.35×
- Total profit
- $-42,426
- Equity at exit
- $35,024
- IRR
- -10.7%
- Equity multiple
- 0.35×
- Total profit
- $-42,583
- Equity at exit
- $20,310
Cash invested: $65,772 (down + closing). Projections, not guarantees.
Landlord ↔ Tenant lean methodology
- Overall (STATE)
- 87 Strongly Landlord-Friendly
- State Florida
- 87 Strongly Landlord-Friendly · R+3
- County
- — inherits STATE
- City
- — inherits STATE
ZIP-level market 32696
- Home prices YoY
- -6.2%
- Active inventory
- 358
- Price-to-rent
- 10.3×
Monthly cashflow live
- Estimated rent
- $1,893 medium interval (Pro) →
- Mortgage (P&I)
- −$1,232
- Tax from tax record
- −$234 /mo · $2,805/yr
- Insurance
- −$98
- HOA
- −$0
- Vacancy / Maint / Mgmt
- −$397
- Net cashflow
- $-68
Break-even live
Sensitivity live
| Price | -10% $65 | -5% $-2 | +0% $-68 | +5% $-135 | +10% $-201 |
|---|---|---|---|---|---|
| Rent | -10% $-218 | -5% $-143 | +0% $-68 | +5% $6 | +10% $81 |
| Rate | -1.0pp $50 | -0.5pp $-9 | base $-68 | +0.5pp $-129 | +1.0pp $-191 |
UW: 25.0% down · 7.5% · 30yr · 1.5% tax · 5.0% vac · 8.0% maint · 8.0% mgmt
Financing live
Cash to close
- Down payment
- $58,725
- Closing costs
- $7,047
- Reserves months
- —
- Total cash needed
- —
Loan-product check · same deal, 3 products live
Conventional
25% down · 7.5% · 30yr
- Down + closing
- —
- Monthly P&I
- —
- Monthly cashflow
- —
- DSCR
- —
- Eligible?
- —
Personal DTI + credit; lowest rate.
DSCR
20% down · 8.5% · 30yr
- Down + closing
- —
- Monthly P&I
- —
- Monthly cashflow
- —
- DSCR
- —
- Eligible?
- —
No personal income docs; deal must DSCR.
Hard money
10% down · 12.0% · 12mo
- Down + closing
- —
- Monthly P&I
- —
- Monthly cashflow
- —
- DSCR
- —
- Eligible?
- —
Short-term bridge; refi at stabilization.
Listing history 19 events
-
2026-06-18days on market $234,900 Active 76 DOM
-
2026-06-17days on market $234,900 Active 75 DOM
-
2026-06-16days on market $234,900 Active 74 DOM
-
2026-06-15days on market $234,900 Active 73 DOM
-
2026-06-14days on market $234,900 Active 71 DOM
-
2026-06-13days on market $234,900 Active 70 DOM
-
2026-06-10days on market $234,900 Active 68 DOM
-
2026-06-09days on market $234,900 Active 67 DOM
-
2026-06-08days on market $234,900 Active 66 DOM
-
2026-06-07days on market $234,900 Active 65 DOM
-
2026-06-05days on market $234,900 Active 62 DOM
-
2026-06-03days on market $234,900 Active 61 DOM
-
2026-06-02days on market $234,900 Active 60 DOM
-
2026-06-01days on market $234,900 Active 59 DOM
-
2026-05-31days on market $234,900 Active 58 DOM
-
2026-05-30days on market $234,900 Active 57 DOM
-
2026-05-21price $234,900
-
2026-04-03$250,000 Active
-
1982-06-01soldstatus $1,378
ⓘ Source: listings_history table (triggers on properties + properties_extension) + one-shot
backfill from property_details.listing_events for pre-trigger history.
Tax reassessment forecast FL · Resets to sale price
- Current annual tax
- $2,805 · $234/mo
- Projected year-2 tax
- $2,805 · $234/mo
- Expected delta
- $0/yr ($0/mo · 0.0%)
ⓘ Screening estimate from a state-policy table — verify with the county assessor before closing.
Climate risk First Street
- Flood 1/10 Low FEMA zone X (unshaded) · 0% chance over 30 yrs
- Wildfire 6/10 Major
- Heat 8/10 Severe 7 d/yr ≥107°F today · 21 d/yr by 30 yrs out
- Wind 9/10 Extreme 99% chance of damaging wind over 30 yrs
- Air quality 2/10 Low 2 unhealthy d/yr today · 2 by 30 yrs out
Nearby sold comps map
Loading sold comps map…
Walkable amenities ~0.75 mi
Loading nearby amenities…
Taxation est. · year 1
- Rental income
- $22,711
- − Mortgage interest
- −$13,158
- − Property taxes
- −$2,805
- − Insurance
- −$1,174
- − Repairs & maintenance
- −$1,817
- − Management
- −$1,817
- − Depreciation
- −$6,833
- Taxable loss
- −$4,894
- Est. tax savings @ 24.0%
- +$1,175
- After-tax cash flow
- $354/yr
For passive investors: Depreciation is non-cash, so a rental often shows a tax loss while cash-flowing — sheltering income. Rental losses are passive: they offset passive income freely, and up to $25,000/yr can offset ordinary (W-2) income if you actively participate and your MAGI is under $100k (phasing out to $0 by $150k); unused losses carry forward. On sale, claimed depreciation is recaptured at up to 25%, and gains may owe capital-gains tax (a 1031 exchange can defer both). Figures are a year-1 estimate at your 24.0% rate — not tax advice; consult a CPA.
Schools (NCES district)
- District
- Levy
- NCES district ID
- 1201140
- Math proficiency
- 45% ▼ -8.00%
- Reading proficiency
- 43% ▼ -3.00%
- Median HH income
- $35,254
- Composite
- 36.42/100
- National rank
- #4673
- State rank
- #54 of 73 in FL
Livability — East Bronson
- Score
- 62/100
- State rank
- #768
- US rank
- #17230
Category grades
Schools grade is shown separately in the Schools card above.
Census & demographics
- Population (ZIP)
- 14,532
Population outlook (Levy County) Hauer SSP2
- Today (2025)
- 36,536 people
- By 2030
- 34,498 · -5.6%
- By 2040
- 30,294 · -17.1%
- By 2050
- 26,368 · -27.8%
- By 2075
- 19,003 · -48.0%
- By 2100
- 13,169 · -64.0%
Race, ethnicity, and origin ACS 2023
- Neighborhood character
- Predominantly White (69%)
- Race & ethnicity
- White 69% Hispanic / Latino 13% Black 13% Two or more races 7%
- Hispanic origin (detail)
- Mexican 3% Puerto Rican 4% Cuban 2%
- Common ancestry
- Slovak 4% Iranian 2% Lithuanian 1%
- Foreign-born
- 6% · Canada, China
- Languages at home
- 89% English-only · Spanish 10% Chinese 1%
Political lean MEDSL · Levy
- 2024 margin
- Solid R (+50.3) · D 24.6% · R 74.8%
- 2008→2024 swing
- -23.3pp toward R · 2008: -26.9pp · 2024: -50.3pp
- All cycles
- 2024: R+50.3 2020: R+45.6 2016: R+44.8 2012: R+32.2 2008: R+26.9
Not yet ingested
- Civics
- —
Market trends
- HPI YoY
- ▼ -21.99%
- Current HPI
- 335.7751
- Rent YoY
- —
- Metro
- —
- State GDP YoY
- ▲ 3.28%
- F500 in state
- 36
Industry mix (Fortune 500 HQ in FL)
| Industry | F500 HQs | Revenue |
|---|---|---|
| Industrial Technology | 2 | $29B |
|
||
| Insurance | 2 | $17B |
|
||
| Retail | 1 | $60B |
|
||
| Technology Distribution | 1 | $58B |
|
||
| Homebuilding | 1 | $35B |
|
||
| Technology Manufacturing | 1 | $35B |
|
||
Price history
+16946.4% since first listed3 events — show timeline
- 2026-05-21 Price Changed $234,900 Stellar MLS as Distributed by MLS Grid
- 2026-04-03 Listed $250,000 Stellar MLS as Distributed by MLS Grid
- 1982-06-01 Sold (Public Records) $1,378 Public Records
Property tax history
+43.4%/yrLatest (2025): $2,805 · +3393.7% YoY. Source: county tax records.
Cash-flow waterfall
monthlySold comps — $/sqft
last 12 mo · ≤1 miLoading sold comps…