 Fourplex
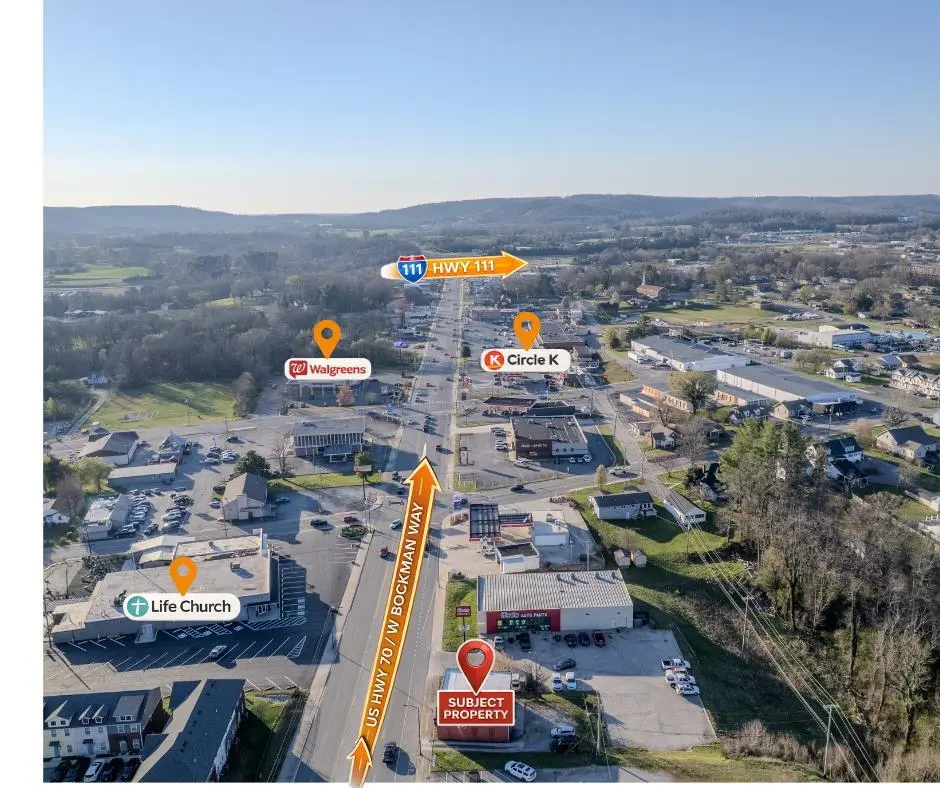
414 W Bockman Way · Sparta, TN
Flood risk 1/10 · Minimal
- FEMA flood zone
- X (unshaded)
- Chance of flooding over 30 yrs
- 0.0%
- Est. flood insurance / yr
- $507 – $1,088
Fire risk 4/10 · Minor
- Est. fire insurance / yr
- $949 – $1,763
Heat risk 5/10 · Moderate
- Hot days now (above 103°F)
- 7 days/yr
- Hot days in 30 yrs
- 21 days/yr
Wind risk 3/10 · Minor
- Chance of severe wind over 30 yrs
- 8.0%
Air-quality risk 2/10 · Minimal
- Unhealthy air days now
- 1 days/yr
- Unhealthy air days in 30 yrs
- 2 days/yr
Risk factors via First Street. Map © Google.
Why this score? — see what drove the B grade
The composite is a weighted blend of 9 inputs, each scored 0–100. Each bar is that input's sub-score; the figure is the points it added to the 100-point composite (weight × sub-score).
- Cash flow +30.0/30.0
- DSCR +10.0/10.0
- 1% rule +9.0/10.0
- ARV discount +7.5/15.0
- Appreciation +4.8/10.0
- Livability +3.5/5.0
- Schools +2.6/10.0
- Rent growth +2.5/5.0
- Condition / age +2.5/5.0
$375,000
🖨 Deal sheet 📄 Offer letter ✓ Due diligence
Multi-family units
County records classify this as Multi-Family (5+ Unit). Listing-text estimate: 4 units. estimate disagrees with records
5+ unit building — per-unit beds/baths from public records are typically unavailable; the breakdown below (if shown) is an estimate from the listing text.
Listing remarks
Investment opportunity in the heart of Sparta! Located at 414 W Bockman Way, this 3,120 sq ft property is currently configured as a 4-plex, with 2 units upstairs and 2 downstairs, offering immediate income potential with all units currently leased on 1-year terms. Each unit features 1 bedroom, 1 bath, a living room, kitchen with eat-in dining area, and laundry hookups. Positioned along one of Sparta's main corridors, this property benefits from strong daily traffic counts and excellent visibility, making it ideal for both continued multifamily use or future commercial potential. The property also offers strong potential for increased income, making it an attractive opportunity for investors
Key facts
- Income potential
- Commercial potential
- Strong visibility
Tags
Property features AI
Finance
- Other: Lot approximately 5,000 square feet (50 x 100)
Exterior
- Parking: Unpaved parking
- Utilities: Public water; Public sewer
- Home design: Residential income property; Quadruplex
- Construction: Frame, block, and brick construction; Slab foundation; Built using multiple materials
- Exterior features: Flat rubber roof
Interior
- Kitchen: Dishwasher; Refrigerator; Electric range
- Flooring: Carpet; Vinyl; Hardwood; Tile
- Heating & cooling: Baseboard heating; Has cooling
- Interior features: Double-pane windows with wood frames; No fireplace
- Laundry & utility: Washer hookup; Electric water heater
Neighborhood map
What this means for you Summary
Snapshot
- This is a 4 × 4-bed/4.0-bath units multifamily listed at $375k.
Deal economics
- At list price, monthly cash flow is $2k ($23k/yr) — positive. Per door: $480/mo.
- The deal already cash-flows at list — no discount required.
- Meets the 1% rule at list price ($5k rent vs $375k).
- Recommended offer: $341k (9.0% below list) — sets the bar for market timing.
- Cap rate 12.4% vs local median 2.7% in Sparta — top-decile yield for the area; either an underpriced asset or a hidden risk that comps aren't pricing in. Stress-test before assuming the spread holds.
Location & tenants
- Location reads 69/100 on livability (#67 in TN) — a middle-class / working-renter tenant base. Strengths: cost of living A+, housing A+, health & safety A+; Watch: schools F, amenities F, commute F.
- White County (rural): math 31% / reading 31% proficiency, ranked #56 of 139 in TN (top 40%) — families likely to look elsewhere, expect single-tenant / working-renter base with shorter leases.
- Market conditions: 354 active listings in the ZIP; 209 units permitted in White County in 2024 (0 in 5+ unit buildings).
Forward outlook
- In year one you build about $802 of equity ($3k loan paydown + $-2k appreciation (-0.5% local appreciation)).
- White County population projected at +5% by 2050 — modest demand growth; plan on rents tracking national, not racing it.
- At projected returns (-0.5% appreciation + 3.0% rent growth), your $105k cash investment doubles in ~4 years — after that, you're playing with house money.
Negotiation context
- It's been on market 91 days — a 9% lower offer ($341k) is reasonable based on typical stale-listing flexibility.
- 3 sale attempts since 2y ago; this cycle's ask has dropped $25k (6%) from the opening price — seller is motivated, your offer sets the floor, not the list.
Risks & watch-outs
- Watch-outs: built in 1947 — expect roof / HVAC / electrical / plumbing capex.
- Climate carrying-cost: extreme-heat days projected 7→21/yr by 2055 (HVAC capex compounding) — expect insurance premiums to compound above CPI over the hold.
Questions for the listing agent
- It's been on market 91 days. Have you received any prior offers? Is the seller open to a 9% concession, seller financing, or rate buy-down credit?
- Can we see the unit-by-unit rent roll, current vacancy, and any below-market leases? What's the average tenancy length?
- What capital expenditures (roof, boiler, parking lot, exteriors) have been made in the last 5 years, and what's planned in the next 2?
- Built in 1947 — when were the roof, HVAC, electrical panel, plumbing, and water heater last replaced?
- Why hasn't it sold? Are there any deal-killer items the seller is aware of (foundation, flood, title, zoning, code violations)?
- Is there a deadline driving the sale (1031 exchange, divorce, estate, relocation)? That informs how much negotiation room exists.
- Schools are F-rated, which usually means shorter tenancies and higher turnover. Who's the typical renter profile here, and what's been the actual vacancy rate?
- What's the average days-on-market for RENTAL listings here right now (not sales)? A rising rental-DOM trend means longer vacancies and softer asking-rent achievability than the comps imply.
- What's the recent tenant-quality profile in this submarket — average credit score on applications, eviction rate, late-payment / NSF rate, and stable-employment percentage? A property-management company in the area should have these aggregated.
- How much new apartment / multifamily construction is in the pipeline within 1–3 miles? Heavy new supply (>2% of stock underway) typically softens rents 12–24 months out; light construction supports rent growth.
Investment metrics
- 1% rule
- 1.40% ✓
- Cap rate
- 12.43%
- Cash-on-cash
- 21.92%
- DSCR
- 1.98
- GRM
- 5.9
CMA / ARV
No comps found within radius.
Projected returns pro-forma
-0.48% appreciation · 3.0% rent growth · sell at horizon
- IRR
- 20.8%
- Equity multiple
- 1.98×
- Total profit
- $102,735
- Equity at exit
- $100,020
- IRR
- 25.5%
- Equity multiple
- 3.73×
- Total profit
- $286,198
- Equity at exit
- $113,363
Cash invested: $105,000 (down + closing). Projections, not guarantees.
Landlord ↔ Tenant lean methodology
- Overall (STATE)
- 87 Strongly Landlord-Friendly
- State Tennessee
- 87 Strongly Landlord-Friendly · R+13
- County
- — inherits STATE
- City
- — inherits STATE
ZIP-level market 38583
- Home prices YoY
- -0.1%
- Active inventory
- 354
- Price-to-rent
- 23.8×
Monthly cashflow live
- Estimated rent
- $5,256 medium interval (Pro) →
- Mortgage (P&I)
- −$1,967
- Tax from tax record
- −$111 /mo · $1,333/yr
- Insurance
- −$156
- HOA
- −$0
- Vacancy / Maint / Mgmt
- −$1,104
- Net cashflow
- $1,918
Break-even live
4-unit breakdown (identical units grouped — click to expand)
| Units | Beds | Baths | Est. rent |
|---|---|---|---|
| 4× units | 4 | 4 | $5,256 |
| #1 | 4 | 4 | $1,314 |
| #2 | 4 | 4 | $1,314 |
| #3 | 4 | 4 | $1,314 |
| #4 | 4 | 4 | $1,314 |
| Total (4 units) | $5,256 | ||
UW: 25.0% down · 7.5% · 30yr · 1.5% tax · 5.0% vac · 8.0% maint · 8.0% mgmt
Financing live
Cash to close
- Down payment
- $93,750
- Closing costs
- $11,250
- Reserves months
- —
- Total cash needed
- —
Loan-product check · same deal, 3 products live
Conventional
25% down · 7.5% · 30yr
- Down + closing
- —
- Monthly P&I
- —
- Monthly cashflow
- —
- DSCR
- —
- Eligible?
- —
Personal DTI + credit; lowest rate.
DSCR
20% down · 8.5% · 30yr
- Down + closing
- —
- Monthly P&I
- —
- Monthly cashflow
- —
- DSCR
- —
- Eligible?
- —
No personal income docs; deal must DSCR.
Hard money
10% down · 12.0% · 12mo
- Down + closing
- —
- Monthly P&I
- —
- Monthly cashflow
- —
- DSCR
- —
- Eligible?
- —
Short-term bridge; refi at stabilization.
Listing history 26 events
-
2026-06-19days on market $375,000 Active 91 DOM
-
2026-06-18days on market $375,000 Active 90 DOM
-
2026-06-17days on market $375,000 Active 89 DOM
-
2026-06-16days on market $375,000 Active 88 DOM
-
2026-06-15days on market $375,000 Active 87 DOM
-
2026-06-14days on market $375,000 Active 85 DOM
-
2026-06-13days on market $375,000 Active 84 DOM
-
2026-06-10days on market $375,000 Active 82 DOM
-
2026-06-09days on market $375,000 Active 81 DOM
-
2026-06-08days on market $375,000 Active 80 DOM
-
2026-06-07days on market $375,000 Active 79 DOM
-
2026-06-03days on market $375,000 Active 75 DOM
-
2026-06-02days on market $375,000 Active 74 DOM
-
2026-06-01days on market $375,000 Active 73 DOM
-
2026-05-31days on market $375,000 Active 72 DOM
-
2026-05-30days on market $375,000 Active 71 DOM
-
2026-05-18price $375,000
-
2026-03-20$399,900 Active
-
2025-03-08historical $549
-
2025-02-14$549
-
2024-02-27historical $499
-
2024-02-23price $499
-
2024-02-12price $505
-
2024-02-03price $515
-
2024-01-19price $520
-
2024-01-10$549
ⓘ Source: listings_history table (triggers on properties + properties_extension) + one-shot
backfill from property_details.listing_events for pre-trigger history.
Tax reassessment forecast TN · Resets to sale price
- Current annual tax
- $1,333 · $111/mo
- Projected year-2 tax
- $2,662 · $222/mo
- Expected delta
- +$1,330/yr (+$111/mo · 99.7%)
ⓘ Screening estimate from a state-policy table — verify with the county assessor before closing.
Climate risk First Street
- Flood 1/10 Low FEMA zone X (unshaded) · 0% chance over 30 yrs
- Wildfire 4/10 Moderate
- Heat 5/10 Major 7 d/yr ≥103°F today · 21 d/yr by 30 yrs out
- Wind 3/10 Moderate 8% chance of damaging wind over 30 yrs
- Air quality 2/10 Low 1 unhealthy d/yr today · 2 by 30 yrs out
Nearby sold comps map
Loading sold comps map…
Walkable amenities ~0.75 mi
Loading nearby amenities…
Taxation est. · year 1
- Rental income
- $63,072
- − Mortgage interest
- −$21,006
- − Property taxes
- −$1,333
- − Insurance
- −$1,875
- − Repairs & maintenance
- −$5,046
- − Management
- −$5,046
- − Depreciation
- −$10,909
- Taxable income
- $17,858
- Est. tax owed @ 24.0%
- −$4,286
- After-tax cash flow
- $18,735/yr
For passive investors: Depreciation is non-cash, so a rental often shows a tax loss while cash-flowing — sheltering income. Rental losses are passive: they offset passive income freely, and up to $25,000/yr can offset ordinary (W-2) income if you actively participate and your MAGI is under $100k (phasing out to $0 by $150k); unused losses carry forward. On sale, claimed depreciation is recaptured at up to 25%, and gains may owe capital-gains tax (a 1031 exchange can defer both). Figures are a year-1 estimate at your 24.0% rate — not tax advice; consult a CPA.
Schools (NCES district)
- District
- White County
- NCES district ID
- 4704500
- Math proficiency
- 31% ▼ -6.00%
- Reading proficiency
- 31% ▲ 1.00%
- Median HH income
- $35,292
- Composite
- 25.63/100
- National rank
- #7406
- State rank
- #56 of 139 in TN
Livability — Sparta
- Score
- 69/100
- State rank
- #67
- US rank
- #8576
Category grades
Schools grade is shown separately in the Schools card above.
Census & demographics
- Census place
- Sparta, TN
- Population (ZIP)
- 25,739
Population outlook (White County) Hauer SSP2
- Today (2025)
- 27,593 people
- By 2030
- 28,026 · +1.6%
- By 2040
- 28,684 · +4.0%
- By 2050
- 28,970 · +5.0%
- By 2075
- 29,481 · +6.8%
- By 2100
- 27,841 · +0.9%
Race, ethnicity, and origin ACS 2023
- Neighborhood character
- Predominantly White (93%)
- Race & ethnicity
- White 93% Two or more races 4% Hispanic / Latino 3% Black 1%
- Common ancestry
- Slovak 3% Lithuanian 2% Serbian 2%
- Foreign-born
- 1% · Canada
- Languages at home
- 98% English-only · Spanish 2%
Political lean MEDSL · White
- 2024 margin
- Solid R (+66.6) · D 16.3% · R 82.9%
- 2008→2024 swing
- -38.3pp toward R · 2008: -28.3pp · 2024: -66.6pp
- All cycles
- 2024: R+66.6 2020: R+62.7 2016: R+59.5 2012: R+37.2 2008: R+28.3
Not yet ingested
- Civics
- —
Market trends
- HPI YoY
- ▼ -0.48%
- Current HPI
- 357.041
- Rent YoY
- —
- Metro
- —
- State GDP YoY
- ▲ 2.78%
- F500 in state
- 22
Industry mix (Fortune 500 HQ in TN)
| Industry | F500 HQs | Revenue |
|---|---|---|
| Healthcare | 3 | $91B |
|
||
| Retail | 3 | $72B |
|
||
| Transportation / Logistics | 1 | $88B |
|
||
| Paper / Packaging | 1 | $19B |
|
||
| Insurance | 1 | $13B |
|
||
| Energy | 1 | $12B |
|
||
Price history
-6.2% since first listed10 events — show timeline
- 2026-05-18 Price Changed $375,000 UCMLS
- 2026-03-20 Listed $399,900 UCMLS
- 2025-03-08 Rental Removed $549 UCMLS
- 2025-02-14 Listed for Rent $549 UCMLS
- 2024-02-27 Rental Removed $499 UCMLS
- 2024-02-23 Price Changed $499 UCMLS
- 2024-02-12 Price Changed $505 UCMLS
- 2024-02-03 Price Changed $515 UCMLS
- 2024-01-19 Price Changed $520 UCMLS
- 2024-01-10 Listed for Rent $549 UCMLS
Property tax history
+3.0%/yrLatest (2025): $1,333 · +8.3% YoY. Source: county tax records.
Cash-flow waterfall
monthlySold comps — $/sqft
last 12 mo · ≤1 miLoading sold comps…