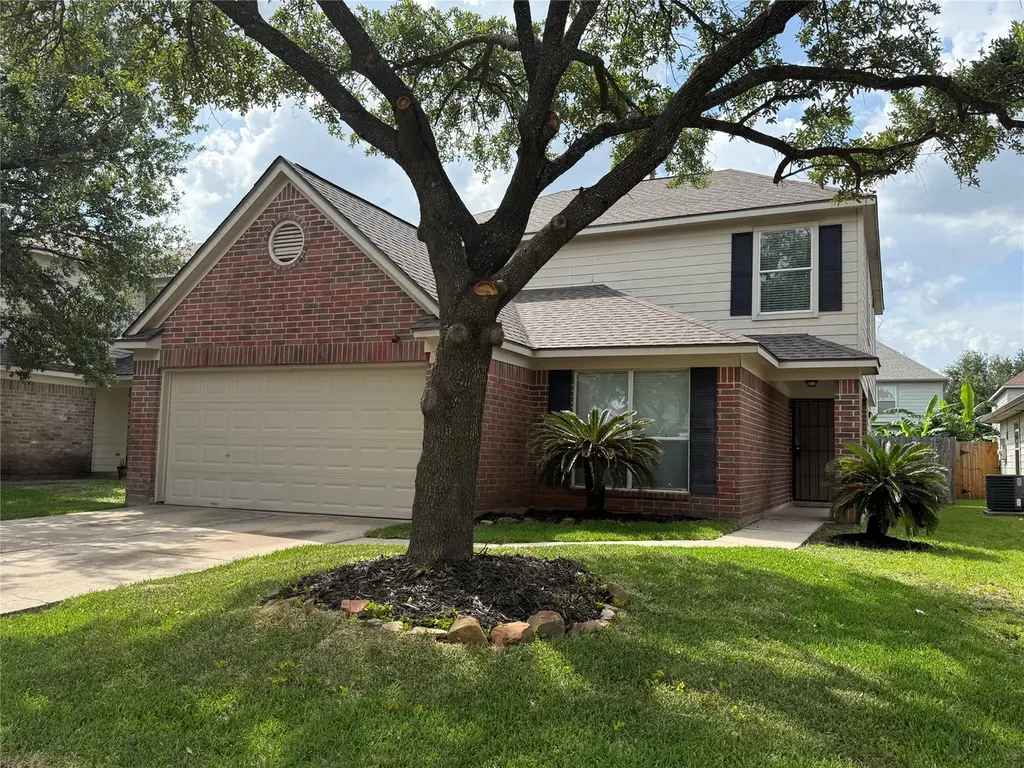
1219 Wabash Elm St · Houston, TX
Flood risk 1/10 · Minimal
- FEMA flood zone
- X (unshaded)
- Chance of flooding over 30 yrs
- 0.0%
- Est. flood insurance / yr
- $507 – $1,088
Fire risk 1/10 · Minimal
- Est. fire insurance / yr
- $1,222 – $2,270
Heat risk 9/10 · Severe
- Hot days now (above 111°F)
- 7 days/yr
- Hot days in 30 yrs
- 25 days/yr
Wind risk 8/10 · Major
- Chance of severe wind over 30 yrs
- 99.0%
Air-quality risk 3/10 · Minor
- Unhealthy air days now
- 3 days/yr
- Unhealthy air days in 30 yrs
- 3 days/yr
Risk factors via First Street. Map © Google.
Why this score? — see what drove the D+ grade
The composite is a weighted blend of 9 inputs, each scored 0–100. Each bar is that input's sub-score; the figure is the points it added to the 100-point composite (weight × sub-score).
- ARV discount +12.0/15.0
- Cash flow +10.9/30.0
- Appreciation +4.7/10.0
- 1% rule +4.0/10.0
- Livability +3.7/5.0
- DSCR +3.1/10.0
- Rent growth +2.7/5.0
- Condition / age +2.5/5.0
- Schools +2.0/10.0
$255,000
🖨 Deal sheet (PDF) 📄 Offer letter ✓ Due diligence
Listing remarks
Welcome home to 1219 Wabash Elm in Houston! This spacious home offers room for everyone with an expansive living area that provides plenty of space for relaxing, entertaining, and everyday living. The primary bedroom is downstairs with a large en-suite bathroom and closet. The second floor features three generously sized bedrooms, along with a versatile gameroom that can serve as a media room, play area, home office, or additional living space. Recent improvements make this home truly move-in ready, including a new roof (8/30/24), fresh interior paint, new carpet, new bathroom vanities and faucets, new light fixtures, new ceiling fans, new appliances, and new window blinds. These upgrades b
Key facts
- Versatile gameroom
- New carpet
- Fresh interior paint
Tags
Property features AI
Finance
- Other: Seller disclosure available
- HOA & community: Northview Place HOA (annual fee $500)
Exterior
- Parking: Attached garage (2 spaces); Driveway
- Security: Smoke detectors
- Utilities: Public water; Public sewer
- Home design: Residential property; Slab foundation; Composition roof; Built in 2003
- Construction: Brick and cement siding construction
- Exterior features: Fenced private yard; Back yard fencing; Located in a subdivision
Interior
- Kitchen: Dishwasher; Gas cooktop; Gas oven; Microwave; Disposal
- Bedrooms: Total rooms: 8
- Flooring: Carpet; Tile
- Bathrooms: 2 full bathrooms; 1 half bathroom
- Heating & cooling: Central heating (gas); Central electric air conditioning
- Interior features: Breakfast bar; Double vanity in bath; Kitchen island; Primary bedroom with bath; Soaking tub; Separate shower; Tub/shower combination; Window treatments; Ceiling fans
- Laundry & utility: Washer hookup; Electric dryer hookup
Neighborhood map
What this means for you Summary
Snapshot
- This is a 4-bed/2.5-bath single-family listed at $255k.
Deal economics
- At list price, monthly cash flow is $-114 ($-1k/yr) — negative.
- To cash-flow at today's rent, offer at most $235k (7.9% below list).
- To meet the 1% rule (rent ≥ 1% of price), the offer needs to be $228k (10.5% below list).
- Recommended offer: $228k (10.5% below list) — sets the bar for 1% rule.
- Cap rate 5.8% vs local median 3.2% in Houston — top-decile yield for the area; either an underpriced asset or a hidden risk that comps aren't pricing in. Stress-test before assuming the spread holds.
Location & tenants
- Location reads 74/100 on livability (#184 in TX, #4,771 nationally) — a middle-class / working-renter tenant base. Strengths: amenities A+, cost of living A+, housing A+; Watch: crime F.
- Spring ISD (suburban): math 19% / reading 26% proficiency, ranked #730 of 826 in TX (top 88%) — low school quality limits family demand, transient renter base, plan for 1-2y turnover; 66% free/reduced lunch — lower-income household profile, screen leases tightly.
- Zoned schools: Carolee Booker Elementary (math 24% / reading 23%, grade F, #3,247 of 4,322 statewide, top 76%, 765 students, 91% FRL); Rickey C Bailey Middle (math 15% / reading 23%, grade F, #1,466 of 1,662 statewide, top 89%, 1,065 students, 85% FRL); Spring H S (math 12% / reading 21%, grade F, #1,497 of 1,632 statewide, top 92%, 2,760 students, 72% FRL) — zoned schools average 83% FRL vs 66% district-wide (16 pts higher); higher-poverty schools than district average — tighter screening recommended.
- Market conditions: Rents flat; 162 active listings in the ZIP; solid renter incomes; 29,883 units permitted in Harris County in 2024 (8,621 in 5+ unit buildings).
- This rent runs 35% of the median local income ($79k/yr) — at the standard rent-burdened threshold; future hikes will face affordability resistance.
Forward outlook
- In year one you build about $34 of equity ($2k loan paydown + $-2k appreciation (-0.7% local appreciation)).
- Harris County population projected at +47% by 2050 — long-run rental-demand tailwind backs the buy-and-hold thesis.
Negotiation context
- It's been on market 17 days — a 2% lower offer ($251k) is reasonable based on typical stale-listing flexibility.
Risks & watch-outs
- Climate carrying-cost: severe wind risk, 99% chance of damaging wind over 30y; extreme-heat days projected 7→25/yr by 2055 (HVAC capex compounding) — expect insurance premiums to compound above CPI over the hold.
Questions for the listing agent
- What do current leases actually rent for vs. the listed asking? Can we see a recent rent roll and the last 12 months of T-12 income?
- What does the HOA fee cover, when was the last increase, and are there any pending special assessments or reserve-fund shortfalls?
- Is there a deadline driving the sale (1031 exchange, divorce, estate, relocation)? That informs how much negotiation room exists.
- Schools are D-rated, which usually means shorter tenancies and higher turnover. Who's the typical renter profile here, and what's been the actual vacancy rate?
- Crime grade is F in this area — have there been break-ins, vandalism, or insurance claims at this property in the last 3 years? What carrier currently insures it and at what premium?
- The area grade is low — what's the realistic commute time and amenity access for the typical tenant pool here? Any planned neighborhood developments (good or bad) we should know about?
- What's the average days-on-market for RENTAL listings here right now (not sales)? A rising rental-DOM trend means longer vacancies and softer asking-rent achievability than the comps imply.
- What's the recent tenant-quality profile in this submarket — average credit score on applications, eviction rate, late-payment / NSF rate, and stable-employment percentage? A property-management company in the area should have these aggregated.
- How much new for-sale + rental construction is in the pipeline within 1–3 miles? Heavy new supply typically softens prices + rents 12–24 months out; constrained supply supports both.
Investment metrics
- 1% rule
- 0.90% ✗
- Cap rate
- 5.76%
- Cash-on-cash
- -1.92%
- DSCR
- 0.91
- GRM
- 9.3
CMA / ARV
- ARV (on-the-fly)
- $283,577
- Comps found
- 12
Show comp detail 12 sales within ~0.75 mi
| Address | Dist | Beds/Ba | Sqft | Sold | Price | $/sf | Match |
|---|---|---|---|---|---|---|---|
| 1403 Great Easton Ln | 0.24mi | 4/2.5 | 2,302 (-3%) | 2mo | $269,000 | $117 | 82 |
| 1207 N Lady Fern Ln | 0.31mi | 5/2.5 (+1) | 2,430 (+2%) | 2mo | $290,000 | $119 | 75 |
| 15722 Youpon Valley Dr | 0.32mi | 4/2.5 | 2,305 (-3%) | 7mo | $234,900 | $102 | 74 |
| 603 Northvalley Dr | 0.46mi | 4/2.5 | 2,210 (-7%) | 2mo | $230,000 | $104 | 65 |
| 1230 Piedmont Creek Trl | 0.28mi | 5/2.5 (+1) | 2,695 (+13%) | 1mo | $175,000 | $65 | 60 |
| 21115 Hidden Bridle Ct | 0.40mi | 3/2.5 (-1) | 2,066 (-13%) | 1mo | $245,000 | $119 | 53 |
| 21127 Gate View Dr | 0.46mi | 4/2.0 | 2,052 (-14%) | 2mo | $259,900 | $127 | 52 |
| 514 Brushy Glen Dr | 0.60mi | 4/3.0 | 2,125 (-11%) | 4mo | $286,000 | $135 | 49 |
| 20943 Vista Trace Dr | 0.55mi | 3/2.5 (-1) | 2,140 (-10%) | 7mo | $260,000 | $121 | 46 |
| 718 Boulder Bluff Dr | 0.57mi | 3/2.5 (-1) | 2,107 (-12%) | 6mo | $249,000 | $118 | 44 |
| 718 Vista Grove Cir | 0.66mi | 3/2.5 (-1) | 2,105 (-12%) | 3mo | $277,000 | $132 | 43 |
| 1442 Oxford Meadow Dr | 0.63mi | 3/2.5 (-1) | 2,098 (-12%) | 4mo | $239,900 | $114 | 42 |
Match score weights: distance 35% · size 25% · config 20% · recency 20%. Top-matched comps best support the ARV.
Projected returns pro-forma
-0.68% appreciation · 0.69% rent growth · sell at horizon
- IRR
- -8.9%
- Equity multiple
- 0.61×
- Total profit
- $-27,811
- Equity at exit
- $65,517
- IRR
- -4.5%
- Equity multiple
- 0.60×
- Total profit
- $-28,714
- Equity at exit
- $72,236
Cash invested: $71,400 (down + closing). Projections, not guarantees.
Landlord ↔ Tenant lean methodology
- Overall (STATE)
- 87 Strongly Landlord-Friendly
- State Texas
- 87 Strongly Landlord-Friendly · R+5
- County
- — inherits STATE
- City
- — inherits STATE
ZIP-level market 77073
- Home prices YoY
- -0.3%
- Rents YoY
- 0.7%
- Active inventory
- 162
- Price-to-rent
- 9.3×
Monthly cashflow live
- Estimated rent
- $2,283 medium interval (Pro) →
- Mortgage (P&I)
- −$1,337
- Tax from tax record
- −$433 /mo · $5,191/yr
- Insurance
- −$106
- HOA
- −$42
- Vacancy / Maint / Mgmt
- −$479
- Net cashflow
- $-114
Break-even live
Sensitivity live
| Price | -10% $30 | -5% $-42 | +0% $-114 | +5% $-186 | +10% $-259 |
|---|---|---|---|---|---|
| Rent | -10% $-295 | -5% $-204 | +0% $-114 | +5% $-24 | +10% $66 |
| Rate | -1.0pp $14 | -0.5pp $-49 | base $-114 | +0.5pp $-180 | +1.0pp $-248 |
UW: 25.0% down · 7.5% · 30yr · 1.5% tax · 5.0% vac · 8.0% maint · 8.0% mgmt
Financing live
Cash to close
- Down payment
- $63,750
- Closing costs
- $7,650
- Reserves months
- —
- Total cash needed
- —
Loan-product check · same deal, 3 products live
Conventional
25% down · 7.5% · 30yr
- Down + closing
- —
- Monthly P&I
- —
- Monthly cashflow
- —
- DSCR
- —
- Eligible?
- —
Personal DTI + credit; lowest rate.
DSCR
20% down · 8.5% · 30yr
- Down + closing
- —
- Monthly P&I
- —
- Monthly cashflow
- —
- DSCR
- —
- Eligible?
- —
No personal income docs; deal must DSCR.
Hard money
10% down · 12.0% · 12mo
- Down + closing
- —
- Monthly P&I
- —
- Monthly cashflow
- —
- DSCR
- —
- Eligible?
- —
Short-term bridge; refi at stabilization.
HOA detail
- Monthly dues
- $42 · $504/yr
Listing history 12 events
-
2026-06-21days on market $255,000 Pending 17 DOM
-
2026-06-18days on market $255,000 Pending 14 DOM
-
2026-06-17days on market $255,000 Pending 13 DOM
-
2026-06-16days on market $255,000 Pending 12 DOM
-
2026-06-15status $255,000 Pending 11 DOM
-
2026-06-15days on market $255,000 Active 11 DOM
-
2026-06-13days on market $255,000 Active 9 DOM
-
2026-06-13days on market $255,000 Active 8 DOM
-
2026-06-09days on market $255,000 Active 5 DOM
-
2026-06-08days on market $255,000 Active 4 DOM
-
2026-06-07remarks 699-char remark
-
2026-06-07$255,000 Active 3 DOM
ⓘ Source: listings_history table (triggers on properties + properties_extension) + one-shot
backfill from property_details.listing_events for pre-trigger history.
Tax reassessment forecast TX · Resets to sale price
- Current annual tax
- $5,191 · $433/mo
- Projected year-2 tax
- $5,191 · $433/mo
- Expected delta
- $0/yr ($0/mo · 0.0%)
ⓘ Screening estimate from a state-policy table — verify with the county assessor before closing.
Climate risk First Street
- Flood 1/10 Low FEMA zone X (unshaded) · 0% chance over 30 yrs
- Wildfire 1/10 Low
- Heat 9/10 Extreme 7 d/yr ≥111°F today · 25 d/yr by 30 yrs out
- Wind 8/10 Severe 99% chance of damaging wind over 30 yrs
- Air quality 3/10 Moderate 3 unhealthy d/yr today · 3 by 30 yrs out
Nearby sold comps map
Loading sold comps map…
Walkable amenities ~0.75 mi
Loading nearby amenities…
Taxation est. · year 1
- Rental income
- $27,399
- − Mortgage interest
- −$14,284
- − Property taxes
- −$5,191
- − Insurance
- −$1,275
- − Repairs & maintenance
- −$2,192
- − Management
- −$2,192
- − HOA
- −$504
- − Depreciation
- −$7,418
- Taxable loss
- −$5,657
- Est. tax savings @ 24.0%
- +$1,358
- After-tax cash flow
- $-14/yr
For passive investors: Depreciation is non-cash, so a rental often shows a tax loss while cash-flowing — sheltering income. Rental losses are passive: they offset passive income freely, and up to $25,000/yr can offset ordinary (W-2) income if you actively participate and your MAGI is under $100k (phasing out to $0 by $150k); unused losses carry forward. On sale, claimed depreciation is recaptured at up to 25%, and gains may owe capital-gains tax (a 1031 exchange can defer both). Figures are a year-1 estimate at your 24.0% rate — not tax advice; consult a CPA.
Schools (NCES district)
- District
- Spring ISD
- NCES district ID
- 4841220
- Math proficiency
- 19% ▼ -13.00%
- Reading proficiency
- 26% ▼ -6.00%
- Median HH income
- $51,584
- Composite
- 20.12/100
- National rank
- #8643
- State rank
- #730 of 826 in TX
Livability — Houston
- Score
- 74/100
- State rank
- #184
- US rank
- #4771
Category grades
Schools grade is shown separately in the Schools card above.
Census & demographics
- County
- Harris County · 4,702,590 people
- City population
- 3,226,434
- Metro
- Houston-The Woodlands-Sugar Land, TX
- Population (ZIP)
- 46,084
- Household income
- $78,592
- Rent vs Own
- Severe rent burden
- 1297.0
Population outlook (Harris County) Hauer SSP2
- Today (2025)
- 5,571,493 people
- By 2030
- 6,089,821 · +9.3%
- By 2040
- 7,142,806 · +28.2%
- By 2050
- 8,185,864 · +46.9%
- By 2075
- 10,574,329 · +89.8%
- By 2100
- 12,109,958 · +117.4%
Race, ethnicity, and origin ACS 2023
- Neighborhood character
- Diverse neighborhood (Simpson 0.57)
- Race & ethnicity
- Hispanic / Latino 59% Black 27% Two or more races 24% White 9% Native American 2% Asian 2%
- Hispanic origin (detail)
- Mexican 38% Cuban 2%
- Common ancestry
- Lithuanian 1%
- Foreign-born
- 29% · Canada, Jamaica
- Languages at home
- 44% English-only · Spanish 53% French/Haitian/Cajun 2% Other Indo-European 1%
Political lean MEDSL · Harris
- 2024 margin
- Lean D (+5.5) · D 52.0% · R 46.4% · Other 1.6%
- 2008→2024 swing
- +3.9pp toward D · 2008: 1.6pp · 2024: 5.5pp
- All cycles
- 2024: D+5.5 2020: D+13.3 2016: D+12.4 2012: D+0.1 2008: D+1.6
Not yet ingested
- Civics
- —
Market trends
- HPI YoY
- ▼ -0.68%
- Current HPI
- 215.8688
- Rent YoY
- ▲ 0.69%
- Metro
- Houston-The Woodlands-Sugar Land, TX
- State GDP YoY
- ▲ 3.95%
- F500 in state
- 110
Industry mix (Fortune 500 HQ in TX)
| Industry | F500 HQs | Revenue |
|---|---|---|
| Energy | 16 | $1,198B |
|
||
| Technology | 5 | $198B |
|
||
| Engineering / Construction | 4 | $72B |
|
||
| Energy Services | 3 | $60B |
|
||
| Utilities | 3 | $41B |
|
||
| Healthcare | 2 | $330B |
|
||
Price history
1 event — show timeline
- 2026-06-04 Listed $255,000 HARMLS
Property tax history
+1.9%/yrLatest (2025): $5,191 · +1.0% YoY. Source: county tax records.
Cash-flow waterfall
monthlySold comps — $/sqft
last 12 mo · ≤1 miLoading sold comps…