14510 Crooked Tree Lane Plan · Grand Haven, MI
Flood risk No data
- FEMA flood zone
- —
- Chance of flooding over 30 yrs
- —
- Est. flood insurance / yr
- —
Fire risk No data
- Est. fire insurance / yr
- —
Heat risk No data
- Hot days now (above threshold)
- —
- Hot days in 30 yrs
- —
Wind risk No data
- Chance of severe wind over 30 yrs
- —
Air-quality risk No data
- Unhealthy air days now
- —
- Unhealthy air days in 30 yrs
- —
Risk factors via First Street. Map © Google.
Why this score? — see what drove the B grade
The composite is a weighted blend of 9 inputs, each scored 0–100. Each bar is that input's sub-score; the figure is the points it added to the 100-point composite (weight × sub-score).
- Cash flow +30.0/30.0
- 1% rule +10.0/10.0
- DSCR +10.0/10.0
- ARV discount +7.5/15.0
- Schools +5.2/10.0
- Rent growth +4.0/5.0
- Livability +4.0/5.0
- Condition / age +4.0/5.0
- Appreciation +0.0/10.0
$84,995
🖨 Deal sheet 📄 Offer letter ✓ Due diligence
Listing remarks
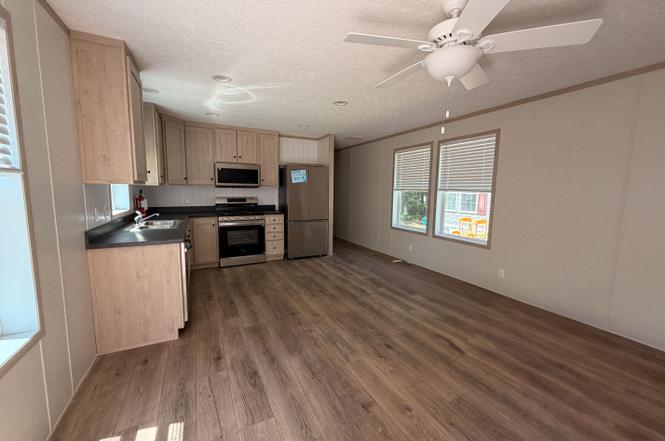
Brand new home available soon! Be the first to live in this 3 bedroom 2 bath home that features open concept living area, with 2 bedrooms and bathroom on one end of the home and the primary on the other end with en suite bath.
Key facts
- En suite bath
- Listed 7 days
Tags
Property features AI
Finance
- Financial info: List price $84,995
Exterior
- Home design: Single-family plan located at 14510 Crooked Tree Lane, Grand Haven, MI
- Exterior features: Living area approximately 1,056
Interior
- Bedrooms: 3 bedrooms
- Bathrooms: 2 bathrooms
- Interior features: Plan new construction
Neighborhood map
What this means for you Summary
Snapshot
- This is a 3-bed/2.0-bath manufactured listed at $85k. Condition is rated good.
Deal economics
- At list price, monthly cash flow is $776 ($9k/yr) — positive.
- The deal already cash-flows at list — no discount required.
- Meets the 1% rule at list price ($2k rent vs $85k).
- Cap rate 17.2% vs local median 1.8% in Grand Haven — top-decile yield for the area; either an underpriced asset or a hidden risk that comps aren't pricing in. Stress-test before assuming the spread holds.
Location & tenants
- Location reads 81/100 on livability (#69 in MI, #1,467 nationally) — a professional / high-income tenant draw. Strengths: schools A+, cost of living A+, housing A+; Watch: employment C-, commute F.
- Grand Haven Area Public Schools (suburban): math 52% / reading 68% proficiency, ranked #42 of 540 in MI (top 8%) — acceptable for families but not a draw, mixed tenant base, ~2y average lease.
- Market conditions: Rents rising fast (+6.0%/yr); 218 active listings in the ZIP; 1 comparable units currently listed for rent nearby; solid renter incomes; 1,237 units permitted in Ottawa County in 2024 (443 in 5+ unit buildings).
Forward outlook
- Local home prices are declining (-3.0%/yr); year-one equity from $587 of loan paydown is wiped out by about $3k of value loss. Plan a longer hold.
- Ottawa County population projected at +24% by 2050 — long-run rental-demand tailwind backs the buy-and-hold thesis.
- At projected returns (-3.0% appreciation + 6.0% rent growth), your $24k cash investment doubles in ~3 years — after that, you're playing with house money.
Negotiation context
- Only 8 days on market — expect competitive offers; lowballing is unlikely to land.
Questions for the listing agent
- Is there a deadline driving the sale (1031 exchange, divorce, estate, relocation)? That informs how much negotiation room exists.
- Schools are A-rated — typically a magnet for longer-tenancy family renters. What's the average tenant stay here, and is there a school-zone premium baked into asking?
- What's the average days-on-market for RENTAL listings here right now (not sales)? A rising rental-DOM trend means longer vacancies and softer asking-rent achievability than the comps imply.
- What's the recent tenant-quality profile in this submarket — average credit score on applications, eviction rate, late-payment / NSF rate, and stable-employment percentage? A property-management company in the area should have these aggregated.
- How much new for-sale + rental construction is in the pipeline within 1–3 miles? Heavy new supply typically softens prices + rents 12–24 months out; constrained supply supports both.
Investment metrics
- 1% rule
- 2.03% ✓
- Cap rate
- 17.24%
- Cash-on-cash
- 39.11%
- DSCR
- 2.74
- GRM
- 4.1
CMA / ARV
- ARV (on-the-fly)
- $42,240
- Comps found
- 1
Show comp detail 1 sale within ~0.75 mi
| Address | Dist | Beds/Ba | Sqft | Sold | Price | $/sf | Match |
|---|---|---|---|---|---|---|---|
| 13548 Pinewood Dr | 0.45mi | 3/2.0 | 1,056 (0%) | 7mo | $42,500 | $40 | 73 |
Match score weights: distance 35% · size 25% · config 20% · recency 20%. Top-matched comps best support the ARV.
Projected returns pro-forma
-3.0% appreciation · 6.03% rent growth · sell at horizon
- IRR
- 38.7%
- Equity multiple
- 2.73×
- Total profit
- $41,068
- Equity at exit
- $12,673
- IRR
- 46.7%
- Equity multiple
- 6.17×
- Total profit
- $123,138
- Equity at exit
- $7,349
Cash invested: $23,799 (down + closing). Projections, not guarantees.
Landlord ↔ Tenant lean methodology
- Overall (STATE)
- 62 Landlord-Friendly
- State Michigan
- 62 Landlord-Friendly · EVEN
- County
- — inherits STATE
- City
- — inherits STATE
ZIP-level market 49417
- Rents YoY
- 6.0%
- Active inventory
- 218
- Price-to-rent
- 4.1×
Monthly cashflow live
- Estimated rent
- $1,725 medium interval (Pro) →
- Mortgage (P&I)
- −$446
- Tax est. 1.5%
- −$106 /mo · $1,275/yr
- Insurance
- −$35
- HOA
- −$0
- Vacancy / Maint / Mgmt
- −$362
- Net cashflow
- $776
Break-even live
UW: 25.0% down · 7.5% · 30yr · 1.5% tax · 5.0% vac · 8.0% maint · 8.0% mgmt
Financing live
Cash to close
- Down payment
- $21,249
- Closing costs
- $2,550
- Reserves months
- —
- Total cash needed
- —
Loan-product check · same deal, 3 products live
Conventional
25% down · 7.5% · 30yr
- Down + closing
- —
- Monthly P&I
- —
- Monthly cashflow
- —
- DSCR
- —
- Eligible?
- —
Personal DTI + credit; lowest rate.
DSCR
20% down · 8.5% · 30yr
- Down + closing
- —
- Monthly P&I
- —
- Monthly cashflow
- —
- DSCR
- —
- Eligible?
- —
No personal income docs; deal must DSCR.
Hard money
10% down · 12.0% · 12mo
- Down + closing
- —
- Monthly P&I
- —
- Monthly cashflow
- —
- DSCR
- —
- Eligible?
- —
Short-term bridge; refi at stabilization.
Rent comps 1 comps
| Address | Beds | Baths | Sqft | Rent | $/sqft | DOM | Units | Dist |
|---|---|---|---|---|---|---|---|---|
| 14546 Mercury Dr Grand Haven, MI | 3.0 | 2.0 | 1136 | $1,414 | $1.24 | 2d | 1 | 0.04mi |
Listing history 8 events
-
2026-06-19days on market $84,995 Active 8 DOM
-
2026-06-18days on market $84,995 Active 7 DOM
-
2026-06-17days on market $84,995 Active 6 DOM
-
2026-06-16days on market $84,995 Active 5 DOM
-
2026-06-15days on market $84,995 Active 4 DOM
-
2026-06-14days on market $84,995 Active 2 DOM
-
2026-06-13remarks 226-char remark
-
2026-06-13$84,995 Active 1 DOM
ⓘ Source: listings_history table (triggers on properties + properties_extension) + one-shot
backfill from property_details.listing_events for pre-trigger history.
Nearby sold comps map
Loading sold comps map…
Walkable amenities ~0.75 mi
Loading nearby amenities…
Taxation est. · year 1
- Rental income
- $20,703
- − Mortgage interest
- −$4,761
- − Property taxes
- −$1,275
- − Insurance
- −$425
- − Repairs & maintenance
- −$1,656
- − Management
- −$1,656
- − Depreciation
- −$2,473
- Taxable income
- $8,457
- Est. tax owed @ 24.0%
- −$2,030
- After-tax cash flow
- $7,277/yr
For passive investors: Depreciation is non-cash, so a rental often shows a tax loss while cash-flowing — sheltering income. Rental losses are passive: they offset passive income freely, and up to $25,000/yr can offset ordinary (W-2) income if you actively participate and your MAGI is under $100k (phasing out to $0 by $150k); unused losses carry forward. On sale, claimed depreciation is recaptured at up to 25%, and gains may owe capital-gains tax (a 1031 exchange can defer both). Figures are a year-1 estimate at your 24.0% rate — not tax advice; consult a CPA.
Condition & rehab AI · 6 photos
This brand new manufactured home is move-in ready with fresh finishes and a clean exterior. Minor updates to the exterior and landscaping would further enhance its curb appeal and value.
Value-add opportunities
- Both Painting exterior and interior walls — Enhances curb appeal and interior aesthetics.
- Both Landscaping improvements — Enhances curb appeal and adds value.
- Both New window treatments — Improves energy efficiency and aesthetics.
- Both New flooring in bathrooms — Enhances functionality and aesthetics.
Renovation cost estimate screening
Value-add ROI direction
- Both Painting exterior and interior walls — Enhances curb appeal and interior aesthetics. ↑
- Both Landscaping improvements — Enhances curb appeal and adds value. ↑
- Both New window treatments — Improves energy efficiency and aesthetics. ↑
- Both New flooring in bathrooms — Enhances functionality and aesthetics. ↑
ⓘ Cost ranges are severity-bucket heuristics (US national rule-of-thumb). Get contractor quotes + a written scope before underwriting a rehab budget.
Schools (NCES district)
- District
- Grand Haven Area Public Schools
- NCES district ID
- 2616380
- Math proficiency
- 52% ▼ -10.00%
- Reading proficiency
- 68% ▼ -2.00%
- Median HH income
- $56,566
- Composite
- 51.64/100
- National rank
- #1698
- State rank
- #42 of 540 in MI
Livability — Grand Haven
- Score
- 81/100
- State rank
- #69
- US rank
- #1467
Category grades
Schools grade is shown separately in the Schools card above.
Census & demographics
- County
- Ottawa County · 144,142 people
- City population
- 33,878
- Metro
- Grand Rapids-Kentwood, MI
- Population (ZIP)
- 33,878
- Household income
- $83,405
- Rent vs Own
- Severe rent burden
- 770.0
Population outlook (Ottawa County) Hauer SSP2
- Today (2025)
- 313,561 people
- By 2030
- 330,027 · +5.3%
- By 2040
- 361,118 · +15.2%
- By 2050
- 388,414 · +23.9%
- By 2075
- 452,175 · +44.2%
- By 2100
- 473,041 · +50.9%
Race, ethnicity, and origin ACS 2023
- Neighborhood character
- Predominantly White (89%)
- Race & ethnicity
- White 89% Two or more races 5% Hispanic / Latino 5% Asian 2%
- Common ancestry
- Iranian 16% Romanian 6% Italian 3%
- Foreign-born
- 3% · Canada, South Korea, India
- Languages at home
- 96% English-only · Spanish 2% Other Indo-European 1% Chinese 1%
Political lean MEDSL · Ottawa
- 2024 margin
- Strong R (+20.4) · D 39.0% · R 59.5% · Other 1.5%
- 2008→2024 swing
- +3.4pp toward D · 2008: -23.9pp · 2024: -20.4pp
- All cycles
- 2024: R+20.4 2020: R+21.5 2016: R+30.4 2012: R+34.2 2008: R+23.9
Not yet ingested
- Civics
- —
Market trends
- HPI YoY
- ▼ -424.92%
- Current HPI
- 365.7115
- Rent YoY
- ▲ 6.03%
- Metro
- Grand Rapids-Kentwood, MI
- State GDP YoY
- ▲ 1.37%
- F500 in state
- 28
Industry mix (Fortune 500 HQ in MI)
| Industry | F500 HQs | Revenue |
|---|---|---|
| Automotive Parts | 3 | $48B |
|
||
| Automotive | 2 | $372B |
|
||
| Chemicals | 1 | $45B |
|
||
| Automotive Retail | 1 | $29B |
|
||
| Healthcare / Medical Devices | 1 | $23B |
|
||
| Automotive Technology | 1 | $20B |
|
||
Cash-flow waterfall
monthlySold comps — $/sqft
last 12 mo · ≤1 miLoading sold comps…