67-12 Yellowstone Blvd Unit B9 · New York, NY
Flood risk 10/10 · Severe
- FEMA flood zone
- X (unshaded)
- Chance of flooding over 30 yrs
- 0.99%
- Est. flood insurance / yr
- $507 – $1,088
Fire risk 1/10 · Minimal
- Est. fire insurance / yr
- $691 – $1,283
Heat risk 6/10 · Moderate
- Hot days now (above 99°F)
- 7 days/yr
- Hot days in 30 yrs
- 15 days/yr
Wind risk 6/10 · Moderate
- Chance of severe wind over 30 yrs
- 27.0%
Air-quality risk 4/10 · Minor
- Unhealthy air days now
- 6 days/yr
- Unhealthy air days in 30 yrs
- 6 days/yr
Risk factors via First Street. Map © Google.
Why this score? — see what drove the D- grade
The composite is a weighted blend of 9 inputs, each scored 0–100. Each bar is that input's sub-score; the figure is the points it added to the 100-point composite (weight × sub-score).
- Cash flow +8.2/30.0
- ARV discount +7.5/15.0
- Schools +5.0/10.0
- Condition / age +4.0/5.0
- Rent growth +3.8/5.0
- Livability +3.8/5.0
- 1% rule +2.6/10.0
- DSCR +2.2/10.0
- Appreciation +0.0/10.0
$350,000
🖨 Deal sheet 📄 Offer letter ✓ Due diligence
Listing remarks
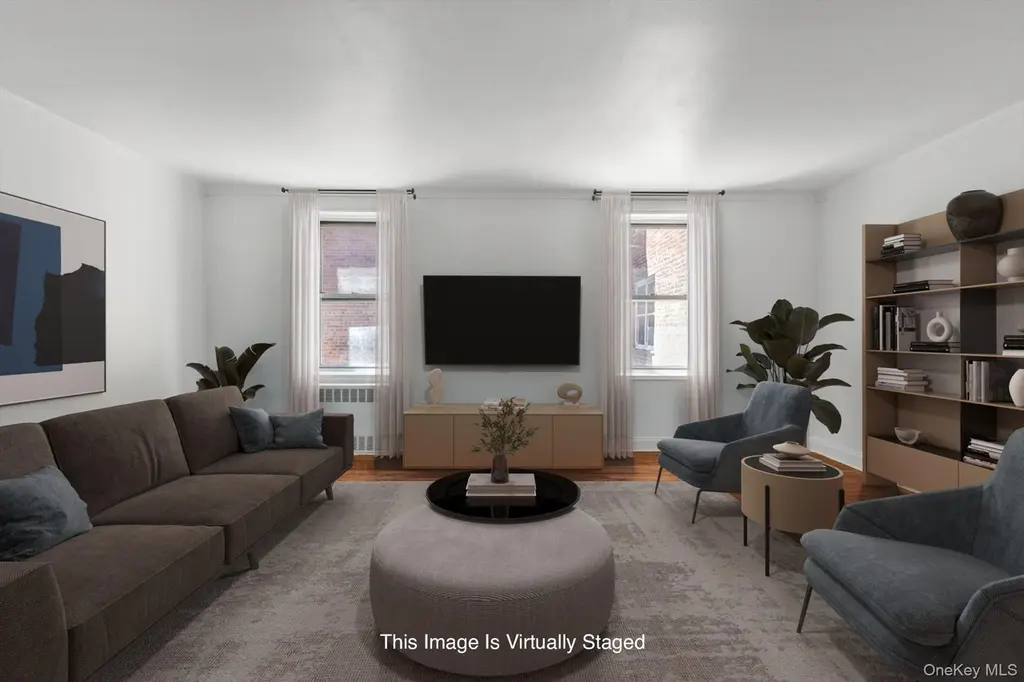
Sponsor Unit! This beautifully renovated one bedroom corner apartment offers an abundance of natural light and well designed living space. Windows in both the kitchen and bathroom enhance the bright, airy feel. The kitchen features granite countertops, stainless steel appliances, and new white cabinetry. Hardwood floors run throughout, and California closets provide generous storage. The building includes a part-time doorman, 24-hour laundry on each side, and storage and garage (waitlist). Conveniently located near Yellowstone Park and Trader Joe's, with easy access to R & M trains at 67th Drive, as well as E & F express trains and the LIRR at Continental Avenue. Enjoy a wide se
Key facts
- California closets
- New white cabinetry
- Part-time doorman
Tags
Property features AI
Exterior
- Parking: Garage available (has garage); Carport: none; Parking features: waitlist
- Utilities: Public sewer; Utilities: see remarks
- Home design: Stock cooperative
- Construction: Brick construction
- Exterior features: Brick construction; Not waterfront
Interior
- Kitchen: Gas range; Refrigerator
- Bedrooms: Entry level: 2
- Flooring: Hardwood
- Bathrooms: 1 full bathroom
- Heating & cooling: Heating: see remarks; No central cooling
- Interior features: Elevator; Granite counters; No pets allowed
Neighborhood map
What this means for you Summary
Snapshot
- This is a 1-bed/1.0-bath townhouse listed at $350k. Condition is rated good.
Deal economics
- At list price, monthly cash flow is $-392 ($-5k/yr) — negative.
- To cash-flow at today's rent, offer at most $293k (16.2% below list).
- To meet the 1% rule (rent ≥ 1% of price), the offer needs to be $265k (24.3% below list).
- Recommended offer: $265k (24.3% below list) — sets the bar for 1% rule.
- Cap rate 5.2% vs local median 2.6% in New York — top-decile yield for the area; either an underpriced asset or a hidden risk that comps aren't pricing in. Stress-test before assuming the spread holds.
Location & tenants
- Location reads 75/100 on livability (#268 in NY, #4,188 nationally) — a middle-class / working-renter tenant base. Strengths: amenities A+, commute A+, health & safety A; Watch: crime F, cost of living F.
- Market conditions: Rents rising fast (+5.3%/yr); 612 active listings in the ZIP; 40 comparable units currently listed for rent nearby; rentals at typical pace (median 20d on market — plan ~3-4 weeks tenant-placement turnaround); solid renter incomes; 5,302 units permitted in Queens County in 2024 (4,918 in 5+ unit buildings).
- This rent runs 30% of the median local income ($106k/yr) — at the standard rent-burdened threshold; future hikes will face affordability resistance.
Forward outlook
- Local home prices are declining (-3.0%/yr); year-one equity from $2k of loan paydown is wiped out by about $10k of value loss. Plan a longer hold.
- Queens County population projected at +16% by 2050 — long-run rental-demand tailwind backs the buy-and-hold thesis.
Negotiation context
- It's been on market 49 days — a 3% lower offer ($340k) is reasonable based on typical stale-listing flexibility.
Risks & watch-outs
- Watch-outs: flood insurance adds $66/mo; built in 1951 — expect roof / HVAC / electrical / plumbing capex.
- Climate carrying-cost: severe flood risk; major wind risk, 27% chance of damaging wind over 30y; extreme-heat days projected 7→15/yr by 2055 (HVAC capex compounding) — expect insurance premiums to compound above CPI over the hold.
Questions for the listing agent
- What do current leases actually rent for vs. the listed asking? Can we see a recent rent roll and the last 12 months of T-12 income?
- It's been on market 49 days. Have you received any prior offers? Is the seller open to a 24% concession, seller financing, or rate buy-down credit?
- Built in 1951 — when were the roof, HVAC, electrical panel, plumbing, and water heater last replaced?
- What's the actual annual flood-insurance premium (NFIP or private), and is the property in a SFHA with mandatory coverage?
- Is there a deadline driving the sale (1031 exchange, divorce, estate, relocation)? That informs how much negotiation room exists.
- Schools are B-rated — typically a magnet for longer-tenancy family renters. What's the average tenant stay here, and is there a school-zone premium baked into asking?
- Crime grade is F in this area — have there been break-ins, vandalism, or insurance claims at this property in the last 3 years? What carrier currently insures it and at what premium?
- The area grade is low — what's the realistic commute time and amenity access for the typical tenant pool here? Any planned neighborhood developments (good or bad) we should know about?
- What's the average days-on-market for RENTAL listings here right now (not sales)? A rising rental-DOM trend means longer vacancies and softer asking-rent achievability than the comps imply.
- What's the recent tenant-quality profile in this submarket — average credit score on applications, eviction rate, late-payment / NSF rate, and stable-employment percentage? A property-management company in the area should have these aggregated.
- How much new for-sale + rental construction is in the pipeline within 1–3 miles? Heavy new supply typically softens prices + rents 12–24 months out; constrained supply supports both.
Investment metrics
- 1% rule
- 0.76% ✗
- Cap rate
- 5.18%
- Cash-on-cash
- -3.99%
- DSCR
- 0.82
- GRM
- 11.0
CMA / ARV
No comps found within radius.
Show comp detail 12 sales within ~0.75 mi
| Address | Dist | Beds/Ba | Sqft | Sold | Price | $/sf | Match |
|---|---|---|---|---|---|---|---|
| 67-12 Yellowstone Blvd Unit D9 | 0.00mi | 1/1.0 | 800 | 0mo | $290,000 | $363 | 87 |
| 102-45 67th Rd Unit 2R | 0.07mi | 1/1.0 | 678 | 0mo | $262,000 | $386 | 84 |
| 102-30 66th Rd Unit 12E | 0.06mi | 1/1.0 | 1,000 | 0mo | $449,000 | $449 | 84 |
| 102-10 66th Rd Unit 18G | 0.10mi | 1/1.0 | 575 | 1mo | $220,000 | $383 | 82 |
| 102-12 65th Ave Unit 43C | 0.21mi | 1/1.0 | 780 | 1mo | $279,000 | $358 | 77 |
| 103-25 68th Ave Unit 5C | 0.13mi | 2/1.0 (+1) | 979 | 1mo | $460,000 | $470 | 76 |
| 102-30 Queens Blvd Unit 3R | 0.22mi | 2/1.0 (+1) | — | 0mo | $393,000 | — | 72 |
| 70-25 Yellowstone Blvd Unit 17Q | 0.44mi | 1/1.0 | — | 0mo | $305,000 | — | 67 |
| 65-41 Booth St Unit 4A | 0.48mi | 1/1.0 | 850 | 1mo | $275,000 | $324 | 65 |
| 65-74 Saunders St Unit 1D | 0.42mi | 2/1.0 (+1) | 1,100 | 1mo | $395,000 | $359 | 63 |
| 97-45 63rd Dr Unit 5C | 0.55mi | 1/1.0 | 577 | 0mo | $555,000 | $962 | 61 |
| 70-25 Yellowstone Blvd Unit 7M | 0.44mi | 2/2.0 (+1) | 1,203 | 0mo | $715,000 | $594 | 58 |
Match score weights: distance 35% · size 25% · config 20% · recency 20%. Top-matched comps best support the ARV.
Projected returns pro-forma
-3.0% appreciation · 5.3% rent growth · sell at horizon
- IRR
- -21.8%
- Equity multiple
- 0.23×
- Total profit
- $-75,324
- Equity at exit
- $52,186
- IRR
- -10.8%
- Equity multiple
- 0.28×
- Total profit
- $-70,424
- Equity at exit
- $30,262
Cash invested: $98,000 (down + closing). Projections, not guarantees.
Landlord ↔ Tenant lean methodology
- Overall (CITY)
- 0 Strongly Tenant-Friendly
- State New York
- 15 Strongly Tenant-Friendly · D+10
- County
- — inherits STATE
- City New York
- 0 Strongly Tenant-Friendly · D+34
ZIP-level market 11375
- Rents YoY
- 5.3%
- Active inventory
- 612
- Price-to-rent
- 11.0×
Monthly cashflow live
- Estimated rent
- $2,650 high interval (Pro) →
- Mortgage (P&I)
- −$1,835
- Tax est. 1.5%
- −$438 /mo · $5,250/yr
- Insurance
- −$146
- Flood insurance flood zone
- −$66 /mo · $798/yr
- HOA
- −$0
- Vacancy / Maint / Mgmt
- −$556
- Net cashflow
- $-392
Break-even live
UW: 25.0% down · 7.5% · 30yr · 1.5% tax · 5.0% vac · 8.0% maint · 8.0% mgmt
Financing live
Cash to close
- Down payment
- $87,500
- Closing costs
- $10,500
- Reserves months
- —
- Total cash needed
- —
Loan-product check · same deal, 3 products live
Conventional
25% down · 7.5% · 30yr
- Down + closing
- —
- Monthly P&I
- —
- Monthly cashflow
- —
- DSCR
- —
- Eligible?
- —
Personal DTI + credit; lowest rate.
DSCR
20% down · 8.5% · 30yr
- Down + closing
- —
- Monthly P&I
- —
- Monthly cashflow
- —
- DSCR
- —
- Eligible?
- —
No personal income docs; deal must DSCR.
Hard money
10% down · 12.0% · 12mo
- Down + closing
- —
- Monthly P&I
- —
- Monthly cashflow
- —
- DSCR
- —
- Eligible?
- —
Short-term bridge; refi at stabilization.
Rent comps 40 comps
| Address | Beds | Baths | Sqft | Rent | $/sqft | DOM | Units | Dist |
|---|---|---|---|---|---|---|---|---|
| 105-25 67th Rd Forest Hills, NY | 1.0 | 1.0 | 750 | $1,800 | $2.40 | 19d | 1 | 0.04mi |
| 102-55 67th Rd Unit 2V Forest Hills, NY | 1.0 | 1.0 | 633 | $2,350 | $3.71 | 19d | 1 | 0.05mi |
| 102-45 67th Rd Forest Hills, NY | 1.0 | 1.0 | 700 | $2,350 | $3.36 | 19d | 1 | 0.09mi |
| 6771 Yellowstone Blvd Unit 2R Forest Hills, NY | 1.0 | 1.0 | 700 | $2,550 | $3.64 | 25d | 1 | 0.09mi |
| 10210 66th Rd Unit 17B Forest Hills, NY | 2.0 | 1.0 | 1175 | $3,350 | $2.85 | 5d | 1 | 0.10mi |
| 10240 67th Dr Unit 1C Forest Hills, NY | 1.0 | 1.5 | 780 | $2,500 | $3.21 | 25d | 1 | 0.10mi |
| 10530 66th Ave Unit 3F Forest Hills, NY | 1.0 | 1.0 | 800 | $2,200 | $2.75 | 25d | 1 | 0.13mi |
| 10533 66th Ave Unit 3F Forest Hills, NY | 1.0 | 1.0 | 775 | $2,200 | $2.84 | 5d | 1 | 0.15mi |
| 102-39 66th Ave Unit 1 Flushing, NY | 2.0 | 1.0 | 981 | $3,000 | $3.06 | 1d | 1 | 0.16mi |
| 66-12 102nd St Rego Park, NY | 2.0 | 1.0 | — | $2,800 | — | 25d | 1 | 0.18mi |
| 10025 Queens Blvd Unit 3M Forest Hills, NY | 2.0 | 1.0 | 925 | $2,900 | $3.14 | 25d | 1 | 0.19mi |
| 10523 65th Rd Forest Hills, NY | 2.0 | 2.0 | 760 | $3,200 | $4.21 | 25d | 1 | 0.20mi |
| 9958 66th Ave Rego Park, NY | 2.0 | 1.0 | — | $3,020 | — | 25d | 1 | 0.21mi |
| 102-30 Queens Blvd Unit 1A Forest Hills, NY | — | 1.0 | 350 | $2,395 | $6.84 | 25d | 1 | 0.23mi |
| 6510 108th St Forest Hills, NY | 1.0–2.0 | 1.0 | — | $2,500 | — | 8d | 2 | 0.23mi |
| 6510 108th St Forest Hills, NY | 1.0 | 1.0 | — | $2,400 | — | 14d | 2 | 0.23mi |
| 6510 108th St Forest Hills, NY | 2.0 | 1.0 | — | $3,300 | — | 8d | 1 | 0.23mi |
| 10525 65th Ave Unit 4F Forest Hills, NY | 2.0 | 1.0 | 980 | $3,998 | $4.08 | 15d | 1 | 0.24mi |
| 6435 Yellowstone Blvd Unit 6G Forest Hills, NY | — | 1.0 | 575 | $1,900 | $3.30 | 19d | 1 | 0.26mi |
| 65-45 110th St Unit 2nd Floor Flushing, NY | 2.0 | 2.0 | — | $2,600 | — | 19d | 1 | 0.27mi |
| 10010 67th Rd Unit 6L Forest Hills, NY | 1.0 | 1.0 | 845 | $2,700 | $3.20 | 22d | 1 | 0.28mi |
| 120 Queens Blvd Flushing, NY | 1.0 | 1.0 | — | $1,800 | — | 19d | 1 | 0.30mi |
| 6405 Yellowstone Blvd Unit 403S Forest Hills, NY | 1.0 | 1.0 | 720 | $3,100 | $4.31 | 25d | 1 | 0.31mi |
| 6405 Yellowstone Blvd Forest Hills, NY | 1.0 | 1.0 | — | $3,200 | — | 24d | 1 | 0.31mi |
| 6405 Yellowstone Blvd Flushing, NY | 1.0 | 1.0–1.5 | 920 | $3,075 | $3.34 | 25d | 2 | 0.32mi |
| 9881 Queens Blvd Rego Park, NY | 1.0 | 1.0 | — | $3,295 | — | 25d | 1 | 0.32mi |
| 98-81 Queens Blvd Unit 15E Rego Park, NY | 1.0 | 1.0 | 700 | $3,335 | $4.76 | 5d | 1 | 0.32mi |
| 98-81 Queens Blvd Unit 14K Rego Park, NY | 2.0 | 2.0 | 950 | $4,490 | $4.73 | 13d | 1 | 0.32mi |
| 11105 66th Ave Unit 2B Forest Hills, NY | 1.0 | 1.0 | 850 | $2,600 | $3.06 | 15d | 1 | 0.32mi |
| 10460 Queens Blvd Forest Hills, NY | 1.0–2.0 | 1.0 | 916 | $3,350 | $3.66 | 5d | 2 | 0.34mi |
| 66-55 Booth St Unit 6 Rego Park, NY | — | 1.0 | 500 | $2,295 | $4.59 | 25d | 1 | 0.34mi |
| 6945 108th St Unit 3F Forest Hills, NY | 2.0 | 1.0 | 900 | $3,600 | $4.00 | 6d | 1 | 0.35mi |
| 10440 Queens Blvd Queens, NY | — | 1.0 | — | $2,750 | — | 25d | 1 | 0.35mi |
| 11131 66th Ave Unit 3C Forest Hills, NY | 1.0 | 1.0 | 600 | $2,000 | $3.33 | 5d | 1 | 0.36mi |
| 9876 Queens Blvd Unit 3A Rego Park, NY | 1.0 | 1.0 | 820 | $2,900 | $3.54 | 25d | 1 | 0.36mi |
| 105-24 63rd Dr Forest Hills, NY | — | 1.0 | — | $2,100 | — | 25d | 1 | 0.37mi |
| 10538 63rd Dr Unit 5K Forest Hills, NY | 1.0 | 1.0 | — | $2,600 | — | 25d | 1 | 0.37mi |
| 9941 64th Ave Rego Park, NY | 1.0–2.0 | 1.0 | 975 | $2,400 | $2.46 | 19d | 2 | 0.39mi |
| 9936 66th Ave Rego Park, NY | 1.0 | 1.0 | — | $2,350 | — | 25d | 1 | 0.40mi |
| 67-19 Austin St Unit 4C Flushing, NY | 2.0 | 1.0 | 800 | $3,500 | $4.38 | 14d | 1 | 0.41mi |
Listing history 13 events
-
2026-06-18days on market $350,000 Active 49 DOM
-
2026-06-17days on market $350,000 Active 48 DOM
-
2026-06-16days on market $350,000 Active 47 DOM
-
2026-06-15days on market $350,000 Active 46 DOM
-
2026-06-13days on market $350,000 Active 44 DOM
-
2026-06-10days on market $350,000 Active 40 DOM
-
2026-06-08days on market $350,000 Active 39 DOM
-
2026-06-08days on market $350,000 Active 38 DOM
-
2026-06-04days on market $350,000 Active 35 DOM
-
2026-06-03days on market $350,000 Active 34 DOM
-
2026-06-01days on market $350,000 Active 32 DOM
-
2026-05-31days on market $350,000 Active 31 DOM
-
2026-04-24$350,000 Active
ⓘ Source: listings_history table (triggers on properties + properties_extension) + one-shot
backfill from property_details.listing_events for pre-trigger history.
Climate risk First Street
- Flood 10/10 Extreme FEMA zone X (unshaded) · 99% chance over 30 yrs
- Wildfire 1/10 Low
- Heat 6/10 Major 7 d/yr ≥99°F today · 15 d/yr by 30 yrs out
- Wind 6/10 Major 27% chance of damaging wind over 30 yrs
- Air quality 4/10 Moderate 6 unhealthy d/yr today · 6 by 30 yrs out
Nearby sold comps map
Loading sold comps map…
Walkable amenities ~0.75 mi
Loading nearby amenities…
Taxation est. · year 1
- Rental income
- $31,797
- − Mortgage interest
- −$19,605
- − Property taxes
- −$5,250
- − Insurance
- −$2,548
- − Repairs & maintenance
- −$2,544
- − Management
- −$2,544
- − Depreciation
- −$10,182
- Taxable loss
- −$10,875
- Est. tax savings @ 24.0%
- +$2,610
- After-tax cash flow
- $-2,093/yr
For passive investors: Depreciation is non-cash, so a rental often shows a tax loss while cash-flowing — sheltering income. Rental losses are passive: they offset passive income freely, and up to $25,000/yr can offset ordinary (W-2) income if you actively participate and your MAGI is under $100k (phasing out to $0 by $150k); unused losses carry forward. On sale, claimed depreciation is recaptured at up to 25%, and gains may owe capital-gains tax (a 1031 exchange can defer both). Figures are a year-1 estimate at your 24.0% rate — not tax advice; consult a CPA.
Condition & rehab AI · 12 photos
This beautifully renovated one-bedroom corner apartment offers an abundance of natural light and well-designed living space. The property is move-in ready with no visible repairs needed.
Value-add opportunities
- Both Painting exterior — Enhances curb appeal and resale value
- Both Landscaping — Improves curb appeal and rental value
- Both Add smart home features — Enhances convenience and appeal
Renovation cost estimate screening
Value-add ROI direction
- Both Painting exterior — Enhances curb appeal and resale value ↑
- Both Landscaping — Improves curb appeal and rental value ↑
- Both Add smart home features — Enhances convenience and appeal ↑
ⓘ Cost ranges are severity-bucket heuristics (US national rule-of-thumb). Get contractor quotes + a written scope before underwriting a rehab budget.
Schools (NCES district)
No district data.
Livability — New York
- Score
- 75/100
- State rank
- #268
- US rank
- #4188
Category grades
Schools grade is shown separately in the Schools card above.
Census & demographics
- Census place
- New York, NY
- County
- Queens County · 1,914,869 people
- City population
- 7,731,280
- Metro
- New York-Newark-Jersey City, NY-NJ-PA
- Population (ZIP)
- 76,839
- Household income
- $105,904
- Rent vs Own
- Severe rent burden
- 4101.0
Population outlook (Queens County) Hauer SSP2
- Today (2025)
- 2,546,320 people
- By 2030
- 2,643,059 · +3.8%
- By 2040
- 2,815,563 · +10.6%
- By 2050
- 2,944,423 · +15.6%
- By 2075
- 3,123,338 · +22.7%
- By 2100
- 3,098,688 · +21.7%
Race, ethnicity, and origin ACS 2023
- Neighborhood character
- Diverse neighborhood (Simpson 0.67)
- Race & ethnicity
- White 47% Asian 28% Hispanic / Latino 16% Two or more races 11% Black 3%
- Hispanic origin (detail)
- Mexican 2% Puerto Rican 4% Dominican 1%
- Common ancestry
- Scotch-Irish 8% Romanian 4% Italian 2%
- Foreign-born
- 43% · China, Canada, Jamaica
- Languages at home
- 46% English-only · Chinese 12% Spanish 12% Russian/Polish/Slavic 11%
Political lean MEDSL · Queens
- 2024 margin
- Strong D (+24.6) · D 62.3% · R 37.7%
- 2008→2024 swing
- -26.2pp toward R · 2008: 50.8pp · 2024: 24.6pp
- All cycles
- 2024: D+24.6 2020: D+45.2 2016: D+53.4 2012: D+58.5 2008: D+50.8
Not yet ingested
- Civics
- —
Market trends
- HPI YoY
- ▼ -155.54%
- Current HPI
- 224.4903
- Rent YoY
- ▲ 5.30%
- Metro
- New York-Newark-Jersey City, NY-NJ-PA
- State GDP YoY
- ▲ 2.60%
- F500 in state
- 92
Industry mix (Fortune 500 HQ in NY)
| Industry | F500 HQs | Revenue |
|---|---|---|
| Financial Services | 10 | $950B |
|
||
| Consumer Goods | 9 | $162B |
|
||
| Insurance | 4 | $225B |
|
||
| Telecommunications | 2 | $144B |
|
||
| Pharmaceuticals | 2 | $112B |
|
||
| Media / Entertainment | 2 | $69B |
|
||
Price history
1 event — show timeline
- 2026-04-24 Listed $350,000 OneKey® MLS as Distributed by MLS Grid
Cash-flow waterfall
monthlySold comps — $/sqft
last 12 mo · ≤1 miLoading sold comps…