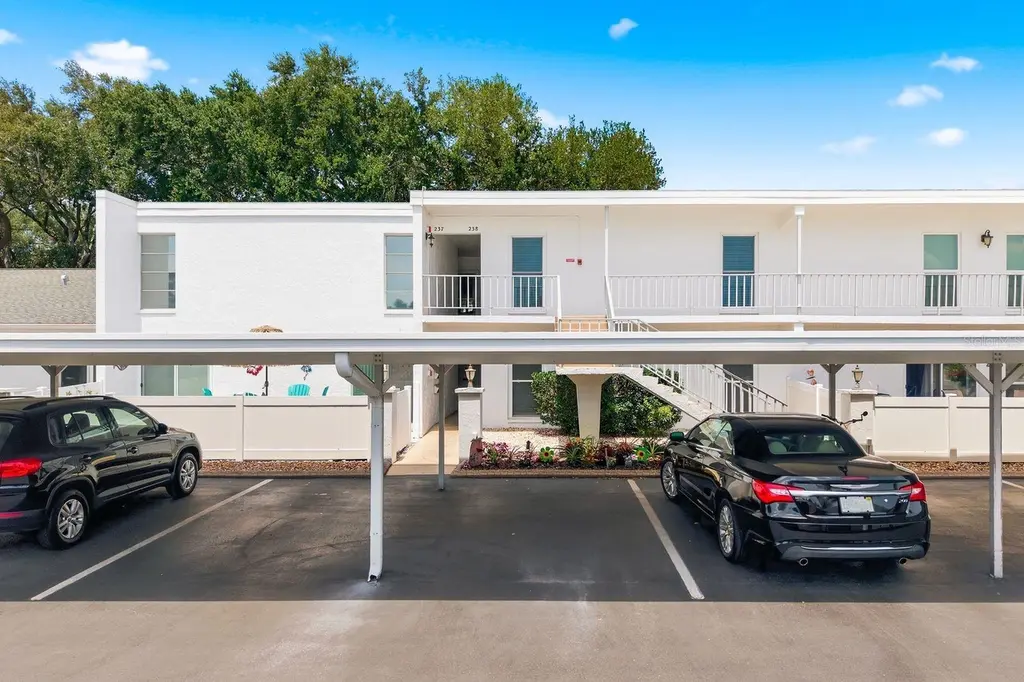
1655 S Highland Ave Unit D138 · Largo, FL
Flood risk 1/10 · Minimal
- FEMA flood zone
- X (unshaded)
- Chance of flooding over 30 yrs
- 0.0%
- Est. flood insurance / yr
- $507 – $1,088
Fire risk 1/10 · Minimal
- Est. fire insurance / yr
- $947 – $1,759
Heat risk 10/10 · Severe
- Hot days now (above 108°F)
- 7 days/yr
- Hot days in 30 yrs
- 25 days/yr
Wind risk 10/10 · Severe
- Chance of severe wind over 30 yrs
- 99.0%
Air-quality risk 3/10 · Minor
- Unhealthy air days now
- 2 days/yr
- Unhealthy air days in 30 yrs
- 3 days/yr
Risk factors via First Street. Map © Google.
Why this score? — see what drove the C+ grade
The composite is a weighted blend of 9 inputs, each scored 0–100. Each bar is that input's sub-score; the figure is the points it added to the 100-point composite (weight × sub-score).
- Cash flow +24.9/30.0
- 1% rule +10.0/10.0
- DSCR +8.1/10.0
- ARV discount +7.5/15.0
- Schools +4.3/10.0
- Livability +4.1/5.0
- Condition / age +2.5/5.0
- Rent growth +1.9/5.0
- Appreciation +0.0/10.0
$124,900
🖨 Deal sheet 📄 Offer letter ✓ Due diligence
Listing remarks
Under contract-accepting backup offers. Welcome home! This ground floor 55+ condo in Penthouse Groves is now available! Condo features convenient reserved carport parking, spacious 1,270 sqft, 2 full bathrooms, ceramic tile throughout, washer/dryer inside and Florida room with storage closet. Primary bedroom has large walk-in closet. Rear sliding glass door leads to a small patio and a large community greenspace with oak trees and sidewalk. Community is well maintained featuring a pool, clubhouse and recreational activities. Close to shopping centers and Publix. Low condo fee. Non-flood zone. Schedule your private showing today!
Key facts
- Ground floor condo
- Florida room
- Community greenspace
Tags
Property features AI
Finance
- Financial info: Lease restrictions apply
- HOA & community: Has HOA; Monthly condo fee of $640 (total monthly fees $640; total annual fees $7,680); Association approval required; Association fees cover cable TV, escrow reserves, insurance, structure maintenance, grounds maintenance, recreational facilities, sewer, and trash; Community amenities: clubhouse, pool, sidewalks; Senior community; Pets allowed
Exterior
- Parking: Carport with 1 space
- Utilities: Public water; Public sewer; Electricity connected; Sewer connected
- Home design: Condominium; Residential property; Single-story; Entry on first floor; Faces south
- Construction: Block and frame construction; Membrane roof; Slab foundation; Building/Unit in building D
- Exterior features: Private mailbox; Sidewalk; Landscaped grounds; Level lot; Street dead-end; Paved surfaces; Asphalt road
Interior
- Kitchen: Dishwasher; Refrigerator
- Bedrooms: 2 bedrooms (1st floor)
- Flooring: Tile
- Bathrooms: 2 full bathrooms
- Heating & cooling: Central heating; Central air
- Interior features: Thermostat; 3 total rooms
- Laundry & utility: Washer; Dryer; Inside laundry
Neighborhood map
What this means for you Summary
Snapshot
- This is a 2-bed/2.0-bath condo listed at $125k.
Deal economics
- At list price, monthly cash flow is $267 ($3k/yr) — positive.
- The deal already cash-flows at list — no discount required.
- Meets the 1% rule at list price ($2k rent vs $125k).
- Recommended offer: $121k (3.0% below list) — sets the bar for market timing.
- Cap rate 8.9% vs local median 4.2% in Largo — top-decile yield for the area; either an underpriced asset or a hidden risk that comps aren't pricing in. Stress-test before assuming the spread holds.
Location & tenants
- Location reads 82/100 on livability (#82 in FL, #1,240 nationally) — a professional / high-income tenant draw. Strengths: commute A+, cost of living A+, housing A+; Watch: employment D+, amenities F.
- Pinellas (suburban): math 51% / reading 51% proficiency, ranked #31 of 73 in FL (top 42%) — acceptable for families but not a draw, mixed tenant base, ~2y average lease.
- Market conditions: Rents soft (-2.2%/yr); 355 active listings in the ZIP; 40 comparable units currently listed for rent nearby; rentals leasing fast (median 11d on market — plan ~1-2 weeks tenant-placement turnaround); 2,676 units permitted in Pinellas County in 2024 (1,422 in 5+ unit buildings).
- This rent runs 43% of the median local income ($62k/yr) — at the standard rent-burdened threshold; future hikes will face affordability resistance.
Forward outlook
- Local home prices are declining (-3.0%/yr); year-one equity from $864 of loan paydown is wiped out by about $4k of value loss. Plan a longer hold.
- Pinellas County population projected at +14% by 2050 — modest demand growth; plan on rents tracking national, not racing it.
Negotiation context
- It's been on market 52 days — a 3% lower offer ($121k) is reasonable based on typical stale-listing flexibility.
- Current owner paid $94k; 33% above their basis — modest negotiation headroom, anchor on the comps not their cost.
Risks & watch-outs
- Watch-outs: HOA is 29% of rent.
- Climate carrying-cost: severe wind risk, 99% chance of damaging wind over 30y; extreme-heat days projected 7→25/yr by 2055 (HVAC capex compounding) — expect insurance premiums to compound above CPI over the hold.
Questions for the listing agent
- It's been on market 52 days. Have you received any prior offers? Is the seller open to a 3% concession, seller financing, or rate buy-down credit?
- Built in 1971 — when were the roof, HVAC, electrical panel, plumbing, and water heater last replaced?
- What does the HOA fee cover, when was the last increase, and are there any pending special assessments or reserve-fund shortfalls?
- Any open or pending special assessments — roof, HVAC, plumbing, elevator, façade? What's the per-unit balance and payoff schedule, and is the seller paying it off at close or rolling it to the buyer?
- Is there a deadline driving the sale (1031 exchange, divorce, estate, relocation)? That informs how much negotiation room exists.
- What's the average days-on-market for RENTAL listings here right now (not sales)? A rising rental-DOM trend means longer vacancies and softer asking-rent achievability than the comps imply.
- What's the recent tenant-quality profile in this submarket — average credit score on applications, eviction rate, late-payment / NSF rate, and stable-employment percentage? A property-management company in the area should have these aggregated.
- How much new apartment / multifamily construction is in the pipeline within 1–3 miles? Heavy new supply (>2% of stock underway) typically softens rents 12–24 months out; light construction supports rent growth.
Investment metrics
- 1% rule
- 1.79% ✓
- Cap rate
- 8.86%
- Cash-on-cash
- 9.17%
- DSCR
- 1.41
- GRM
- 4.6
CMA / ARV
No comps found within radius.
Projected returns pro-forma
-3.0% appreciation · 0.0% rent growth · sell at horizon
- IRR
- -7.6%
- Equity multiple
- 0.73×
- Total profit
- $-9,365
- Equity at exit
- $18,623
- IRR
- -5.5%
- Equity multiple
- 0.72×
- Total profit
- $-9,891
- Equity at exit
- $10,799
Cash invested: $34,972 (down + closing). Projections, not guarantees.
Landlord ↔ Tenant lean methodology
- Overall (STATE)
- 87 Strongly Landlord-Friendly
- State Florida
- 87 Strongly Landlord-Friendly · R+3
- County
- — inherits STATE
- City
- — inherits STATE
ZIP-level market 33756
- Rents YoY
- -2.2%
- Active inventory
- 355
- Price-to-rent
- 4.6×
Monthly cashflow live
- Estimated rent
- $2,241 high interval (Pro) →
- Mortgage (P&I)
- −$655
- Tax est. 1.5%
- −$156 /mo · $1,874/yr
- Insurance
- −$52
- HOA
- −$640
- Vacancy / Maint / Mgmt
- −$471
- Net cashflow
- $267
Break-even live
UW: 25.0% down · 7.5% · 30yr · 1.5% tax · 5.0% vac · 8.0% maint · 8.0% mgmt
Financing live
Cash to close
- Down payment
- $31,225
- Closing costs
- $3,747
- Reserves months
- —
- Total cash needed
- —
Loan-product check · same deal, 3 products live
Conventional
25% down · 7.5% · 30yr
- Down + closing
- —
- Monthly P&I
- —
- Monthly cashflow
- —
- DSCR
- —
- Eligible?
- —
Personal DTI + credit; lowest rate.
DSCR
20% down · 8.5% · 30yr
- Down + closing
- —
- Monthly P&I
- —
- Monthly cashflow
- —
- DSCR
- —
- Eligible?
- —
No personal income docs; deal must DSCR.
Hard money
10% down · 12.0% · 12mo
- Down + closing
- —
- Monthly P&I
- —
- Monthly cashflow
- —
- DSCR
- —
- Eligible?
- —
Short-term bridge; refi at stabilization.
Rent comps 40 comps
| Address | Beds | Baths | Sqft | Rent | $/sqft | DOM | Units | Dist |
|---|---|---|---|---|---|---|---|---|
| 1657 S Lake Ave Clearwater, FL | 2.0 | 2.0 | 1250 | $1,550 | $1.24 | 17d | 1 | 0.32mi |
| 1526 Caldera Ct Clearwater, FL | 3.0 | 2.5 | 1816 | $2,900 | $1.60 | 14d | 1 | 0.37mi |
| 1845 S Highland Ave Clearwater, FL | 2.0 | 2.0 | 904 | $1,525 | $1.69 | 2d | 2 | 0.43mi |
| 1310 Bayview Dr Clearwater, FL | 3.0 | 2.0 | 1500 | $3,300 | $2.20 | 24d | 1 | 0.47mi |
| 1679 Leisure Dr Clearwater, FL | 3.0 | 2.0 | 1497 | $3,200 | $2.14 | 1d | 1 | 0.52mi |
| 1321 Chesterfield Dr Unit 1018173P Clearwater, FL | 3.0 | 2.0 | 1356 | $3,967 | $2.93 | 1d | 1 | 0.53mi |
| 1812 Lady Mary Dr Clearwater, FL | 3.0 | 2.0 | 1531 | $2,800 | $1.83 | 3d | 1 | 0.53mi |
| 1523 S Fredrica Ave Clearwater, FL | 3.0 | 2.0 | 1284 | $2,550 | $1.99 | 24d | 1 | 0.59mi |
| 1500 Laurel Cir Clearwater, FL | 3.0 | 2.0 | 1530 | $2,650 | $1.73 | 3d | 1 | 0.60mi |
| 1406 Lemon St Clearwater, FL | 2.0 | 1.5 | 1020 | $1,990 | $1.95 | 24d | 1 | 0.61mi |
| 1624 Fruitwood Dr Clearwater, FL | 2.0 | 2.0 | 1298 | $2,500 | $1.93 | 24d | 1 | 0.69mi |
| 1700 Rosery Rd NE Largo, FL | 2.0 | 2.0 | 1223 | $2,300 | $1.88 | 7d | 1 | 0.71mi |
| 1119 Breeze Dr Largo, FL | 3.0 | 2.0 | 1314 | $2,475 | $1.88 | 24d | 1 | 0.71mi |
| 601 Rosery Rd NE Largo, FL | 1.0–3.0 | 1.0–2.5 | 1192 | $1,830 | $1.54 | 1d | 38 | 0.78mi |
| 1619 Pinewood Dr Clearwater, FL | 2.0 | 2.0 | 1507 | $2,425 | $1.61 | 24d | 1 | 0.84mi |
| 401 Rosery Rd NE Largo, FL | 2.0 | 1.0–2.0 | 850 | $1,879 | $2.21 | 1d | 31 | 0.86mi |
| 1128 Belleair Rd Unit Home Clearwater, FL | 3.0 | 1.0 | 1326 | $1,695 | $1.28 | 24d | 1 | 0.94mi |
| 1532 S Washington Ave Clearwater, FL | 3.0 | 2.0 | 954 | $1,500 | $1.57 | 4d | 1 | 0.99mi |
| 1353 Lakeview Rd Clearwater, FL | 3.0 | 1.0 | 1360 | $1,995 | $1.47 | 24d | 1 | 0.99mi |
| 1524 Lakeview Rd Clearwater, FL | 2.0 | 2.0 | 1100 | $1,395 | $1.27 | 24d | 1 | 0.99mi |
| 1536 Illinois Rd Clearwater, FL | 2.0 | 1.0 | 1440 | $2,200 | $1.53 | 4d | 1 | 1.07mi |
| 1574 Ewing Ave Clearwater, FL | 3.0 | 2.0 | 1324 | $2,700 | $2.04 | 3d | 1 | 1.08mi |
| 516 5th Ave NE Largo, FL | 3.0 | 2.0 | 1073 | $2,250 | $2.10 | 14d | 1 | 1.09mi |
| 516 5th Ave NE Largo, FL | 3.0 | 2.0 | 1057 | $2,250 | $2.13 | 23d | 1 | 1.09mi |
| 1530 S Martin Luther King Jr Ave Clearwater, FL | 3.0 | 2.0 | 1025 | $1,950 | $1.90 | 24d | 1 | 1.09mi |
| 1530 S Martin Luther King Jr Ave Clearwater, FL | 3.0 | 2.0 | 1025 | $1,995 | $1.95 | 10d | 1 | 1.09mi |
| 221 Lake Ave NE Largo, FL | 1.0–2.0 | 1.0–2.0 | 1095 | $2,160 | $1.97 | 2d | 11 | 1.17mi |
| 101 Imperial Palm Dr Largo, FL | 1.0–2.0 | 1.0–2.0 | 907 | $1,810 | $1.99 | 2d | 35 | 1.17mi |
| 1192 S Duncan Ave Clearwater, FL | 2.0 | 2.0 | 1395 | $2,500 | $1.79 | 3d | 1 | 1.17mi |
| 705 3rd Ave NE Unit C Largo, FL | 3.0 | 2.0 | 1113 | $2,195 | $1.97 | 3d | 1 | 1.20mi |
| 1657 S Lake Dr Unit 3 Clearwater, FL | 2.0 | 2.0 | 1250 | $1,550 | $1.24 | 17d | 1 | 1.22mi |
| 1571 S Myrtle Ave Clearwater, FL | 3.0 | 2.0 | 1202 | $2,400 | $2.00 | 24d | 1 | 1.28mi |
| 1432 Lotus Path Clearwater, FL | 2.0 | 1.0 | 900 | $1,750 | $1.94 | 10d | 1 | 1.29mi |
| 1581 Lotus Path Clearwater, FL | 3.0 | 2.0 | 1690 | $3,400 | $2.01 | 4d | 1 | 1.30mi |
| 1009 Chester Dr Clearwater, FL | 3.0 | 2.0 | 1105 | $2,500 | $2.26 | 11d | 1 | 1.34mi |
| 1552 S Myrtle Ave Clearwater, FL | 3.0 | 2.0 | 900 | $1,950 | $2.17 | 7d | 1 | 1.35mi |
| 1119 Tuskawilla Dr Clearwater, FL | 2.0 | 1.0 | 603 | $1,500 | $2.49 | 1d | 23 | 1.36mi |
| 821 14th Ave NW Largo, FL | 3.0 | 1.0 | 900 | $1,795 | $1.99 | 24d | 1 | 1.42mi |
| 1216 S Missouri Ave Clearwater, FL | 1.0–2.0 | 1.0–2.0 | 835 | $2,100 | $2.51 | 24d | 5 | 1.44mi |
| 1216 S Missouri Ave Clearwater, FL | 1.0–2.0 | 1.0–2.0 | 835 | $2,000 | $2.40 | 1d | 6 | 1.44mi |
HOA detail condo
- Monthly dues
- $640 · $7,680/yr
- Likely covers
- pool
- Assessments
- None detected in remarks — confirm with the listing agent.
Listing history 18 events
-
2026-06-18days on market $124,900 Active 52 DOM
-
2026-06-17days on market $124,900 Active 51 DOM
-
2026-06-16days on market $124,900 Active 50 DOM
-
2026-06-15status $124,900 Active 49 DOM
-
2026-06-13remarks 636-char remark
-
2026-06-13statusdays on market $124,900 Pending 49 DOM
-
2026-06-09days on market $124,900 Active 48 DOM
-
2026-06-08days on market $124,900 Active 47 DOM
-
2026-06-07days on market $124,900 Active 46 DOM
-
2026-06-04days on market $124,900 Active 43 DOM
-
2026-06-03days on market $124,900 Active 42 DOM
-
2026-06-01days on market $124,900 Active 40 DOM
-
2026-05-31days on market $124,900 Active 39 DOM
-
2026-05-13price $124,900
-
2026-04-22$149,000 Active
-
2003-08-07soldstatus $93,800
-
1999-09-22soldstatus $64,000
-
1995-08-31soldstatus $57,500
ⓘ Source: listings_history table (triggers on properties + properties_extension) + one-shot
backfill from property_details.listing_events for pre-trigger history.
Climate risk First Street
- Flood 1/10 Low FEMA zone X (unshaded) · 0% chance over 30 yrs
- Wildfire 1/10 Low
- Heat 10/10 Extreme 7 d/yr ≥108°F today · 25 d/yr by 30 yrs out
- Wind 10/10 Extreme 99% chance of damaging wind over 30 yrs
- Air quality 3/10 Moderate 2 unhealthy d/yr today · 3 by 30 yrs out
Nearby sold comps map
Loading sold comps map…
Walkable amenities ~0.75 mi
Loading nearby amenities…
Taxation est. · year 1
- Rental income
- $26,890
- − Mortgage interest
- −$6,996
- − Property taxes
- −$1,874
- − Insurance
- −$624
- − Repairs & maintenance
- −$2,151
- − Management
- −$2,151
- − HOA
- −$7,680
- − Depreciation
- −$3,633
- Taxable income
- $1,780
- Est. tax owed @ 24.0%
- −$427
- After-tax cash flow
- $2,778/yr
For passive investors: Depreciation is non-cash, so a rental often shows a tax loss while cash-flowing — sheltering income. Rental losses are passive: they offset passive income freely, and up to $25,000/yr can offset ordinary (W-2) income if you actively participate and your MAGI is under $100k (phasing out to $0 by $150k); unused losses carry forward. On sale, claimed depreciation is recaptured at up to 25%, and gains may owe capital-gains tax (a 1031 exchange can defer both). Figures are a year-1 estimate at your 24.0% rate — not tax advice; consult a CPA.
Schools (NCES district)
- District
- Pinellas
- NCES district ID
- 1201560
- Math proficiency
- 51% ▼ -5.00%
- Reading proficiency
- 51% ▼ -3.00%
- Median HH income
- $46,270
- Composite
- 43.27/100
- National rank
- #3046
- State rank
- #31 of 73 in FL
Livability — Largo
- Score
- 82/100
- State rank
- #82
- US rank
- #1240
Category grades
Schools grade is shown separately in the Schools card above.
Census & demographics
- Census place
- Largo, FL
- County
- Pinellas County · 939,478 people
- City population
- 106,311
- Metro
- Tampa-St. Petersburg-Clearwater, FL
- Population (ZIP)
- 32,201
- Household income
- $61,872
- Rent vs Own
- Severe rent burden
- 1868.0
Population outlook (Pinellas County) Hauer SSP2
- Today (2025)
- 1,027,532 people
- By 2030
- 1,063,586 · +3.5%
- By 2040
- 1,125,020 · +9.5%
- By 2050
- 1,168,637 · +13.7%
- By 2075
- 1,265,188 · +23.1%
- By 2100
- 1,260,357 · +22.7%
Race, ethnicity, and origin ACS 2023
- Neighborhood character
- Majority White (64%)
- Race & ethnicity
- White 64% Hispanic / Latino 18% Black 11% Two or more races 9% Asian 3%
- Hispanic origin (detail)
- Mexican 8% Puerto Rican 5%
- Common ancestry
- Romanian 3% Lithuanian 2% Slovak 2%
- Foreign-born
- 16% · Canada
- Languages at home
- 79% English-only · Spanish 14% Other Indo-European 2% Russian/Polish/Slavic 2%
Political lean MEDSL · Pinellas
- 2024 margin
- Lean R (+5.2) · D 46.9% · R 52.1%
- 2008→2024 swing
- -13.5pp toward R · 2008: 8.3pp · 2024: -5.2pp
- All cycles
- 2024: R+5.2 2020: D+0.2 2016: R+1.1 2012: D+5.6 2008: D+8.3
Not yet ingested
- Civics
- —
Market trends
- HPI YoY
- ▼ -438.74%
- Current HPI
- 354.6792
- Rent YoY
- ▼ -2.22%
- Metro
- Tampa-St. Petersburg-Clearwater, FL
- State GDP YoY
- ▲ 3.28%
- F500 in state
- 36
Industry mix (Fortune 500 HQ in FL)
| Industry | F500 HQs | Revenue |
|---|---|---|
| Industrial Technology | 2 | $29B |
|
||
| Insurance | 2 | $17B |
|
||
| Retail | 1 | $60B |
|
||
| Technology Distribution | 1 | $58B |
|
||
| Homebuilding | 1 | $35B |
|
||
| Technology Manufacturing | 1 | $35B |
|
||
Price history
+117.2% since first listed5 events — show timeline
- 2026-05-13 Price Changed $124,900 Stellar MLS as Distributed by MLS Grid
- 2026-04-22 Listed $149,000 Stellar MLS as Distributed by MLS Grid
- 2003-08-07 Sold (Public Records) $93,800 Public Records
- 1999-09-22 Sold (Public Records) $64,000 Public Records
- 1995-08-31 Sold (Public Records) $57,500 Public Records
Property tax history
-9.8%/yrLatest (2025): $240 · +8.1% YoY. Source: county tax records.
Cash-flow waterfall
monthlySold comps — $/sqft
last 12 mo · ≤1 miLoading sold comps…