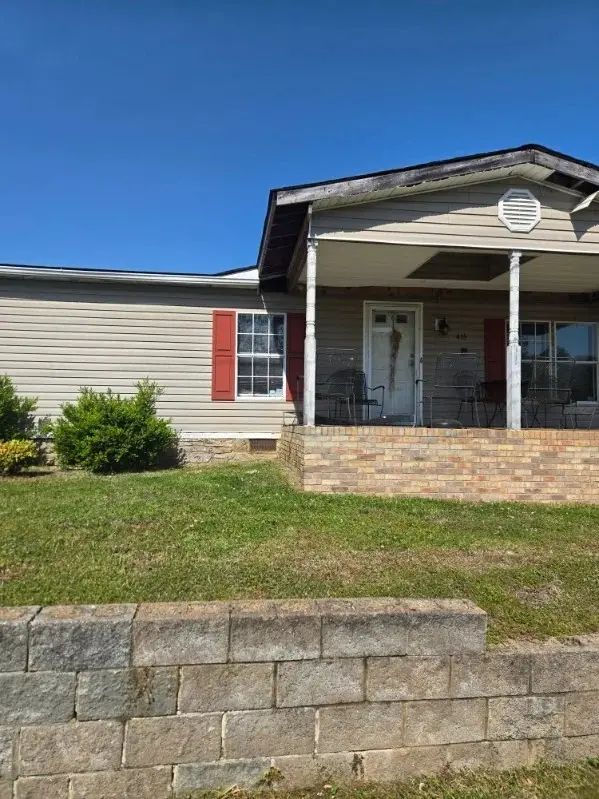
415 E 11th St · Columbia, TN
Flood risk 1/10 · Minimal
- FEMA flood zone
- X (unshaded)
- Chance of flooding over 30 yrs
- 0.0%
- Est. flood insurance / yr
- $507 – $1,088
Fire risk 3/10 · Minor
- Est. fire insurance / yr
- $949 – $1,763
Heat risk 6/10 · Moderate
- Hot days now (above 106°F)
- 7 days/yr
- Hot days in 30 yrs
- 19 days/yr
Wind risk 4/10 · Minor
- Chance of severe wind over 30 yrs
- 15.0%
Air-quality risk 1/10 · Minimal
- Unhealthy air days now
- 0 days/yr
- Unhealthy air days in 30 yrs
- 0 days/yr
Risk factors via First Street. Map © Google.
Why this score? — see what drove the B grade
The composite is a weighted blend of 9 inputs, each scored 0–100. Each bar is that input's sub-score; the figure is the points it added to the 100-point composite (weight × sub-score).
- Cash flow +30.0/30.0
- ARV discount +15.0/15.0
- DSCR +10.0/10.0
- 1% rule +8.7/10.0
- Rent growth +3.7/5.0
- Livability +3.2/5.0
- Condition / age +2.5/5.0
- Schools +1.8/10.0
- Appreciation +0.0/10.0
$139,000
🖨 Deal sheet 📄 Offer letter ✓ Due diligence
Listing remarks
Attention investors and DIY enthusiasts! Multiple exit strategies: finish this remodel then either flip, rent or move in! Home being sold as is. Cash preferred but will consider financed all offers. Seller is assisted by an Attorney in Fact. Do not knock on door or approach house without prior communication.
Key facts
- 8,276 sq ft lot
- Built 1997
- Listed 14 days
Property features AI
Exterior
- Parking: No covered parking; No recorded parking spaces
- Utilities: Other water source; Other sewer
- Home design: Manufactured on land; One level
- Construction: Other construction materials; Slab foundation; Existing year built
- Exterior features: Lot approximately 0.19 acres (52 x 150)
Interior
- Kitchen: Washer listed under appliances
- Bedrooms: 4 bedrooms (all on the main level)
- Flooring: Other flooring
- Bathrooms: 2 full bathrooms
- Heating & cooling: Heating present (other type); Cooling present (other type)
- Interior features: No basement; Other flooring
- Laundry & utility: Washer
Neighborhood map
What this means for you Summary
Snapshot
- This is a 4-bed/2.0-bath single-family listed at $139k.
Deal economics
- At list price, monthly cash flow is $650 ($8k/yr) — positive.
- The deal already cash-flows at list — no discount required.
- Meets the 1% rule at list price ($2k rent vs $139k).
- Cap rate 11.9% vs local median 2.8% in Columbia — top-decile yield for the area; either an underpriced asset or a hidden risk that comps aren't pricing in. Stress-test before assuming the spread holds.
Location & tenants
- Location reads 63/100 on livability (#207 in TN) — a middle-class / working-renter tenant base. Strengths: cost of living A+, housing A+; Watch: employment C-, health & safety C-, crime F.
- Maury County (town): math 19% / reading 21% proficiency, ranked #108 of 139 in TN (top 78%) — low school quality limits family demand, transient renter base, plan for 1-2y turnover.
- Zoned schools: R Howell Elementary (math 22% / reading 17%, grade F, #654 of 952 statewide, top 72%, 645 students, 0% FRL); Columbia Central High School (math 7% / reading 27%, grade F, #225 of 332 statewide, top 69%, 1,474 students, 0% FRL) — zoned schools average 0% FRL vs 48% district-wide (48 pts lower); this property's tenant base skews higher-income than the district average.
- Market conditions: Rents rising fast (+5.0%/yr); 1118 active listings in the ZIP; 12 comparable units currently listed for rent nearby; rentals at typical pace (median 24d on market — plan ~3-4 weeks tenant-placement turnaround); 42% of comp listings sitting > 30 days — soft ceiling on asking rent; 1,650 units permitted in Maury County in 2024 (60 in 5+ unit buildings).
- This rent runs 33% of the median local income ($68k/yr) — at the standard rent-burdened threshold; future hikes will face affordability resistance.
Forward outlook
- Local home prices are declining (-3.0%/yr); year-one equity from $961 of loan paydown is wiped out by about $4k of value loss. Plan a longer hold.
- Maury County population projected at +34% by 2050 — long-run rental-demand tailwind backs the buy-and-hold thesis.
- At projected returns (-3.0% appreciation + 5.0% rent growth), your $39k cash investment doubles in ~6 years — after that, you're playing with house money.
Negotiation context
- Only 14 days on market — expect competitive offers; lowballing is unlikely to land.
Risks & watch-outs
- Climate carrying-cost: extreme-heat days projected 7→19/yr by 2055 (HVAC capex compounding) — expect insurance premiums to compound above CPI over the hold.
Questions for the listing agent
- Is there a deadline driving the sale (1031 exchange, divorce, estate, relocation)? That informs how much negotiation room exists.
- Schools are F-rated, which usually means shorter tenancies and higher turnover. Who's the typical renter profile here, and what's been the actual vacancy rate?
- Crime grade is F in this area — have there been break-ins, vandalism, or insurance claims at this property in the last 3 years? What carrier currently insures it and at what premium?
- What's the average days-on-market for RENTAL listings here right now (not sales)? A rising rental-DOM trend means longer vacancies and softer asking-rent achievability than the comps imply.
- What's the recent tenant-quality profile in this submarket — average credit score on applications, eviction rate, late-payment / NSF rate, and stable-employment percentage? A property-management company in the area should have these aggregated.
- How much new for-sale + rental construction is in the pipeline within 1–3 miles? Heavy new supply typically softens prices + rents 12–24 months out; constrained supply supports both.
Investment metrics
- 1% rule
- 1.37% ✓
- Cap rate
- 11.90%
- Cash-on-cash
- 20.04%
- DSCR
- 1.89
- GRM
- 6.1
CMA / ARV
- ARV (on-the-fly)
- $274,176
- Comps found
- 12
Show comp detail 12 sales within ~0.75 mi
| Address | Dist | Beds/Ba | Sqft | Sold | Price | $/sf | Match |
|---|---|---|---|---|---|---|---|
| 318 E 11th St | 0.09mi | 3/2.0 (-1) | 1,275 (-5%) | 2mo | $215,000 | $169 | 81 |
| 1057 Mapleash Ave | 0.41mi | 3/1.5 (-1) | 1,387 (+3%) | 3mo | $195,000 | $141 | 66 |
| 503 E 8th St | 0.40mi | 3/2.0 (-1) | 1,250 (-7%) | 3mo | $284,900 | $228 | 62 |
| 819 Woodside St | 0.43mi | 3/2.0 (-1) | 1,241 (-8%) | 10mo | $240,000 | $193 | 54 |
| 310 E 15th St | 0.39mi | 3/2.0 (-1) | 1,192 (-11%) | 6mo | $180,000 | $151 | 53 |
| 310 E Highland Dr | 0.68mi | 3/2.0 (-1) | 1,327 (-1%) | 10mo | $299,000 | $225 | 53 |
| 1413 Highland Ave | 0.55mi | 3/1.0 (-1) | 1,302 (-3%) | 9mo | $200,000 | $154 | 52 |
| 606B E 10th St | 0.15mi | 3/1.5 (-1) | 1,152 (-14%) | 14mo | $235,000 | $204 | 51 |
| 513 E 9th St | 0.29mi | 3/2.0 (-1) | 1,532 (+14%) | 10mo | $99,000 | $65 | 50 |
| 525 Hutton Dr | 0.70mi | 3/2.0 (-1) | 1,302 (-3%) | 10mo | $340,000 | $261 | 48 |
| 451 Mooresville Pike | 0.63mi | 3/2.0 (-1) | 1,241 (-8%) | 13mo | $305,000 | $246 | 42 |
| 1006 S High St | 0.61mi | 3/1.0 (-1) | 1,521 (+13%) | 4mo | $395,000 | $260 | 37 |
Match score weights: distance 35% · size 25% · config 20% · recency 20%. Top-matched comps best support the ARV.
Projected returns pro-forma
-3.0% appreciation · 4.97% rent growth · sell at horizon
- IRR
- 14.2%
- Equity multiple
- 1.58×
- Total profit
- $22,679
- Equity at exit
- $20,725
- IRR
- 24.4%
- Equity multiple
- 3.29×
- Total profit
- $89,312
- Equity at exit
- $12,018
Cash invested: $38,920 (down + closing). Projections, not guarantees.
Landlord ↔ Tenant lean methodology
- Overall (STATE)
- 87 Strongly Landlord-Friendly
- State Tennessee
- 87 Strongly Landlord-Friendly · R+13
- County
- — inherits STATE
- City
- — inherits STATE
ZIP-level market 38401
- Home prices YoY
- -22.7%
- Rents YoY
- 5.0%
- Active inventory
- 1118
- Price-to-rent
- 6.1×
Monthly cashflow live
- Estimated rent
- $1,901 high interval (Pro) →
- Mortgage (P&I)
- −$729
- Tax from tax record
- −$65 /mo · $776/yr
- Insurance
- −$58
- HOA
- −$0
- Vacancy / Maint / Mgmt
- −$399
- Net cashflow
- $650
Break-even live
UW: 25.0% down · 7.5% · 30yr · 1.5% tax · 5.0% vac · 8.0% maint · 8.0% mgmt
Financing live
Cash to close
- Down payment
- $34,750
- Closing costs
- $4,170
- Reserves months
- —
- Total cash needed
- —
Loan-product check · same deal, 3 products live
Conventional
25% down · 7.5% · 30yr
- Down + closing
- —
- Monthly P&I
- —
- Monthly cashflow
- —
- DSCR
- —
- Eligible?
- —
Personal DTI + credit; lowest rate.
DSCR
20% down · 8.5% · 30yr
- Down + closing
- —
- Monthly P&I
- —
- Monthly cashflow
- —
- DSCR
- —
- Eligible?
- —
No personal income docs; deal must DSCR.
Hard money
10% down · 12.0% · 12mo
- Down + closing
- —
- Monthly P&I
- —
- Monthly cashflow
- —
- DSCR
- —
- Eligible?
- —
Short-term bridge; refi at stabilization.
Rent comps 12 comps
| Address | Beds | Baths | Sqft | Rent | $/sqft | DOM | Units | Dist |
|---|---|---|---|---|---|---|---|---|
| 505 Washington St Columbia, TN | 3.0 | 2.0 | 1241 | $1,950 | $1.57 | 44d | 1 | 0.10mi |
| 915 Mapleash Ave Columbia, TN | 4.0 | 2.0 | 1308 | $1,995 | $1.53 | 44d | 1 | 0.36mi |
| 908 Mapleash Ave Columbia, TN | 3.0 | 2.0 | 1112 | $1,750 | $1.57 | 17d | 1 | 0.39mi |
| 329 E 18th St Columbia, TN | 3.0 | 3.0 | 1720 | $1,795 | $1.04 | 44d | 1 | 0.57mi |
| 314 E 18th St Columbia, TN | 3.0 | 1.0 | 988 | $999 | $1.01 | 15d | 1 | 0.60mi |
| 100 Stonebridge Way Columbia, TN | 2.0–3.0 | 2.0 | 1067 | $1,485 | $1.39 | 2d | 4 | 0.70mi |
| 615 N High St Unit B Columbia, TN | 3.0 | 2.5 | 1200 | $1,300 | $1.08 | 23d | 1 | 0.85mi |
| 202 3rd Ave Columbia, TN | 3.0 | 1.5 | 1600 | $2,000 | $1.25 | 3d | 1 | 0.97mi |
| 405 Fleming St Columbia, TN | 3.0 | 2.0 | 1470 | $1,700 | $1.16 | 44d | 1 | 1.18mi |
| 600 Hallmark Dr Columbia, TN | 3.0 | 2.0 | 1138 | $1,479 | $1.30 | 44d | 3 | 1.19mi |
| 1923 Woodmont Dr Columbia, TN | 3.0 | 1.0 | 1222 | $1,700 | $1.39 | 23d | 1 | 1.32mi |
| 700 Fleming St Columbia, TN | 3.0 | 1.5 | 1008 | $1,650 | $1.64 | 7d | 1 | 1.36mi |
Listing history 8 events
-
2026-06-09days on market $139,000 Active 14 DOM
-
2026-06-08days on market $139,000 Active 13 DOM
-
2026-06-07days on market $139,000 Active 12 DOM
-
2026-06-03days on market $139,000 Active 8 DOM
-
2026-06-02days on market $139,000 Active 7 DOM
-
2026-06-01days on market $139,000 Active 6 DOM
-
2026-05-31days on market $139,000 Active 5 DOM
-
2026-05-26$139,000 Active
ⓘ Source: listings_history table (triggers on properties + properties_extension) + one-shot
backfill from property_details.listing_events for pre-trigger history.
Tax reassessment forecast TN · Resets to sale price
- Current annual tax
- $776 · $65/mo
- Projected year-2 tax
- $987 · $82/mo
- Expected delta
- +$211/yr (+$18/mo · 27.2%)
ⓘ Screening estimate from a state-policy table — verify with the county assessor before closing.
Climate risk First Street
- Flood 1/10 Low FEMA zone X (unshaded) · 0% chance over 30 yrs
- Wildfire 3/10 Moderate
- Heat 6/10 Major 7 d/yr ≥106°F today · 19 d/yr by 30 yrs out
- Wind 4/10 Moderate 15% chance of damaging wind over 30 yrs
- Air quality 1/10 Low 0 unhealthy d/yr today · 0 by 30 yrs out
Nearby sold comps map
Loading sold comps map…
Walkable amenities ~0.75 mi
Loading nearby amenities…
Taxation est. · year 1
- Rental income
- $22,808
- − Mortgage interest
- −$7,786
- − Property taxes
- −$776
- − Insurance
- −$695
- − Repairs & maintenance
- −$1,825
- − Management
- −$1,825
- − Depreciation
- −$4,044
- Taxable income
- $5,858
- Est. tax owed @ 24.0%
- −$1,406
- After-tax cash flow
- $6,394/yr
For passive investors: Depreciation is non-cash, so a rental often shows a tax loss while cash-flowing — sheltering income. Rental losses are passive: they offset passive income freely, and up to $25,000/yr can offset ordinary (W-2) income if you actively participate and your MAGI is under $100k (phasing out to $0 by $150k); unused losses carry forward. On sale, claimed depreciation is recaptured at up to 25%, and gains may owe capital-gains tax (a 1031 exchange can defer both). Figures are a year-1 estimate at your 24.0% rate — not tax advice; consult a CPA.
Schools (NCES district)
- District
- Maury County
- NCES district ID
- 4702760
- Math proficiency
- 19% ▼ -5.00%
- Reading proficiency
- 21% ▼ -4.00%
- Median HH income
- $47,668
- Composite
- 17.69/100
- National rank
- #9024
- State rank
- #108 of 139 in TN
Livability — Columbia
- Score
- 63/100
- State rank
- #207
- US rank
- #16090
Category grades
Schools grade is shown separately in the Schools card above.
Census & demographics
- Census place
- Columbia, TN
- County
- Maury County · 121,382 people
- City population
- 67,482
- Metro
- Nashville-Davidson--Murfreesboro--Franklin, TN
- Population (ZIP)
- 67,482
- Household income
- $68,475
- Rent vs Own
- Severe rent burden
- 2026.0
Population outlook (Maury County) Hauer SSP2
- Today (2025)
- 102,894 people
- By 2030
- 110,269 · +7.2%
- By 2040
- 124,426 · +20.9%
- By 2050
- 137,543 · +33.7%
- By 2075
- 167,438 · +62.7%
- By 2100
- 184,489 · +79.3%
Race, ethnicity, and origin ACS 2023
- Neighborhood character
- Predominantly White (74%)
- Race & ethnicity
- White 74% Black 12% Hispanic / Latino 9% Two or more races 7%
- Hispanic origin (detail)
- Mexican 7%
- Common ancestry
- Slovak 1% Serbian 1% Romanian 1%
- Foreign-born
- 4% · Canada
- Languages at home
- 94% English-only · Spanish 5%
Political lean MEDSL · Maury
- 2024 margin
- Solid R (+44.6) · D 27.1% · R 71.8% · Other 1.1%
- 2008→2024 swing
- -6.2pp toward R · 2008: -38.4pp · 2024: -44.6pp
- All cycles
- 2024: R+44.6 2020: R+36.5 2016: R+39.2 2012: R+26.9 2008: R+38.4
Not yet ingested
- Civics
- —
Market trends
- HPI YoY
- ▼ -100.75%
- Current HPI
- 343.0362
- Rent YoY
- ▲ 4.97%
- Metro
- Nashville-Davidson--Murfreesboro--Franklin, TN
- State GDP YoY
- ▲ 2.78%
- F500 in state
- 22
Industry mix (Fortune 500 HQ in TN)
| Industry | F500 HQs | Revenue |
|---|---|---|
| Healthcare | 3 | $91B |
|
||
| Retail | 3 | $72B |
|
||
| Transportation / Logistics | 1 | $88B |
|
||
| Paper / Packaging | 1 | $19B |
|
||
| Insurance | 1 | $13B |
|
||
| Energy | 1 | $12B |
|
||
Price history
1 event — show timeline
- 2026-05-26 Listed $139,000 REALTRACS as Distributed by MLS Grid
Property tax history
+6.8%/yrLatest (2025): $776 · +0.0% YoY. Source: county tax records.
Cash-flow waterfall
monthlySold comps — $/sqft
last 12 mo · ≤1 miLoading sold comps…