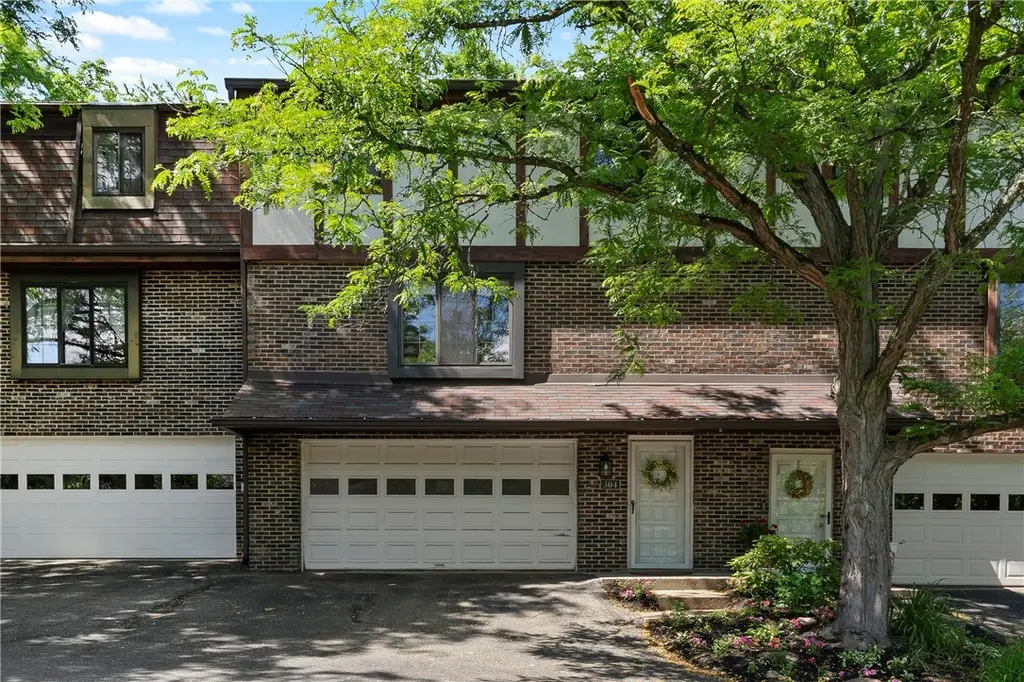
304 Cottingham Ct · McCandless, PA
Flood risk 1/10 · Minimal
- FEMA flood zone
- X (unshaded)
- Chance of flooding over 30 yrs
- 0.0%
- Est. flood insurance / yr
- $473 – $860
Fire risk 1/10 · Minimal
- Est. fire insurance / yr
- $511 – $949
Heat risk 3/10 · Minor
- Hot days now (above 97°F)
- 7 days/yr
- Hot days in 30 yrs
- 17 days/yr
Wind risk 2/10 · Minimal
- Chance of severe wind over 30 yrs
- —
Air-quality risk 4/10 · Minor
- Unhealthy air days now
- 3 days/yr
- Unhealthy air days in 30 yrs
- 6 days/yr
Risk factors via First Street. Map © Google.
Why this score? — see what drove the D- grade
The composite is a weighted blend of 9 inputs, each scored 0–100. Each bar is that input's sub-score; the figure is the points it added to the 100-point composite (weight × sub-score).
- Cash flow +10.3/30.0
- ARV discount +7.5/15.0
- Schools +6.6/10.0
- 1% rule +4.2/10.0
- DSCR +2.9/10.0
- Rent growth +2.5/5.0
- Livability +2.5/5.0
- Condition / age +2.5/5.0
- Appreciation +0.0/10.0
$289,000
🖨 Deal sheet 📄 Offer letter ✓ Due diligence
Listing remarks
Beautifully maintained spacious 3 bedroom townhome with 2 full baths and 2 half baths is ready for you to move in and unpack. New carpet and painting. Close to North Park, Passavant Hospital, shoping and restaurants. This home features a two-car integral garage, generous storage spaces, abundant light filled rooms, and a living room with fireplace. Three bedrooms and two full baths on the upper floor. Very close to the recreational benefits of North Park, offering kayaking, paddleboarding, walking/running paths, mountain biking trails, access to the lake, and year-round sports activities. Centrally located with convenient access to major routes into the city. Welcome home.
Key facts
- New carpet
- $355 HOA
- Garage
Tags
Property features AI
Finance
- HOA & community: Monthly association fee of $355
Exterior
- Parking: Attached 2-car garage; Built-in parking; Garage door opener
- Utilities: Public water; Public sewer
- Home design: 2-story home
- Construction: Brick and stucco construction; Asphalt roof
- Exterior features: Lot dimensions approximately 26 x 46; Resale condition
Interior
- Kitchen: Dishwasher; Disposal; Microwave; Refrigerator; Stove; Some gas appliances
- Bedrooms: Upper-level bedrooms (includes Bedroom 2 and Bedroom 3); Additional bedroom-sized space of 19x13 on upper level
- Flooring: Tile; Carpet
- Bathrooms: 2 full bathrooms; 2 half bathrooms
- Heating & cooling: Gas heating; Central air conditioning
- Interior features: Pantry; Screens on windows
- Laundry & utility: Washer; Dryer
Neighborhood map
What this means for you Summary
Snapshot
- This is a 3-bed/2.5-bath condo listed at $289k.
Deal economics
- At list price, monthly cash flow is $-160 ($-2k/yr) — negative.
- To cash-flow at today's rent, offer at most $261k (9.8% below list).
- To meet the 1% rule (rent ≥ 1% of price), the offer needs to be $266k (7.9% below list).
- Recommended offer: $261k (9.8% below list) — sets the bar for cash-flow.
Location & tenants
- Location reads: area grade D — affects rentability + tenant quality, not the cash-flow math above.
- North Allegheny SD (suburban): math 64% / reading 82% proficiency, ranked #14 of 539 in PA (top 3%) — strong family-tenant draw, lease renewals of 3-5y typical; only 4% free/reduced lunch — higher-income household profile.
- Market conditions: 68 active listings in the ZIP; 7 comparable units currently listed for rent nearby; rentals leasing fast (median 3d on market — plan ~1-2 weeks tenant-placement turnaround); high-income renter base; 2,996 units permitted in Allegheny County in 2024 (1,588 in 5+ unit buildings).
Forward outlook
- Local home prices are declining (-3.0%/yr); year-one equity from $2k of loan paydown is wiped out by about $9k of value loss. Plan a longer hold.
Negotiation context
- Only 14 days on market — expect competitive offers; lowballing is unlikely to land.
- Current owner paid $142k; list at $289k implies a 104% gain — meaningful room to come down on a strong offer.
Questions for the listing agent
- What do current leases actually rent for vs. the listed asking? Can we see a recent rent roll and the last 12 months of T-12 income?
- What does the HOA fee cover, when was the last increase, and are there any pending special assessments or reserve-fund shortfalls?
- Any open or pending special assessments — roof, HVAC, plumbing, elevator, façade? What's the per-unit balance and payoff schedule, and is the seller paying it off at close or rolling it to the buyer?
- Is there a deadline driving the sale (1031 exchange, divorce, estate, relocation)? That informs how much negotiation room exists.
- The area grade is low — what's the realistic commute time and amenity access for the typical tenant pool here? Any planned neighborhood developments (good or bad) we should know about?
- What's the average days-on-market for RENTAL listings here right now (not sales)? A rising rental-DOM trend means longer vacancies and softer asking-rent achievability than the comps imply.
- What's the recent tenant-quality profile in this submarket — average credit score on applications, eviction rate, late-payment / NSF rate, and stable-employment percentage? A property-management company in the area should have these aggregated.
- How much new apartment / multifamily construction is in the pipeline within 1–3 miles? Heavy new supply (>2% of stock underway) typically softens rents 12–24 months out; light construction supports rent growth.
Investment metrics
- 1% rule
- 0.92% ✗
- Cap rate
- 5.63%
- Cash-on-cash
- -2.37%
- DSCR
- 0.89
- GRM
- 9.1
CMA / ARV
No comps found within radius.
Projected returns pro-forma
-3.0% appreciation · 3.0% rent growth · sell at horizon
- IRR
- -20.1%
- Equity multiple
- 0.30×
- Total profit
- $-56,805
- Equity at exit
- $43,091
- IRR
- -13.0%
- Equity multiple
- 0.24×
- Total profit
- $-61,746
- Equity at exit
- $24,987
Cash invested: $80,920 (down + closing). Projections, not guarantees.
Landlord ↔ Tenant lean methodology
- Overall (STATE)
- 62 Landlord-Friendly
- State Pennsylvania
- 62 Landlord-Friendly · EVEN
- County
- — inherits STATE
- City
- — inherits STATE
ZIP-level market 15101
- Active inventory
- 68
- Price-to-rent
- 9.1×
Monthly cashflow live
- Estimated rent
- $2,661 high interval (Pro) →
- Mortgage (P&I)
- −$1,516
- Tax from tax record
- −$271 /mo · $3,248/yr
- Insurance
- −$120
- HOA
- −$355
- Vacancy / Maint / Mgmt
- −$559
- Net cashflow
- $-160
Break-even live
UW: 25.0% down · 7.5% · 30yr · 1.5% tax · 5.0% vac · 8.0% maint · 8.0% mgmt
Financing live
Cash to close
- Down payment
- $72,250
- Closing costs
- $8,670
- Reserves months
- —
- Total cash needed
- —
Loan-product check · same deal, 3 products live
Conventional
25% down · 7.5% · 30yr
- Down + closing
- —
- Monthly P&I
- —
- Monthly cashflow
- —
- DSCR
- —
- Eligible?
- —
Personal DTI + credit; lowest rate.
DSCR
20% down · 8.5% · 30yr
- Down + closing
- —
- Monthly P&I
- —
- Monthly cashflow
- —
- DSCR
- —
- Eligible?
- —
No personal income docs; deal must DSCR.
Hard money
10% down · 12.0% · 12mo
- Down + closing
- —
- Monthly P&I
- —
- Monthly cashflow
- —
- DSCR
- —
- Eligible?
- —
Short-term bridge; refi at stabilization.
Rent comps 7 comps
| Address | Beds | Baths | Sqft | Rent | $/sqft | DOM | Units | Dist |
|---|---|---|---|---|---|---|---|---|
| 9720 Hopkins St Unit NA Wexford, PA | 4.0 | 3.5 | 2271 | $3,099 | $1.36 | 1d | 1 | 1.06mi |
| 9720 Hopkins St Wexford, PA | 4.0 | 3.5 | 2271 | $3,099 | $1.36 | 2d | 1 | 1.06mi |
| 415 Harmon Ct Wexford, PA | 4.0 | 3.5 | 2271 | $3,200 | $1.41 | 11d | 1 | 1.06mi |
| 531 Cooper St Unit 1 Wexford, PA | 3.0 | 3.5 | 1760 | $3,100 | $1.76 | 4d | 1 | 1.06mi |
| 524 Cooper St Wexford, PA | 3.0 | 3.5 | 1800 | $3,195 | $1.77 | 1d | 1 | 1.07mi |
| 520 Cooper St Wexford, PA | 3.0 | 3.5 | 1800 | $3,295 | $1.83 | 14d | 1 | 1.08mi |
| 100 Arthur Dr Wexford, PA | 1.0–3.0 | 1.0–2.5 | 1250 | $2,185 | $1.75 | 1d | 1 | 1.38mi |
HOA detail condo
- Monthly dues
- $355 · $4,260/yr
- Assessments
- None detected in remarks — confirm with the listing agent.
Listing history 11 events
-
2026-06-18days on market $289,000 Active 14 DOM
-
2026-06-17days on market $289,000 Active 13 DOM
-
2026-06-16days on market $289,000 Active 12 DOM
-
2026-06-15days on market $289,000 Active 11 DOM
-
2026-06-13days on market $289,000 Active 9 DOM
-
2026-06-13days on market $289,000 Active 8 DOM
-
2026-06-09days on market $289,000 Active 5 DOM
-
2026-06-08days on market $289,000 Active 4 DOM
-
2026-06-07days on market $289,000 Active 3 DOM
-
2026-06-05remarks 681-char remark
-
2026-06-05$289,000 Active 1 DOM
ⓘ Source: listings_history table (triggers on properties + properties_extension) + one-shot
backfill from property_details.listing_events for pre-trigger history.
Tax reassessment forecast PA · Partial reset (capped growth)
- Current annual tax
- $3,248 · $271/mo
- Projected year-2 tax
- $3,907 · $326/mo
- Expected delta
- +$659/yr (+$55/mo · 20.3%)
ⓘ Screening estimate from a state-policy table — verify with the county assessor before closing.
Climate risk First Street
- Flood 1/10 Low FEMA zone X (unshaded) · 0% chance over 30 yrs
- Wildfire 1/10 Low
- Heat 3/10 Moderate 7 d/yr ≥97°F today · 17 d/yr by 30 yrs out
- Wind 2/10 Low
- Air quality 4/10 Moderate 3 unhealthy d/yr today · 6 by 30 yrs out
Nearby sold comps map
Loading sold comps map…
Walkable amenities ~0.75 mi
Loading nearby amenities…
Taxation est. · year 1
- Rental income
- $31,926
- − Mortgage interest
- −$16,188
- − Property taxes
- −$3,248
- − Insurance
- −$1,445
- − Repairs & maintenance
- −$2,554
- − Management
- −$2,554
- − HOA
- −$4,260
- − Depreciation
- −$8,407
- Taxable loss
- −$6,730
- Est. tax savings @ 24.0%
- +$1,615
- After-tax cash flow
- $-302/yr
For passive investors: Depreciation is non-cash, so a rental often shows a tax loss while cash-flowing — sheltering income. Rental losses are passive: they offset passive income freely, and up to $25,000/yr can offset ordinary (W-2) income if you actively participate and your MAGI is under $100k (phasing out to $0 by $150k); unused losses carry forward. On sale, claimed depreciation is recaptured at up to 25%, and gains may owe capital-gains tax (a 1031 exchange can defer both). Figures are a year-1 estimate at your 24.0% rate — not tax advice; consult a CPA.
Schools (NCES district)
- District
- North Allegheny SD
- NCES district ID
- 4217010
- Math proficiency
- 64% ▼ -7.00%
- Reading proficiency
- 82% ▼ -4.00%
- Median HH income
- $92,518
- Composite
- 65.85/100
- National rank
- #452
- State rank
- #14 of 539 in PA
Livability — McCandless
No livability data for this city. (Only ~50 U.S. cities are tracked.)
Census & demographics
- Census place
- Allison Park, PA
- County
- Allegheny County · 1,022,028 people
- Metro
- Pittsburgh, PA
- Population (ZIP)
- 26,036
- Household income
- $114,634
- Rent vs Own
- Severe rent burden
- 429.0
Population outlook (Allegheny County) Hauer SSP2
- Today (2025)
- 1,250,282 people
- By 2030
- 1,256,482 · +0.5%
- By 2040
- 1,256,318 · +0.5%
- By 2050
- 1,244,169 · -0.5%
- By 2075
- 1,197,693 · -4.2%
- By 2100
- 1,093,187 · -12.6%
Race, ethnicity, and origin ACS 2023
- Neighborhood character
- Predominantly White (91%)
- Race & ethnicity
- White 91% Two or more races 4% Hispanic / Latino 3% Asian 2% Black 1%
- Common ancestry
- Romanian 8% Slovak 3% Serbian 1%
- Foreign-born
- 6% · China, Canada
- Languages at home
- 93% English-only · Spanish 2% Other Indo-European 2% Chinese 1%
Political lean MEDSL · Allegheny
- 2024 margin
- Strong D (+20.3) · D 59.7% · R 39.4%
- 2008→2024 swing
- +4.8pp toward D · 2008: 15.5pp · 2024: 20.3pp
- All cycles
- 2024: D+20.3 2020: D+20.4 2016: D+16.4 2012: D+14.4 2008: D+15.5
Not yet ingested
- Civics
- —
Market trends
- HPI YoY
- ▼ -180.82%
- Current HPI
- 273.4553
- Rent YoY
- —
- Metro
- Pittsburgh, PA
- State GDP YoY
- ▲ 1.68%
- F500 in state
- 34
Industry mix (Fortune 500 HQ in PA)
| Industry | F500 HQs | Revenue |
|---|---|---|
| Healthcare | 2 | $309B |
|
||
| Insurance | 2 | $27B |
|
||
| Telecommunications / Media | 1 | $124B |
|
||
| Industrial Distribution | 1 | $22B |
|
||
| Financial Services | 1 | $20B |
|
||
| Chemicals / Materials | 1 | $18B |
|
||
Price history
+209.1% since first listed4 events — show timeline
- 2026-06-04 Listed $289,000 West Penn MLS
- 2010-11-23 Sold (Public Records) $142,000 Public Records
- 1992-11-04 Sold (Public Records) $104,000 Public Records
- 1989-12-26 Sold (Public Records) $93,500 Public Records
Property tax history
+1.4%/yrLatest (2026): $3,248 · +0.0% YoY. Source: county tax records.
Cash-flow waterfall
monthlySold comps — $/sqft
last 12 mo · ≤1 miLoading sold comps…