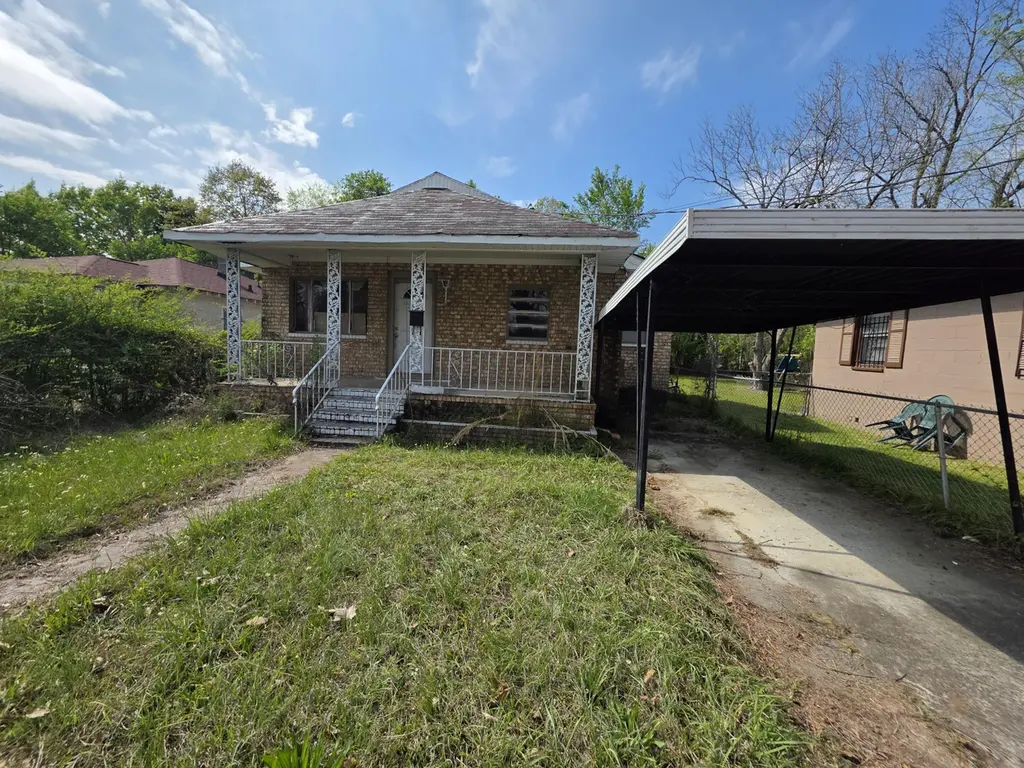
1589 Holley St · Augusta-Richmond County consolidated government (balance), GA
Flood risk 1/10 · Minimal
- FEMA flood zone
- X (unshaded)
- Chance of flooding over 30 yrs
- 0.0%
- Est. flood insurance / yr
- $507 – $1,088
Fire risk 3/10 · Minor
- Est. fire insurance / yr
- $963 – $1,789
Heat risk 8/10 · Major
- Hot days now (above 108°F)
- 7 days/yr
- Hot days in 30 yrs
- 17 days/yr
Wind risk 6/10 · Moderate
- Chance of severe wind over 30 yrs
- 66.0%
Air-quality risk 4/10 · Minor
- Unhealthy air days now
- 4 days/yr
- Unhealthy air days in 30 yrs
- 4 days/yr
Risk factors via First Street. Map © Google.
Why this score? — see what drove the B+ grade
The composite is a weighted blend of 9 inputs, each scored 0–100. Each bar is that input's sub-score; the figure is the points it added to the 100-point composite (weight × sub-score).
- Cash flow +30.0/30.0
- 1% rule +10.0/10.0
- DSCR +10.0/10.0
- Appreciation +9.1/10.0
- ARV discount +7.5/15.0
- Livability +2.5/5.0
- Condition / age +2.5/5.0
- Rent growth +2.2/5.0
- Schools +1.3/10.0
$49,999
🖨 Deal sheet 📄 Offer letter ✓ Due diligence
Listing remarks
Great Investment Opportunity! This home offers 4 bedrooms and 2 bathrooms with plenty of living space. This home is ready for a savvy investor to give this home some TLC.
Key facts
- 4,792 sq ft lot
- Garage
- Built 1951
Neighborhood map
What this means for you Summary
Snapshot
- This is a 3-bed/1.0-bath single-family listed at $50k.
Deal economics
- At list price, monthly cash flow is $921 ($11k/yr) — positive.
- The deal already cash-flows at list — no discount required.
- Meets the 1% rule at list price ($2k rent vs $50k).
- Cap rate 28.4% vs local median 5.3% in Augusta-Richmond County consolidated government (balance) — top-decile yield for the area; either an underpriced asset or a hidden risk that comps aren't pricing in. Stress-test before assuming the spread holds.
Location & tenants
- Location reads: area grade B — affects rentability + tenant quality, not the cash-flow math above.
- Richmond County (urban): math 12% / reading 20% proficiency, ranked #154 of 174 in GA (top 88%) — low school quality limits family demand, transient renter base, plan for 1-2y turnover; 72% free/reduced lunch — lower-income household profile, screen leases tightly.
- Zoned schools: Jenkins-White Elementary School (math 8% / reading 8%, grade F, #1,125 of 1,228 statewide, top 93%, 389 students, 98% FRL); W.S. Hornsby Middle School (math 2% / reading 5%, grade F, #468 of 470 statewide, top 100%, 399 students, 98% FRL) — zoned schools average 98% FRL vs 72% district-wide (26 pts higher); higher-poverty schools than district average — tighter screening recommended.
- Market conditions: Rents soft (-1.3%/yr); 129 active listings in the ZIP; 21 comparable units currently listed for rent nearby; rentals at typical pace (median 24d on market — plan ~3-4 weeks tenant-placement turnaround); 48% of comp listings sitting > 30 days — soft ceiling on asking rent; lower-income renter base — watch delinquency; 561 units permitted in Richmond County in 2024 (0 in 5+ unit buildings).
- At $1,643/mo this rent would consume 78% of the median local household income ($25k/yr) (locally 2063% of renters already pay >50% of income on rent) — very limited rent-growth headroom before tenants either downsize or default.
Forward outlook
- In year one you build about $4k of equity ($345 loan paydown + $4k appreciation (8.2% local appreciation)).
- Richmond County population projected to shrink 5% by 2050 — rents likely to lag national; underwrite the cash flow, not the appreciation.
- At projected returns (8.2% appreciation + 0.0% rent growth), your $14k cash investment doubles in ~1 year — after that, you're playing with house money.
- By year 7, paydown + projected appreciation supports a ~$31k cash-out refi (75% LTV) — recoverable capital for the next deal without selling this one.
Negotiation context
- Only 7 days on market — expect competitive offers; lowballing is unlikely to land.
- 2 sale attempts with the ask held roughly flat each time — persistent listings suggest the price (not the market) is what's stuck; bring a comps-based counter.
Risks & watch-outs
- Watch-outs: built in 1951 — expect roof / HVAC / electrical / plumbing capex.
- Climate carrying-cost: major wind risk, 66% chance of damaging wind over 30y; extreme-heat days projected 7→17/yr by 2055 (HVAC capex compounding) — expect insurance premiums to compound above CPI over the hold.
Questions for the listing agent
- Built in 1951 — when were the roof, HVAC, electrical panel, plumbing, and water heater last replaced?
- Is there a deadline driving the sale (1031 exchange, divorce, estate, relocation)? That informs how much negotiation room exists.
- What's the average days-on-market for RENTAL listings here right now (not sales)? A rising rental-DOM trend means longer vacancies and softer asking-rent achievability than the comps imply.
- What's the recent tenant-quality profile in this submarket — average credit score on applications, eviction rate, late-payment / NSF rate, and stable-employment percentage? A property-management company in the area should have these aggregated.
- How much new for-sale + rental construction is in the pipeline within 1–3 miles? Heavy new supply typically softens prices + rents 12–24 months out; constrained supply supports both.
Investment metrics
- 1% rule
- 3.29% ✓
- Cap rate
- 28.40%
- Cash-on-cash
- 78.94%
- DSCR
- 4.51
- GRM
- 2.5
CMA / ARV
- ARV (median comp)
- $100,500
- List price
- $49,999
- Delta
- -50.25%
- Verdict
- UNDERPRICED
- Comps
- 20 within 1.0 mi
Show comp detail 12 sales within ~0.75 mi
| Address | Dist | Beds/Ba | Sqft | Sold | Price | $/sf | Match |
|---|---|---|---|---|---|---|---|
| 1589 Holley St | 0.00mi | 4/2.0 (+1) | 1,592 (0%) | 1mo | $44,000 | $28 | 90 |
| 1341 Swanee Quintet Blvd | 0.15mi | 4/1.0 (+1) | 1,604 (+1%) | 20mo | $30,000 | $19 | 70 |
| 2018 Steiner Ave | 0.29mi | 3/2.0 | 1,517 (-5%) | 14mo | $140,000 | $92 | 63 |
| 2023 Martin Luther King Jr Blvd | 0.44mi | 3/1.0 | 1,483 (-7%) | 6mo | $60,000 | $40 | 63 |
| 1021 Turpin St | 0.59mi | 3/1.5 | 1,574 (-1%) | 9mo | $46,500 | $30 | 61 |
| 1004 Kent St | 0.60mi | 4/2.5 (+1) | 1,640 (+3%) | 2mo | $212,200 | $129 | 54 |
| 1434 Mill St | 0.43mi | 3/2.0 | 1,468 (-8%) | 13mo | $40,000 | $27 | 53 |
| 1021 7th Ave | 0.63mi | 4/1.5 (+1) | 1,697 (+7%) | 4mo | $159,000 | $94 | 49 |
| 1679 Luckey St | 0.37mi | 3/2.0 | 1,400 (-12%) | 16mo | $38,000 | $27 | 46 |
| 1852 Old Savannah Rd | 0.67mi | 2/2.0 (-1) | 1,488 (-6%) | 8mo | $10,100 | $7 | 42 |
| 1332 Laurel St | 0.63mi | 3/2.0 | 1,356 (-15%) | 9mo | $205,000 | $151 | 35 |
| 1304 12th St | 0.72mi | 3/2.0 | 1,422 (-11%) | 20mo | $20,000 | $14 | 28 |
Match score weights: distance 35% · size 25% · config 20% · recency 20%. Top-matched comps best support the ARV.
Projected returns pro-forma
8.18% appreciation · 0.0% rent growth · sell at horizon
- IRR
- 84.7%
- Equity multiple
- 6.36×
- Total profit
- $75,062
- Equity at exit
- $38,600
- IRR
- 79.6%
- Equity multiple
- 12.82×
- Total profit
- $165,490
- Equity at exit
- $77,215
Cash invested: $14,000 (down + closing). Projections, not guarantees.
Landlord ↔ Tenant lean methodology
- Overall (STATE)
- 90 Strongly Landlord-Friendly
- State Georgia
- 90 Strongly Landlord-Friendly · R+3
- County
- — inherits STATE
- City
- — inherits STATE
ZIP-level market 30901
- Home prices YoY
- 4.1%
- Rents YoY
- -1.3%
- Active inventory
- 129
- Price-to-rent
- 2.5×
Monthly cashflow live
- Estimated rent
- $1,643 high interval (Pro) →
- Mortgage (P&I)
- −$262
- Tax from tax record
- −$94 /mo · $1,129/yr
- Insurance
- −$21
- HOA
- −$0
- Vacancy / Maint / Mgmt
- −$345
- Net cashflow
- $921
Break-even live
UW: 25.0% down · 7.5% · 30yr · 1.5% tax · 5.0% vac · 8.0% maint · 8.0% mgmt
Financing live
Cash to close
- Down payment
- $12,500
- Closing costs
- $1,500
- Reserves months
- —
- Total cash needed
- —
Loan-product check · same deal, 3 products live
Conventional
25% down · 7.5% · 30yr
- Down + closing
- —
- Monthly P&I
- —
- Monthly cashflow
- —
- DSCR
- —
- Eligible?
- —
Personal DTI + credit; lowest rate.
DSCR
20% down · 8.5% · 30yr
- Down + closing
- —
- Monthly P&I
- —
- Monthly cashflow
- —
- DSCR
- —
- Eligible?
- —
No personal income docs; deal must DSCR.
Hard money
10% down · 12.0% · 12mo
- Down + closing
- —
- Monthly P&I
- —
- Monthly cashflow
- —
- DSCR
- —
- Eligible?
- —
Short-term bridge; refi at stabilization.
Rent comps 21 comps
| Address | Beds | Baths | Sqft | Rent | $/sqft | DOM | Units | Dist |
|---|---|---|---|---|---|---|---|---|
| 1480 Wrightsboro Rd Augusta, GA | 1.0–3.0 | 1.0–2.0 | 1046 | $2,375 | $2.27 | 21d | 13 | 0.42mi |
| 1712 Morgan St Augusta, GA | 3.0 | 1.0 | 1209 | $1,330 | $1.10 | 23d | 1 | 0.59mi |
| 1812 Slaton St Augusta, GA | 2.0 | 2.0 | 1615 | $1,665 | $1.03 | 23d | 10 | 0.71mi |
| 26 Sherman St Augusta, GA | 3.0 | 2.0 | 1720 | $1,900 | $1.10 | 43d | 1 | 0.72mi |
| 2128 Grand Blvd Augusta, GA | 3.0 | 1.0 | 1150 | $1,150 | $1.00 | 43d | 1 | 0.74mi |
| 1315 Merry St Augusta, GA | 3.0 | 2.0 | 1610 | $1,450 | $0.90 | 23d | 1 | 0.85mi |
| 1804 Central Ave Augusta, GA | 2.0 | 1.0 | 1200 | $1,100 | $0.92 | 23d | 1 | 0.91mi |
| 1812 Central Ave Unit 1 Augusta, GA | 3.0 | 1.5 | 1528 | $2,600 | $1.70 | 43d | 1 | 0.94mi |
| 1812 Central Ave Augusta, GA | 3.0 | 1.5 | 1568 | $2,200 | $1.40 | 23d | 1 | 0.94mi |
| 1812 Central Ave Augusta, GA | 3.0 | 1.5 | 1568 | $2,200 | $1.40 | 43d | 1 | 0.94mi |
| 1861 Central Ave Unit A Augusta, GA | 2.0 | 2.5 | 1611 | $1,750 | $1.09 | 23d | 1 | 1.03mi |
| 1861 Central Ave Unit A Augusta, GA | 2.0 | 2.5 | 1611 | $1,750 | $1.09 | 43d | 1 | 1.03mi |
| 1105 Merry St Augusta, GA | 3.0 | 1.0 | 1281 | $1,350 | $1.05 | 23d | 1 | 1.09mi |
| 1508 Heard Ave Augusta, GA | 3.0 | 2.0 | 1314 | $1,400 | $1.07 | 43d | 1 | 1.17mi |
| 2031 Wrightsboro Rd Augusta, GA | 2.0 | 2.0 | 1240 | $1,750 | $1.41 | 43d | 1 | 1.20mi |
| 1432 Heard Ave Augusta, GA | 3.0 | 2.0 | 1278 | $1,500 | $1.17 | 43d | 1 | 1.24mi |
| 1914 1/2 Kratha Dr Augusta, GA | 2.0 | 1.0 | 1400 | $995 | $0.71 | 13d | 1 | 1.34mi |
| 2139 Holt St Augusta, GA | 3.0 | 2.0 | 1611 | $1,550 | $0.96 | 43d | 1 | 1.40mi |
| 2139 Holt St Augusta, GA | 3.0 | 2.0 | 1611 | $1,475 | $0.92 | 23d | 1 | 1.40mi |
| 1509 Troupe St Augusta, GA | 3.0 | 2.0 | 1200 | $1,695 | $1.41 | 13d | 1 | 1.45mi |
| 1742 Walker St Augusta, GA | 3.0 | 2.0 | 1384 | $1,600 | $1.16 | 44d | 1 | 1.47mi |
Listing history 4 events
-
2026-05-18status Pending 171-char remark
-
2026-05-11historical
-
2026-03-26$49,999 Active 171-char remark
-
2026-03-26$49,999 Active
ⓘ Source: listings_history table (triggers on properties + properties_extension) + one-shot
backfill from property_details.listing_events for pre-trigger history.
Tax reassessment forecast GA · Resets to sale price
- Current annual tax
- $1,129 · $94/mo
- Projected year-2 tax
- $1,129 · $94/mo
- Expected delta
- $0/yr ($0/mo · 0.0%)
ⓘ Screening estimate from a state-policy table — verify with the county assessor before closing.
Climate risk First Street
- Flood 1/10 Low FEMA zone X (unshaded) · 0% chance over 30 yrs
- Wildfire 3/10 Moderate
- Heat 8/10 Severe 7 d/yr ≥108°F today · 17 d/yr by 30 yrs out
- Wind 6/10 Major 66% chance of damaging wind over 30 yrs
- Air quality 4/10 Moderate 4 unhealthy d/yr today · 4 by 30 yrs out
Nearby sold comps map
Loading sold comps map…
Walkable amenities ~0.75 mi
Loading nearby amenities…
Taxation est. · year 1
- Rental income
- $19,718
- − Mortgage interest
- −$2,801
- − Property taxes
- −$1,129
- − Insurance
- −$250
- − Repairs & maintenance
- −$1,577
- − Management
- −$1,577
- − Depreciation
- −$1,455
- Taxable income
- $10,929
- Est. tax owed @ 24.0%
- −$2,623
- After-tax cash flow
- $8,429/yr
For passive investors: Depreciation is non-cash, so a rental often shows a tax loss while cash-flowing — sheltering income. Rental losses are passive: they offset passive income freely, and up to $25,000/yr can offset ordinary (W-2) income if you actively participate and your MAGI is under $100k (phasing out to $0 by $150k); unused losses carry forward. On sale, claimed depreciation is recaptured at up to 25%, and gains may owe capital-gains tax (a 1031 exchange can defer both). Figures are a year-1 estimate at your 24.0% rate — not tax advice; consult a CPA.
Schools (NCES district)
- District
- Richmond County
- NCES district ID
- 1304380
- Math proficiency
- 12% ▼ -9.00%
- Reading proficiency
- 20% ▼ -6.00%
- Median HH income
- $38,069
- Composite
- 13.43/100
- National rank
- #9524
- State rank
- #154 of 174 in GA
Livability — Augusta-Richmond County consolidated government (balance)
No livability data for this city. (Only ~50 U.S. cities are tracked.)
Census & demographics
- Census place
- Augusta-Richmond County consolidated government (balance), GA
- County
- Richmond County · 190,917 people
- City population
- 154,035
- Metro
- Augusta-Richmond County, GA-SC
- Population (ZIP)
- 16,484
- Household income
- $25,163
- Rent vs Own
- Severe rent burden
- 2063.0
Population outlook (Richmond County) Hauer SSP2
- Today (2025)
- 200,753 people
- By 2030
- 200,232 · -0.3%
- By 2040
- 196,813 · -2.0%
- By 2050
- 190,347 · -5.2%
- By 2075
- 172,496 · -14.1%
- By 2100
- 146,284 · -27.1%
Race, ethnicity, and origin ACS 2023
- Neighborhood character
- Predominantly Black (78%)
- Race & ethnicity
- Black 78% White 15% Two or more races 4% Hispanic / Latino 2%
- Common ancestry
- Lithuanian 1% Slovak 1%
- Foreign-born
- 1% · Canada
- Languages at home
- 97% English-only · Spanish 1%
Political lean MEDSL · Richmond
- 2024 margin
- Solid D (+36.1) · D 67.8% · R 31.7%
- 2008→2024 swing
- +4.3pp toward D · 2008: 31.8pp · 2024: 36.1pp
- All cycles
- 2024: D+36.1 2020: D+37.2 2016: D+32.4 2012: D+33.8 2008: D+31.8
Not yet ingested
- Civics
- —
Market trends
- HPI YoY
- ▲ 8.18%
- Current HPI
- 206.3145
- Rent YoY
- ▼ -1.31%
- Metro
- Augusta-Richmond County, GA-SC
- State GDP YoY
- ▲ 2.66%
- F500 in state
- 28
Industry mix (Fortune 500 HQ in GA)
| Industry | F500 HQs | Revenue |
|---|---|---|
| Paper / Packaging | 2 | $29B |
|
||
| Retail | 1 | $160B |
|
||
| Transportation / Logistics | 1 | $91B |
|
||
| Airlines | 1 | $62B |
|
||
| Consumer Goods | 1 | $47B |
|
||
| Utilities | 1 | $25B |
|
||
Price history
-12.0% since first listed5 events — show timeline
- 2026-05-29 Sold (MLS) $44,000 Hive MLS
- 2026-05-18 Pending — Hive MLS
- 2026-05-11 Listing Removed — Hive MLS
- 2026-03-26 Listed $49,999 Hive MLS
- 2026-03-26 Listed $49,999 Hive MLS
Property tax history
+6.9%/yrLatest (2025): $1,129 · -3.9% YoY. Source: county tax records.
Cash-flow waterfall
monthlySold comps — $/sqft
last 12 mo · ≤1 miLoading sold comps…