 Multi-family
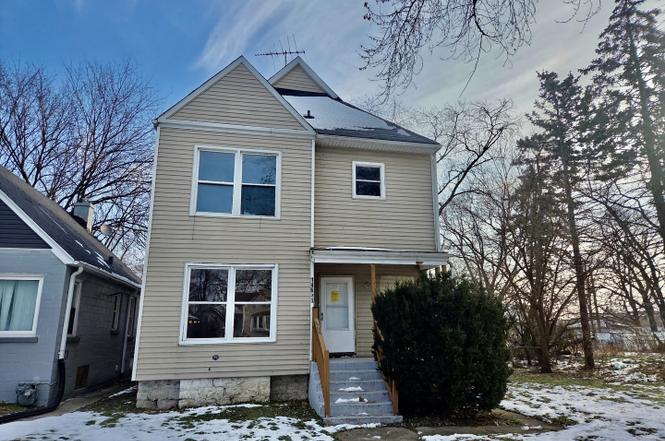
14631 Union Ave · Harvey, IL
Flood risk 1/10 · Minimal
- FEMA flood zone
- X (unshaded)
- Chance of flooding over 30 yrs
- 0.0%
- Est. flood insurance / yr
- $473 – $860
Fire risk 1/10 · Minimal
- Est. fire insurance / yr
- $804 – $1,492
Heat risk 3/10 · Minor
- Hot days now (above 101°F)
- 7 days/yr
- Hot days in 30 yrs
- 15 days/yr
Wind risk 2/10 · Minimal
- Chance of severe wind over 30 yrs
- —
Air-quality risk 4/10 · Minor
- Unhealthy air days now
- 4 days/yr
- Unhealthy air days in 30 yrs
- 5 days/yr
Risk factors via First Street. Map © Google.
Why this score? — see what drove the B+ grade
The composite is a weighted blend of 9 inputs, each scored 0–100. Each bar is that input's sub-score; the figure is the points it added to the 100-point composite (weight × sub-score).
- Cash flow +28.6/30.0
- 1% rule +10.0/10.0
- DSCR +10.0/10.0
- Appreciation +10.0/10.0
- ARV discount +7.5/15.0
- Livability +3.4/5.0
- Rent growth +2.5/5.0
- Condition / age +2.5/5.0
- Schools +0.7/10.0
$142,899
🖨 Deal sheet 📄 Offer letter ✓ Due diligence
Multi-family units
County records classify this as Multi-Family (2-4 Unit). Listing-text estimate: 1 unit. estimate disagrees with records
Listing remarks
Welcome to this beautifully renovated and spacious home featuring 6 bedrooms and 2 full bathrooms, offering comfort, flexibility, and room to grow. The home boasts generously sized bedrooms on every level, making it perfect for a variety of living arrangements. Enjoy the convenience of updated appliances and modern finishes throughout. This rare and unique property provides endless possibilities, including an unfinished basement ready for your creative vision-whether for entertainment, storage, or future living space. With its impressive size and thoughtful updates, this home offers the perfect opportunity to create the lifestyle you've been dreaming of. Don't miss the chance to make this e
Key facts
- Updated appliances
- Renovated home
- Unfinished basement
Tags
Property features AI
Finance
- HOA & community: No master association fees required
Exterior
- Utilities: Public water; Public sewer
- Home design: Detached single-family home; 2-story design; Fee simple ownership; Rehab completed in 2024; Built before 1978
- Construction: Vinyl siding
- Exterior features: Commuter bus and commuter train access
Interior
- Kitchen: Range; Refrigerator
- Bedrooms: 6 bedrooms (Master on main level; additional bedrooms on main, second and third levels)
- Bathrooms: 2 full bathrooms
- Heating & cooling: Forced air heating
- Interior features: Unfinished full basement; 10 total rooms
- Laundry & utility: Dedicated laundry room
Neighborhood map
What this means for you Summary
Snapshot
- This is a 4-bed/4.0-bath multifamily listed at $143k.
Deal economics
- At list price, monthly cash flow is $472 ($6k/yr) — positive.
- The deal already cash-flows at list — no discount required.
- Meets the 1% rule at list price ($2k rent vs $143k).
- Recommended offer: $130k (9.0% below list) — sets the bar for market timing.
Location & tenants
- Location reads 67/100 on livability (#539 in IL) — a middle-class / working-renter tenant base. Strengths: commute A+, cost of living A+, housing A-; Watch: health & safety D+, schools F, crime F.
- Thornton Twp Hsd 205 (suburban): math 7% / reading 8% proficiency, ranked #594 of 620 in IL (top 96%) — low school quality limits family demand, transient renter base, plan for 1-2y turnover.
- Market conditions: 134 active listings in the ZIP; 2 comparable units currently listed for rent nearby; 6,272 units permitted in Cook County in 2024 (4,658 in 5+ unit buildings).
Forward outlook
- In year one you build about $15k of equity ($988 loan paydown + $14k appreciation (10.0% local appreciation)).
- At projected returns (10.0% appreciation + 3.0% rent growth), your $40k cash investment doubles in ~2 years — after that, you're playing with house money.
- By year 3, paydown + projected appreciation supports a ~$39k cash-out refi (75% LTV) — recoverable capital for the next deal without selling this one.
Negotiation context
- It's been on market 103 days — a 9% lower offer ($130k) is reasonable based on typical stale-listing flexibility.
- 3 sale attempts since 2y ago with the ask held roughly flat each time — persistent listings suggest the price (not the market) is what's stuck; bring a comps-based counter.
- Current owner paid $55k; list at $143k implies a 160% gain — meaningful room to come down on a strong offer.
Risks & watch-outs
- Watch-outs: property tax is 4.3% of price; built in 1912 — expect roof / HVAC / electrical / plumbing capex.
Questions for the listing agent
- It's been on market 103 days. Have you received any prior offers? Is the seller open to a 9% concession, seller financing, or rate buy-down credit?
- Built in 1912 — when were the roof, HVAC, electrical panel, plumbing, and water heater last replaced?
- Property tax is high relative to price — has the assessment been appealed recently, and will the sale trigger a re-assessment?
- Why hasn't it sold? Are there any deal-killer items the seller is aware of (foundation, flood, title, zoning, code violations)?
- Is there a deadline driving the sale (1031 exchange, divorce, estate, relocation)? That informs how much negotiation room exists.
- Schools are F-rated, which usually means shorter tenancies and higher turnover. Who's the typical renter profile here, and what's been the actual vacancy rate?
- Crime grade is F in this area — have there been break-ins, vandalism, or insurance claims at this property in the last 3 years? What carrier currently insures it and at what premium?
- What's the average days-on-market for RENTAL listings here right now (not sales)? A rising rental-DOM trend means longer vacancies and softer asking-rent achievability than the comps imply.
- What's the recent tenant-quality profile in this submarket — average credit score on applications, eviction rate, late-payment / NSF rate, and stable-employment percentage? A property-management company in the area should have these aggregated.
- How much new apartment / multifamily construction is in the pipeline within 1–3 miles? Heavy new supply (>2% of stock underway) typically softens rents 12–24 months out; light construction supports rent growth.
Investment metrics
- 1% rule
- 1.59% ✓
- Cap rate
- 10.26%
- Cash-on-cash
- 14.16%
- DSCR
- 1.63
- GRM
- 5.2
CMA / ARV
No comps found within radius.
Projected returns pro-forma
10.0% appreciation · 3.0% rent growth · sell at horizon
- IRR
- 34.8%
- Equity multiple
- 3.70×
- Total profit
- $108,138
- Equity at exit
- $128,735
- IRR
- 30.0%
- Equity multiple
- 8.38×
- Total profit
- $295,285
- Equity at exit
- $277,621
Cash invested: $40,012 (down + closing). Projections, not guarantees.
Landlord ↔ Tenant lean methodology
- Overall (STATE)
- 43 Moderately Tenant-Leaning
- State Illinois
- 43 Moderately Tenant-Leaning · D+7
- County
- — inherits STATE
- City
- — inherits STATE
ZIP-level market 60426
- Home prices YoY
- 6.9%
- Active inventory
- 134
- Price-to-rent
- 5.2×
Monthly cashflow live
- Estimated rent
- $2,277 medium interval (Pro) →
- Mortgage (P&I)
- −$749
- Tax from tax record
- −$517 /mo · $6,209/yr
- Insurance
- −$60
- HOA
- −$0
- Vacancy / Maint / Mgmt
- −$478
- Net cashflow
- $472
Break-even live
UW: 25.0% down · 7.5% · 30yr · 1.5% tax · 5.0% vac · 8.0% maint · 8.0% mgmt
Financing live
Cash to close
- Down payment
- $35,725
- Closing costs
- $4,287
- Reserves months
- —
- Total cash needed
- —
Loan-product check · same deal, 3 products live
Conventional
25% down · 7.5% · 30yr
- Down + closing
- —
- Monthly P&I
- —
- Monthly cashflow
- —
- DSCR
- —
- Eligible?
- —
Personal DTI + credit; lowest rate.
DSCR
20% down · 8.5% · 30yr
- Down + closing
- —
- Monthly P&I
- —
- Monthly cashflow
- —
- DSCR
- —
- Eligible?
- —
No personal income docs; deal must DSCR.
Hard money
10% down · 12.0% · 12mo
- Down + closing
- —
- Monthly P&I
- —
- Monthly cashflow
- —
- DSCR
- —
- Eligible?
- —
Short-term bridge; refi at stabilization.
Rent comps 2 comps
| Address | Beds | Baths | Sqft | Rent | $/sqft | DOM | Units | Dist |
|---|---|---|---|---|---|---|---|---|
| 14844 Wabash Ave Dolton, IL | 3.0 | 1.5 | 1277 | $2,320 | $1.82 | 24d | 1 | 0.98mi |
| 19 E 140th Ct Riverdale, IL | 3.0 | 2.0 | 2076 | $2,231 | $1.07 | 7d | 1 | 1.49mi |
Listing history 28 events
-
2026-06-18days on market $142,899 Active 103 DOM
-
2026-06-17days on market $142,899 Active 102 DOM
-
2026-06-16days on market $142,899 Active 101 DOM
-
2026-06-15days on market $142,899 Active 100 DOM
-
2026-06-13days on market $142,899 Active 98 DOM
-
2026-06-13pricedays on market $142,899 Active 97 DOM
-
2026-06-09days on market $142,900 Active 94 DOM
-
2026-06-08days on market $142,900 Active 93 DOM
-
2026-06-07days on market $142,900 Active 92 DOM
-
2026-06-04days on market $142,900 Active 89 DOM
-
2026-06-03days on market $142,900 Active 88 DOM
-
2026-06-02days on market $142,900 Active 87 DOM
-
2026-06-01days on market $142,900 Active 86 DOM
-
2026-05-31days on market $142,900 Active 85 DOM
-
2026-05-15price $142,900
-
2026-04-02price $144,900
-
2026-03-07$149,900 Active
-
2024-10-07historical
-
2024-10-03price
-
2024-08-28Active
-
2024-08-26historical
-
2024-08-07price
-
2024-07-12Active
-
2022-06-09soldstatus $55,000
-
2010-12-21soldstatus $5,000
-
2006-01-19soldstatus $195,000
-
1990-09-13soldstatus $63,000
-
1984-03-05soldstatus $40,000
ⓘ Source: listings_history table (triggers on properties + properties_extension) + one-shot
backfill from property_details.listing_events for pre-trigger history.
Tax reassessment forecast IL · Partial reset (capped growth)
- Current annual tax
- $6,209 · $517/mo
- Projected year-2 tax
- $6,209 · $517/mo
- Expected delta
- $0/yr ($0/mo · 0.0%)
ⓘ Screening estimate from a state-policy table — verify with the county assessor before closing.
Climate risk First Street
- Flood 1/10 Low FEMA zone X (unshaded) · 0% chance over 30 yrs
- Wildfire 1/10 Low
- Heat 3/10 Moderate 7 d/yr ≥101°F today · 15 d/yr by 30 yrs out
- Wind 2/10 Low
- Air quality 4/10 Moderate 4 unhealthy d/yr today · 5 by 30 yrs out
Nearby sold comps map
Loading sold comps map…
Walkable amenities ~0.75 mi
Loading nearby amenities…
Taxation est. · year 1
- Rental income
- $27,319
- − Mortgage interest
- −$8,005
- − Property taxes
- −$6,209
- − Insurance
- −$714
- − Repairs & maintenance
- −$2,185
- − Management
- −$2,185
- − Depreciation
- −$4,157
- Taxable income
- $3,862
- Est. tax owed @ 24.0%
- −$927
- After-tax cash flow
- $4,738/yr
For passive investors: Depreciation is non-cash, so a rental often shows a tax loss while cash-flowing — sheltering income. Rental losses are passive: they offset passive income freely, and up to $25,000/yr can offset ordinary (W-2) income if you actively participate and your MAGI is under $100k (phasing out to $0 by $150k); unused losses carry forward. On sale, claimed depreciation is recaptured at up to 25%, and gains may owe capital-gains tax (a 1031 exchange can defer both). Figures are a year-1 estimate at your 24.0% rate — not tax advice; consult a CPA.
Schools (NCES district)
- District
- Thornton Twp Hsd 205
- NCES district ID
- 1738970
- Math proficiency
- 7% ▬ 0.00%
- Reading proficiency
- 8% ▼ -2.00%
- Median HH income
- $43,392
- Composite
- 6.92/100
- National rank
- #9976
- State rank
- #594 of 620 in IL
Livability — Harvey
- Score
- 67/100
- State rank
- #539
- US rank
- #11162
Category grades
Schools grade is shown separately in the Schools card above.
Census & demographics
- Census place
- Harvey, IL
- City population
- 23,066
- Population (ZIP)
- 23,066
Population outlook (Cook County) Hauer SSP2
- Today (2025)
- 5,347,519 people
- By 2030
- 5,357,703 · +0.2%
- By 2040
- 5,324,924 · -0.4%
- By 2050
- 5,230,762 · -2.2%
- By 2075
- 4,785,735 · -10.5%
- By 2100
- 4,188,836 · -21.7%
Race, ethnicity, and origin ACS 2023
- Neighborhood character
- Majority Black (59%)
- Race & ethnicity
- Black 59% Hispanic / Latino 33% Two or more races 12% White 3% Asian 2%
- Hispanic origin (detail)
- Mexican 31%
- Foreign-born
- 17% · Canada
- Languages at home
- 67% English-only · Spanish 30% Other Indo-European 2% French/Haitian/Cajun 1%
Political lean MEDSL · Cook
- 2024 margin
- Solid D (+42.0) · D 70.4% · R 28.4% · Other 1.2%
- 2008→2024 swing
- -11.4pp toward R · 2008: 53.4pp · 2024: 42.0pp
- All cycles
- 2024: D+42.0 2020: D+50.3 2016: D+53.0 2012: D+49.4 2008: D+53.4
Not yet ingested
- Civics
- —
Market trends
- HPI YoY
- ▲ 20.36%
- Current HPI
- 313.7895
- Rent YoY
- —
- Metro
- —
- State GDP YoY
- ▲ 1.59%
- F500 in state
- 60
Industry mix (Fortune 500 HQ in IL)
| Industry | F500 HQs | Revenue |
|---|---|---|
| Insurance | 4 | $201B |
|
||
| Consumer Goods | 4 | $87B |
|
||
| Industrial Machinery | 3 | $64B |
|
||
| Healthcare | 2 | $55B |
|
||
| Retail / Pharmacy | 1 | $148B |
|
||
| Agriculture / Food | 1 | $86B |
|
||
Price history
+257.2% since first listed14 events — show timeline
- 2026-05-15 Price Changed $142,900 MRED as Distributed by MLS Grid
- 2026-04-02 Price Changed $144,900 MRED as Distributed by MLS Grid
- 2026-03-07 Listed $149,900 MRED as Distributed by MLS Grid
- 2024-10-07 Listing Removed — MRED as Distributed by MLS Grid
- 2024-10-03 Price Changed — MRED as Distributed by MLS Grid
- 2024-08-28 Listed — MRED as Distributed by MLS Grid
- 2024-08-26 Listing Removed — MRED as Distributed by MLS Grid
- 2024-08-07 Price Changed — MRED as Distributed by MLS Grid
- 2024-07-12 Listed — MRED as Distributed by MLS Grid
- 2022-06-09 Sold (Public Records) $55,000 Public Records
- 2010-12-21 Sold (Public Records) $5,000 Public Records
- 2006-01-19 Sold (Public Records) $195,000 Public Records
- 1990-09-13 Sold (Public Records) $63,000 Public Records
- 1984-03-05 Sold (Public Records) $40,000 Public Records
Property tax history
+2.6%/yrLatest (2023): $6,209 · +31.5% YoY. Source: county tax records.
Cash-flow waterfall
monthlySold comps — $/sqft
last 12 mo · ≤1 miLoading sold comps…