 🏷️ Likely Rental
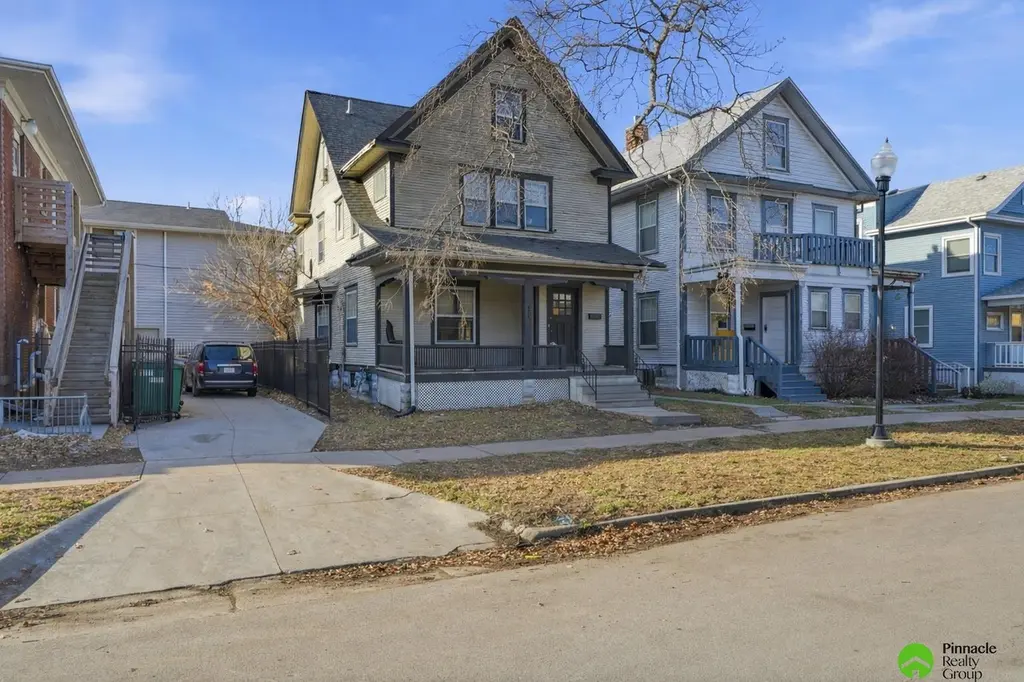
925/927,929/931 Goodhue Blvd · Lincoln, NE
Flood risk 1/10 · Minimal
- FEMA flood zone
- X (unshaded)
- Chance of flooding over 30 yrs
- 0.0%
- Est. flood insurance / yr
- $473 – $860
Fire risk 1/10 · Minimal
- Est. fire insurance / yr
- $1,161 – $2,155
Heat risk 3/10 · Minor
- Hot days now (above 104°F)
- 7 days/yr
- Hot days in 30 yrs
- 16 days/yr
Wind risk 2/10 · Minimal
- Chance of severe wind over 30 yrs
- —
Air-quality risk 1/10 · Minimal
- Unhealthy air days now
- 0 days/yr
- Unhealthy air days in 30 yrs
- 0 days/yr
Risk factors via First Street. Map © Google.
Why this score? — see what drove the A- grade
The composite is a weighted blend of 9 inputs, each scored 0–100. Each bar is that input's sub-score; the figure is the points it added to the 100-point composite (weight × sub-score).
- Cash flow +26.1/30.0
- ARV discount +15.0/15.0
- Appreciation +9.7/10.0
- DSCR +8.8/10.0
- 1% rule +7.2/10.0
- Schools +4.4/10.0
- Livability +4.2/5.0
- Rent growth +2.9/5.0
- Condition / age +2.5/5.0
$249,900
🖨 Deal sheet 📄 Offer letter ✓ Due diligence
Multi-family units
County records classify this as Multi-Family (5+ Unit). Listing-text estimate: 1 unit. estimate disagrees with records
5+ unit building — per-unit beds/baths from public records are typically unavailable; the breakdown below (if shown) is an estimate from the listing text.
Listing remarks
929 & 931 Goodhue Street, along with 925 & 927 Goodhue Street, comprise a four-unit multifamily investment located on a single parcel in a South Lincoln neighborhood. The property consists of two duplexes on the same parcel ID, offering an efficient and manageable small multifamily asset bringing in $3205/month. The unit mix includes three two-bedroom, one-bath units and one one-bedroom, one-bath unit, supporting steady rental demand and broad tenant appeal. Being situated on one parcel allows for streamlined ownership, management, and future planning. This is a solid opportunity for an investor seeking a straightforward four-unit property with consistent income in an establishe
Key facts
- 7,100 sq ft lot
- Built 1913
- Listed 26 days
Property features AI
Exterior
- Parking: No garage
- Utilities: Rural water; Four electrical meters; Four gas meters
- Home design: Residential income property; Multi-family; Not new / not a model; Built in 1913
- Construction: Concrete perimeter foundation
- Exterior features: Lot about 0.16 acre (71 x 100); Lot included in price
Interior
- Heating & cooling: Natural gas heating; Radiant heat; Heating present
- Interior features: Basement present; Four furnaces; Four air conditioning units
Neighborhood map
What this means for you Summary
Snapshot
- This is a 4-bed/2.0-bath multifamily listed at $250k.
Deal economics
- At list price, monthly cash flow is $632 ($8k/yr) — positive.
- The deal already cash-flows at list — no discount required.
- Meets the 1% rule at list price ($3k rent vs $250k).
- Recommended offer: $246k (1.5% below list) — sets the bar for market timing.
- Cap rate 9.3% vs local median 3.0% in Lincoln — top-decile yield for the area; either an underpriced asset or a hidden risk that comps aren't pricing in. Stress-test before assuming the spread holds.
Location & tenants
- Location reads 85/100 on livability (#5 in NE, #545 nationally) — a professional / high-income tenant draw. Strengths: amenities A+, cost of living A+, housing A+; Watch: crime D+.
- Lincoln Public Schools (urban): math 50% / reading 53% proficiency, ranked #59 of 111 in NE (top 53%) — acceptable for families but not a draw, mixed tenant base, ~2y average lease.
- Market conditions: Rents rising (+1.7%/yr); 47 active listings in the ZIP; 3 comparable units currently listed for rent nearby; rentals lingering (median 44d on market — plan ~5-8 weeks vacancy on turnover, expect pricing pressure); 67% of comp listings sitting > 30 days — soft ceiling on asking rent; lower-income renter base — watch delinquency; 1,940 units permitted in Lancaster County in 2024 (895 in 5+ unit buildings).
- At $3,052/mo this rent would consume 117% of the median local household income ($31k/yr) (locally 1882% of renters already pay >50% of income on rent) — very limited rent-growth headroom before tenants either downsize or default.
Forward outlook
- In year one you build about $25k of equity ($2k loan paydown + $23k appreciation (9.3% local appreciation)).
- Lancaster County population projected at +37% by 2050 — long-run rental-demand tailwind backs the buy-and-hold thesis.
- At projected returns (9.3% appreciation + 1.7% rent growth), your $70k cash investment doubles in ~3 years — after that, you're playing with house money.
- By year 2, paydown + projected appreciation supports a ~$40k cash-out refi (75% LTV) — recoverable capital for the next deal without selling this one.
Negotiation context
- It's been on market 27 days — a 2% lower offer ($246k) is reasonable based on typical stale-listing flexibility.
- 11 sale attempts since 17y ago with the ask held roughly flat each time — persistent listings suggest the price (not the market) is what's stuck; bring a comps-based counter.
Risks & watch-outs
- Watch-outs: built in 1913 — expect roof / HVAC / electrical / plumbing capex.
Questions for the listing agent
- Built in 1913 — when were the roof, HVAC, electrical panel, plumbing, and water heater last replaced?
- Is there a deadline driving the sale (1031 exchange, divorce, estate, relocation)? That informs how much negotiation room exists.
- Schools are A-rated — typically a magnet for longer-tenancy family renters. What's the average tenant stay here, and is there a school-zone premium baked into asking?
- Crime grade is D in this area — have there been break-ins, vandalism, or insurance claims at this property in the last 3 years? What carrier currently insures it and at what premium?
- What's the average days-on-market for RENTAL listings here right now (not sales)? A rising rental-DOM trend means longer vacancies and softer asking-rent achievability than the comps imply.
- What's the recent tenant-quality profile in this submarket — average credit score on applications, eviction rate, late-payment / NSF rate, and stable-employment percentage? A property-management company in the area should have these aggregated.
- How much new apartment / multifamily construction is in the pipeline within 1–3 miles? Heavy new supply (>2% of stock underway) typically softens rents 12–24 months out; light construction supports rent growth.
Investment metrics
- 1% rule
- 1.22% ✓
- Cap rate
- 9.33%
- Cash-on-cash
- 10.83%
- DSCR
- 1.48
- GRM
- 6.8
CMA / ARV
- ARV (median comp)
- $314,960
- List price
- $249,900
- Delta
- -20.66%
- Verdict
- UNDERPRICED
- Comps
- 20 within 1.0 mi
Show comp detail 5 sales within ~0.75 mi
| Address | Dist | Beds/Ba | Sqft | Sold | Price | $/sf | Match |
|---|---|---|---|---|---|---|---|
| 1017-19 S 17th St | 0.17mi | 4/2.0 | 2,600 (-5%) | 23mo | $189,500 | $73 | 64 |
| 1200 S 13th St | 0.24mi | 4/4.0 | 2,576 (-6%) | 19mo | $277,500 | $108 | 55 |
| 2224 A St | 0.69mi | 5/3.0 (+1) | 3,045 (+11%) | 1mo | $165,000 | $54 | 40 |
| 830 E St | 0.48mi | 3/1.0 (-1) | 2,442 (-11%) | 14mo | $235,000 | $96 | 39 |
| 1135 Sumner St | 0.63mi | 5/4.0 (+1) | 2,540 (-8%) | 13mo | $255,000 | $100 | 34 |
Match score weights: distance 35% · size 25% · config 20% · recency 20%. Top-matched comps best support the ARV.
Projected returns pro-forma
9.31% appreciation · 1.69% rent growth · sell at horizon
- IRR
- 30.3%
- Equity multiple
- 3.30×
- Total profit
- $160,775
- Equity at exit
- $212,721
- IRR
- 26.1%
- Equity multiple
- 7.17×
- Total profit
- $431,698
- Equity at exit
- $446,149
Cash invested: $69,972 (down + closing). Projections, not guarantees.
Landlord ↔ Tenant lean methodology
- Overall (STATE)
- 83 Strongly Landlord-Friendly
- State Nebraska
- 83 Strongly Landlord-Friendly · R+13
- County
- — inherits STATE
- City
- — inherits STATE
ZIP-level market 68508
- Home prices YoY
- 4.1%
- Rents YoY
- 1.7%
- Active inventory
- 47
- Price-to-rent
- 26.9×
Monthly cashflow live
- Estimated rent
- $3,052 high interval (Pro) →
- Mortgage (P&I)
- −$1,311
- Tax from tax record
- −$365 /mo · $4,378/yr
- Insurance
- −$104
- HOA
- −$0
- Vacancy / Maint / Mgmt
- −$641
- Net cashflow
- $632
Break-even live
4-unit breakdown (identical units grouped — click to expand)
| Units | Beds | Baths | Est. rent |
|---|---|---|---|
| 3× units | 2 | 1 | $2,319 |
| #1 | 2 | 1 | $773 |
| #2 | 2 | 1 | $773 |
| #3 | 2 | 1 | $773 |
| 1× unit | 1 | 1 | $732 |
| Total (4 units) | $3,052 | ||
UW: 25.0% down · 7.5% · 30yr · 1.5% tax · 5.0% vac · 8.0% maint · 8.0% mgmt
Financing live
Cash to close
- Down payment
- $62,475
- Closing costs
- $7,497
- Reserves months
- —
- Total cash needed
- —
Loan-product check · same deal, 3 products live
Conventional
25% down · 7.5% · 30yr
- Down + closing
- —
- Monthly P&I
- —
- Monthly cashflow
- —
- DSCR
- —
- Eligible?
- —
Personal DTI + credit; lowest rate.
DSCR
20% down · 8.5% · 30yr
- Down + closing
- —
- Monthly P&I
- —
- Monthly cashflow
- —
- DSCR
- —
- Eligible?
- —
No personal income docs; deal must DSCR.
Hard money
10% down · 12.0% · 12mo
- Down + closing
- —
- Monthly P&I
- —
- Monthly cashflow
- —
- DSCR
- —
- Eligible?
- —
Short-term bridge; refi at stabilization.
Rent comps 3 comps
| Address | Beds | Baths | Sqft | Rent | $/sqft | DOM | Units | Dist |
|---|---|---|---|---|---|---|---|---|
| 1424 F St Lincoln, NE | 4.0 | 2.0 | 3091 | $2,095 | $0.68 | 43d | 1 | 0.07mi |
| 920 E St Lincoln, NE | 4.0 | 2.0 | 1872 | $1,750 | $0.93 | 21d | 1 | 0.42mi |
| 1710 Harwood St Lincoln, NE | 4.0 | 2.0 | 2200 | $1,800 | $0.82 | 43d | 1 | 0.77mi |
Listing history 36 events
-
2026-06-10days on market $249,900 Active 27 DOM
-
2026-06-09days on market $249,900 Active 26 DOM
-
2026-06-08days on market $249,900 Active 25 DOM
-
2026-06-07days on market $249,900 Active 24 DOM
-
2026-06-05days on market $249,900 Active 21 DOM
-
2026-06-03days on market $249,900 Active 20 DOM
-
2026-06-02days on market $249,900 Active 19 DOM
-
2026-06-01days on market $249,900 Active 18 DOM
-
2026-05-31days on market $249,900 Active 17 DOM
-
2026-05-30days on market $249,900 Active 16 DOM
-
2026-05-14historical
-
2026-05-13$249,900 New 765-char remark
-
2026-05-06price $269,000
-
2026-04-10$299,000 New
-
2026-04-10historical
-
2026-03-09$326,600 New
-
2026-03-09historical
-
2026-01-06$336,600 New
-
2024-05-03historical $999
-
2024-04-17price $999
-
2024-04-10$1,100
-
2024-04-10historical $1,100
-
2024-03-30price $1,100
-
2024-01-12$1,150
-
2023-06-22historical
-
2023-04-26$2,835,000 New
-
2020-06-18soldstatus $490,000
-
2016-03-03soldstatus $123,000
-
2016-01-31historical
-
2015-08-12$133,900
-
2015-07-31historical
-
2015-01-09$137,900
-
2014-11-30historical
-
2014-05-19$142,900
-
2009-12-31historical
-
2009-06-17$139,000
ⓘ Source: listings_history table (triggers on properties + properties_extension) + one-shot
backfill from property_details.listing_events for pre-trigger history.
Tax reassessment forecast NE · Resets to sale price
- Current annual tax
- $4,378 · $365/mo
- Projected year-2 tax
- $4,378 · $365/mo
- Expected delta
- $0/yr ($0/mo · 0.0%)
ⓘ Screening estimate from a state-policy table — verify with the county assessor before closing.
Climate risk First Street
- Flood 1/10 Low FEMA zone X (unshaded) · 0% chance over 30 yrs
- Wildfire 1/10 Low
- Heat 3/10 Moderate 7 d/yr ≥104°F today · 16 d/yr by 30 yrs out
- Wind 2/10 Low
- Air quality 1/10 Low 0 unhealthy d/yr today · 0 by 30 yrs out
Nearby sold comps map
Loading sold comps map…
Walkable amenities ~0.75 mi
Loading nearby amenities…
Taxation est. · year 1
- Rental income
- $36,624
- − Mortgage interest
- −$13,998
- − Property taxes
- −$4,378
- − Insurance
- −$1,250
- − Repairs & maintenance
- −$2,930
- − Management
- −$2,930
- − Depreciation
- −$7,270
- Taxable income
- $3,869
- Est. tax owed @ 24.0%
- −$929
- After-tax cash flow
- $6,651/yr
For passive investors: Depreciation is non-cash, so a rental often shows a tax loss while cash-flowing — sheltering income. Rental losses are passive: they offset passive income freely, and up to $25,000/yr can offset ordinary (W-2) income if you actively participate and your MAGI is under $100k (phasing out to $0 by $150k); unused losses carry forward. On sale, claimed depreciation is recaptured at up to 25%, and gains may owe capital-gains tax (a 1031 exchange can defer both). Figures are a year-1 estimate at your 24.0% rate — not tax advice; consult a CPA.
Schools (NCES district)
- District
- Lincoln Public Schools
- NCES district ID
- 3172840
- Math proficiency
- 50% ▼ -6.00%
- Reading proficiency
- 53% ▼ -3.00%
- Median HH income
- $50,273
- Composite
- 44.05/100
- National rank
- #2880
- State rank
- #59 of 111 in NE
Livability — Lincoln
- Score
- 85/100
- State rank
- #5
- US rank
- #545
Category grades
Schools grade is shown separately in the Schools card above.
Census & demographics
- Census place
- Lincoln, NE
- County
- Lancaster County · 291,509 people
- City population
- 291,509
- Metro
- Lincoln, NE
- Population (ZIP)
- 18,163
- Household income
- $31,191
- Rent vs Own
- Severe rent burden
- 1882.0
Population outlook (Lancaster County) Hauer SSP2
- Today (2025)
- 352,806 people
- By 2030
- 377,899 · +7.1%
- By 2040
- 428,582 · +21.5%
- By 2050
- 483,103 · +36.9%
- By 2075
- 632,390 · +79.2%
- By 2100
- 759,513 · +115.3%
Race, ethnicity, and origin ACS 2023
- Neighborhood character
- Predominantly White (74%)
- Race & ethnicity
- White 74% Hispanic / Latino 11% Two or more races 7% Asian 6% Black 4%
- Hispanic origin (detail)
- Mexican 6%
- Common ancestry
- Romanian 3% Scotch-Irish 2% Lithuanian 2%
- Foreign-born
- 10% · Canada, China, Philippines
- Languages at home
- 84% English-only · Spanish 8% Other Asian/Pacific 2% Chinese 2%
Political lean MEDSL · Lancaster
- 2024 margin
- Toss-up / Even · D 51.4% · R 47.1% · Other 1.5%
- 2008→2024 swing
- -0.7pp no change · 2008: 5.0pp · 2024: 4.3pp
- All cycles
- 2024: D+4.3 2020: D+7.8 2016: D+0.1 2012: R+1.0 2008: D+5.0
Not yet ingested
- Civics
- —
Market trends
- HPI YoY
- ▲ 9.31%
- Current HPI
- 238.2553
- Rent YoY
- ▲ 1.69%
- Metro
- Lincoln, NE
- State GDP YoY
- ▲ 0.68%
- F500 in state
- 2
Industry mix (Fortune 500 HQ in NE)
| Industry | F500 HQs | Revenue |
|---|---|---|
| Conglomerate | 1 | $371B |
|
||
Price history
+79.8% since first listed27 events — show timeline
- 2026-06-10 Listing Removed — GPRMLS
- 2026-05-14 Listing Removed — GPRMLS
- 2026-05-13 Listed $249,900 GPRMLS
- 2026-05-06 Price Changed $269,000 GPRMLS
- 2026-04-10 Listing Removed — GPRMLS
- 2026-04-10 Listed $299,000 GPRMLS
- 2026-03-09 Listing Removed — GPRMLS
- 2026-03-09 Listed $326,600 GPRMLS
- 2026-01-06 Listed $336,600 GPRMLS
- 2024-05-03 Rental Removed $999 APPFOLIO
- 2024-04-17 Price Changed $999 APPFOLIO
- 2024-04-10 Listed for Rent $1,100 APPFOLIO
- 2024-04-10 Rental Removed $1,100 APPFOLIO
- 2024-03-30 Price Changed $1,100 APPFOLIO
- 2024-01-12 Listed for Rent $1,150 APPFOLIO
- 2023-06-22 Listing Removed — GPRMLS
- 2023-04-26 Listed $2,835,000 GPRMLS
- 2020-06-18 Sold (Public Records) $490,000 Public Records
- 2016-03-03 Sold (MLS) $123,000 GPRMLS
- 2016-01-31 Listing Removed — GPRMLS
- 2015-08-12 Listed $133,900 GPRMLS
- 2015-07-31 Listing Removed — GPRMLS
- 2015-01-09 Listed $137,900 GPRMLS
- 2014-11-30 Listing Removed — GPRMLS
- 2014-05-19 Listed $142,900 GPRMLS
- 2009-12-31 Listing Removed — GPRMLS
- 2009-06-17 Listed $139,000 GPRMLS
Property tax history
+8.3%/yrLatest (2025): $4,378 · -8.0% YoY. Source: county tax records.
Cash-flow waterfall
monthlySold comps — $/sqft
last 12 mo · ≤1 miLoading sold comps…