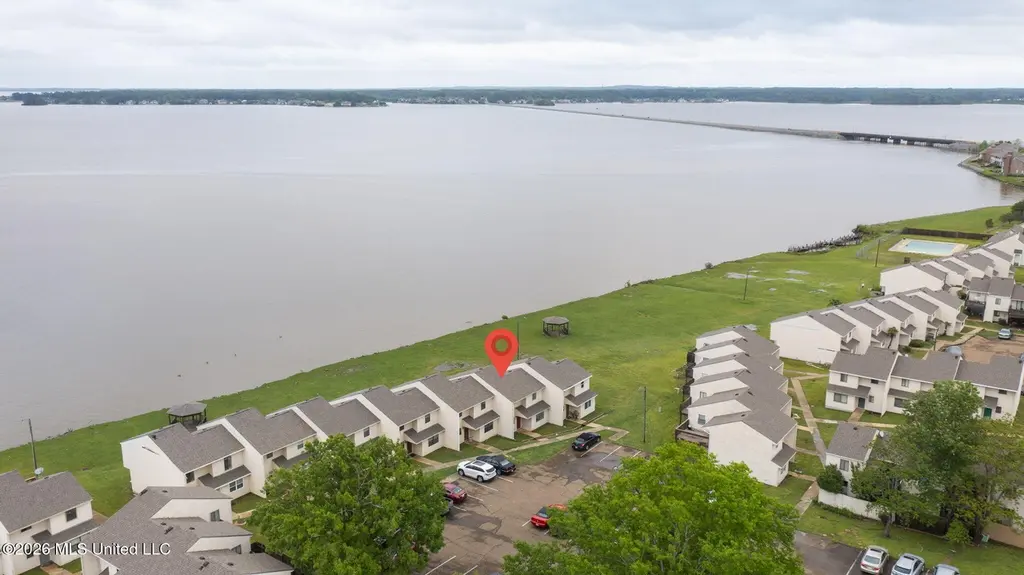
1056 Windrose Dr · Flowood, MS
Flood risk 1/10 · Minimal
- FEMA flood zone
- X (unshaded)
- Chance of flooding over 30 yrs
- 0.0%
- Est. flood insurance / yr
- $507 – $1,088
Fire risk 1/10 · Minimal
- Est. fire insurance / yr
- $1,241 – $2,305
Heat risk 8/10 · Major
- Hot days now (above 108°F)
- 7 days/yr
- Hot days in 30 yrs
- 21 days/yr
Wind risk 8/10 · Major
- Chance of severe wind over 30 yrs
- 80.0%
Air-quality risk 2/10 · Minimal
- Unhealthy air days now
- 1 days/yr
- Unhealthy air days in 30 yrs
- 1 days/yr
Risk factors via First Street. Map © Google.
Why this score? — see what drove the D- grade
The composite is a weighted blend of 9 inputs, each scored 0–100. Each bar is that input's sub-score; the figure is the points it added to the 100-point composite (weight × sub-score).
- Cash flow +9.4/30.0
- ARV discount +6.3/15.0
- Schools +4.6/10.0
- Livability +3.9/5.0
- 1% rule +3.5/10.0
- Rent growth +3.2/5.0
- DSCR +2.6/10.0
- Condition / age +2.5/5.0
- Appreciation +0.0/10.0
$199,000
🖨 Deal sheet (PDF) 📄 Offer letter ✓ Due diligence
Listing remarks MLS
Waterfront 3BR 1.5 bath townhome on the REZ! Beautiful view of the Ross Barnett Reservoir from your patio or upstairs deck. With a little TLC, this place could be the perfect full-time home or summer time vacation retreat. Wonderful location close to grocery stores, restaurants, and shopping. Call your favorite realtor today.
Key facts
- Renovated
- Granite counters
- $225 HOA
Tags
Property features AI
Finance
- HOA & community: Homeowners association with $225 monthly fee; Association covers grounds maintenance, management, and pool service; Community pool
Exterior
- Parking: Common paved parking
- Security: Smoke detectors; Dead bolt locks
- Utilities: Public water; Public sewer; Electricity connected; Cable available; Sewer connected; Water connected
- Home design: Townhouse; Multi-family structure; Two stories; Entry faces not specified; Fixer condition
- Construction: HardiPlank-type siding; Asphalt shingle roof; Conventional foundation; Built area approximately 1,400 (estimated)
- Exterior features: Patio; Rear porch; Balcony; Rain gutters; Level lot; Reservoir frontage (waterfront)
Interior
- Kitchen: Free-standing electric range; Dishwasher; Refrigerator; Laminate counters
- Bedrooms: Two-level layout
- Flooring: Carpet; Ceramic tile; Laminate
- Bathrooms: 1 full bathroom; 1 half bathroom (1.5 total)
- Heating & cooling: Central heating; Central air conditioning; Ceiling fans; Electric cooling
- Interior features: Ceiling fans; His and hers closets; Laminate counters; Smart thermostat; Insulated windows; Dead bolt locks; Metal insulated doors
- Laundry & utility: Washer hookup; Electric dryer hookup; In-kitchen laundry hookups; Electric water heater
Neighborhood map
What this means for you Summary
Snapshot
- This is a 2-bed/1.0-bath townhouse listed at $199k.
Deal economics
- At list price, monthly cash flow is $-141 ($-2k/yr) — negative.
- To cash-flow at today's rent, offer at most $174k (12.5% below list).
- To meet the 1% rule (rent ≥ 1% of price), the offer needs to be $170k (14.8% below list).
- Recommended offer: $170k (14.8% below list) — sets the bar for 1% rule.
- Cap rate 5.4% vs local median 4.3% in Flowood — meaningfully above typical; check what's discounted (condition, days-on-market, listing class) to confirm the premium yield is real.
Location & tenants
- Location reads 77/100 on livability (#10 in MS, #3,075 nationally) — a middle-class / working-renter tenant base. Strengths: crime A+, cost of living A+, housing A+; Watch: amenities F, commute F.
- Rankin County School District (rural): math 56% / reading 48% proficiency, ranked #6 of 130 in MS (top 5%) — acceptable for families but not a draw, mixed tenant base, ~2y average lease.
- Zoned schools: Northshore Elementary (math 82% / reading 68%, grade A, #5 of 375 statewide, top 1%, 551 students, 100% FRL); Northwest Rankin Middle School (math 63% / reading 51%, grade B, #13 of 179 statewide, top 7%, 1,374 students, 100% FRL); Northwest Rankin High School (math 48% / reading 42%, grade D-, #34 of 197 statewide, top 17%, 1,898 students, 100% FRL) — zoned schools average 100% FRL vs 35% district-wide (65 pts higher); higher-poverty schools than district average — tighter screening recommended.
- Market conditions: Rents rising (+2.9%/yr); 440 active listings in the ZIP; 6 comparable units currently listed for rent nearby; rentals lingering (median 46d on market — plan ~5-8 weeks vacancy on turnover, expect pricing pressure); 50% of comp listings sitting > 30 days — soft ceiling on asking rent; solid renter incomes; 343 units permitted in Rankin County in 2024 (0 in 5+ unit buildings).
Forward outlook
- Local home prices are declining (-3.0%/yr); year-one equity from $1k of loan paydown is wiped out by about $6k of value loss. Plan a longer hold.
- Rankin County population projected at +17% by 2050 — long-run rental-demand tailwind backs the buy-and-hold thesis.
Negotiation context
- It's been on market 28 days — a 2% lower offer ($196k) is reasonable based on typical stale-listing flexibility.
- 4 sale attempts since 16y ago with the ask held roughly flat each time — persistent listings suggest the price (not the market) is what's stuck; bring a comps-based counter.
Risks & watch-outs
- Climate carrying-cost: severe wind risk, 80% chance of damaging wind over 30y; extreme-heat days projected 7→21/yr by 2055 (HVAC capex compounding) — expect insurance premiums to compound above CPI over the hold.
Questions for the listing agent
- What do current leases actually rent for vs. the listed asking? Can we see a recent rent roll and the last 12 months of T-12 income?
- What does the HOA fee cover, when was the last increase, and are there any pending special assessments or reserve-fund shortfalls?
- Is there a deadline driving the sale (1031 exchange, divorce, estate, relocation)? That informs how much negotiation room exists.
- Schools are B-rated — typically a magnet for longer-tenancy family renters. What's the average tenant stay here, and is there a school-zone premium baked into asking?
- The area grade is low — what's the realistic commute time and amenity access for the typical tenant pool here? Any planned neighborhood developments (good or bad) we should know about?
- What's the average days-on-market for RENTAL listings here right now (not sales)? A rising rental-DOM trend means longer vacancies and softer asking-rent achievability than the comps imply.
- What's the recent tenant-quality profile in this submarket — average credit score on applications, eviction rate, late-payment / NSF rate, and stable-employment percentage? A property-management company in the area should have these aggregated.
- How much new for-sale + rental construction is in the pipeline within 1–3 miles? Heavy new supply typically softens prices + rents 12–24 months out; constrained supply supports both.
Investment metrics
- 1% rule
- 0.85% ✗
- Cap rate
- 5.44%
- Cash-on-cash
- -3.04%
- DSCR
- 0.86
- GRM
- 9.8
CMA / ARV
- ARV (on-the-fly)
- $193,708
- Comps found
- 12
Show comp detail 12 sales within ~0.75 mi
| Address | Dist | Beds/Ba | Sqft | Sold | Price | $/sf | Match |
|---|---|---|---|---|---|---|---|
| 19 Lake Barnett Dr | 0.15mi | 2/2.5 | 1,268 (+3%) | 1mo | $204,900 | $162 | 80 |
| 1069 Windrose Dr #69 | 0.04mi | 3/2.5 (+1) | 1,300 (+6%) | 1mo | $164,000 | $126 | 76 |
| 434 Woodlake Ln | 0.29mi | 2/2.0 | 1,173 (-4%) | 1mo | $185,500 | $158 | 74 |
| 1017 Windrose Dr | 0.08mi | 3/2.5 (+1) | 1,244 (+2%) | 10mo | $150,000 | $121 | 74 |
| 1050 Windrose Dr #1050 | 0.02mi | 3/2.5 (+1) | 1,300 (+6%) | 4mo | $165,000 | $127 | 74 |
| 519 Harbor Ridge Dr | 0.18mi | 3/2.0 (+1) | 1,250 (+2%) | 10mo | $180,000 | $144 | 71 |
| 54 Woodlake Dr | 0.21mi | 2/2.0 | 1,130 (-8%) | 4mo | $195,000 | $173 | 70 |
| 1016 Windrose Dr | 0.07mi | 3/2.5 (+1) | 1,340 (+9%) | 1mo | $164,500 | $123 | 69 |
| 74 Lake Barnett Dr | 0.34mi | 2/2.0 | 1,156 (-6%) | 4mo | $219,000 | $189 | 68 |
| 810 Harbor Bend Dr | 0.15mi | 3/2.0 (+1) | 1,370 (+12%) | 8mo | $164,400 | $120 | 58 |
| 426 Woodlake Ln | 0.29mi | 3/2.5 (+1) | 1,375 (+12%) | 1mo | $234,900 | $171 | 54 |
| 242 Commonwealth Ave | 0.64mi | 3/2.0 (+1) | 1,333 (+9%) | 11mo | $220,000 | $165 | 37 |
Match score weights: distance 35% · size 25% · config 20% · recency 20%. Top-matched comps best support the ARV.
Projected returns pro-forma
-3.0% appreciation · 2.9% rent growth · sell at horizon
- IRR
- -21.4%
- Equity multiple
- 0.26×
- Total profit
- $-41,326
- Equity at exit
- $29,672
- IRR
- -15.2%
- Equity multiple
- 0.14×
- Total profit
- $-47,904
- Equity at exit
- $17,206
Cash invested: $55,720 (down + closing). Projections, not guarantees.
Landlord ↔ Tenant lean methodology
- Overall (STATE)
- 90 Strongly Landlord-Friendly
- State Mississippi
- 90 Strongly Landlord-Friendly · R+11
- County
- — inherits STATE
- City
- — inherits STATE
ZIP-level market 39047
- Home prices YoY
- -32.6%
- Rents YoY
- 2.9%
- Active inventory
- 440
- Price-to-rent
- 9.8×
Monthly cashflow live
- Estimated rent
- $1,696 high interval (Pro) →
- Mortgage (P&I)
- −$1,044
- Tax from tax record
- −$130 /mo · $1,559/yr
- Insurance
- −$83
- HOA
- −$225
- Vacancy / Maint / Mgmt
- −$356
- Net cashflow
- $-141
Break-even live
Sensitivity live
| Price | -10% $-29 | -5% $-85 | +0% $-141 | +5% $-198 | +10% $-254 |
|---|---|---|---|---|---|
| Rent | -10% $-275 | -5% $-208 | +0% $-141 | +5% $-74 | +10% $-7 |
| Rate | -1.0pp $-41 | -0.5pp $-91 | base $-141 | +0.5pp $-193 | +1.0pp $-245 |
UW: 25.0% down · 7.5% · 30yr · 1.5% tax · 5.0% vac · 8.0% maint · 8.0% mgmt
Financing live
Cash to close
- Down payment
- $49,750
- Closing costs
- $5,970
- Reserves months
- —
- Total cash needed
- —
Loan-product check · same deal, 3 products live
Conventional
25% down · 7.5% · 30yr
- Down + closing
- —
- Monthly P&I
- —
- Monthly cashflow
- —
- DSCR
- —
- Eligible?
- —
Personal DTI + credit; lowest rate.
DSCR
20% down · 8.5% · 30yr
- Down + closing
- —
- Monthly P&I
- —
- Monthly cashflow
- —
- DSCR
- —
- Eligible?
- —
No personal income docs; deal must DSCR.
Hard money
10% down · 12.0% · 12mo
- Down + closing
- —
- Monthly P&I
- —
- Monthly cashflow
- —
- DSCR
- —
- Eligible?
- —
Short-term bridge; refi at stabilization.
Rent comps 6 comps
| Address | Beds | Baths | Sqft | Rent | $/sqft | DOM | Units | Dist |
|---|---|---|---|---|---|---|---|---|
| 833 Harbor Bend Dr Unit 1 Brandon, MS | 2.0 | 1.5 | 1000 | $1,495 | $1.50 | 45d | 1 | 0.12mi |
| 839 Harbor Bend Dr Unit 1 Brandon, MS | 2.0 | 1.5 | 1000 | $1,295 | $1.29 | 45d | 1 | 0.12mi |
| 74 Lake Barnett Dr Brandon, MS | 2.0 | 2.0 | 1156 | $2,500 | $2.16 | 16d | 1 | 0.33mi |
| 111 Lakeshore Dr Brandon, MS | 1.0–3.0 | 1.0–2.0 | 974 | $1,992 | $2.04 | 16d | 8 | 0.71mi |
| 352 Brendalwood Cv Brandon, MS | 2.0 | 1.5 | 1248 | $1,157 | $0.93 | 45d | 1 | 0.89mi |
| 500 Avalon Way Brandon, MS | 2.0–3.0 | 2.0 | 1287 | $1,800 | $1.40 | 16d | 6 | 1.47mi |
HOA detail
- Monthly dues
- $225 · $2,700/yr
- Likely covers
- water
Listing history 25 events
-
2026-06-22days on market $199,000 Active 28 DOM
-
2026-06-18days on market $199,000 Active 25 DOM
-
2026-06-17days on market $199,000 Active 24 DOM
-
2026-06-16days on market $199,000 Active 23 DOM
-
2026-06-15days on market $199,000 Active 22 DOM
-
2026-06-14days on market $199,000 Active 20 DOM
-
2026-06-13days on market $199,000 Active 19 DOM
-
2026-06-10days on market $199,000 Active 17 DOM
-
2026-06-09days on market $199,000 Active 16 DOM
-
2026-06-08days on market $199,000 Active 15 DOM
-
2026-06-07days on market $199,000 Active 14 DOM
-
2026-06-03days on market $199,000 Active 10 DOM
-
2026-06-02days on market $199,000 Active 9 DOM
-
2026-06-01days on market $199,000 Active 8 DOM
-
2026-05-31days on market $199,000 Active 7 DOM
-
2026-05-30days on market $199,000 Active 6 DOM
-
2026-05-24$199,000 Active
-
2024-05-22historical
-
2024-04-26price $205,000
-
2024-04-19$230,000 Active
-
2022-11-10soldstatus Closed 330-char remark
Show marketing remark (330 chars)
Waterfront 3BR 1.5 bath townhome on the REZ! Beautiful view of the Ross Barnett Reservoir from your patio or upstairs deck. With a little TLC, this place could be the perfect full-time home or summer time vacation retreat. Wonderful location close to grocery stores, restaurants, and shopping. Call your favorite realtor today.
-
2022-11-07status Pending 330-char remark
Show marketing remark (330 chars)
Waterfront 3BR 1.5 bath townhome on the REZ! Beautiful view of the Ross Barnett Reservoir from your patio or upstairs deck. With a little TLC, this place could be the perfect full-time home or summer time vacation retreat. Wonderful location close to grocery stores, restaurants, and shopping. Call your favorite realtor today.
-
2022-11-04$120,000 Active 330-char remark
Show marketing remark (330 chars)
Waterfront 3BR 1.5 bath townhome on the REZ! Beautiful view of the Ross Barnett Reservoir from your patio or upstairs deck. With a little TLC, this place could be the perfect full-time home or summer time vacation retreat. Wonderful location close to grocery stores, restaurants, and shopping. Call your favorite realtor today.
-
2010-10-15soldstatus
-
2010-03-19$88,000
ⓘ Source: listings_history table (triggers on properties + properties_extension) + one-shot
backfill from property_details.listing_events for pre-trigger history.
Tax reassessment forecast MS · Resets to sale price
- Current annual tax
- $1,559 · $130/mo
- Projected year-2 tax
- $1,572 · $131/mo
- Expected delta
- +$13/yr (+$1/mo · 0.9%)
ⓘ Screening estimate from a state-policy table — verify with the county assessor before closing.
Climate risk First Street
- Flood 1/10 Low FEMA zone X (unshaded) · 0% chance over 30 yrs
- Wildfire 1/10 Low
- Heat 8/10 Severe 7 d/yr ≥108°F today · 21 d/yr by 30 yrs out
- Wind 8/10 Severe 80% chance of damaging wind over 30 yrs
- Air quality 2/10 Low 1 unhealthy d/yr today · 1 by 30 yrs out
Nearby sold comps map
Loading sold comps map…
Walkable amenities ~0.75 mi
Loading nearby amenities…
Taxation est. · year 1
- Rental income
- $20,356
- − Mortgage interest
- −$11,147
- − Property taxes
- −$1,559
- − Insurance
- −$995
- − Repairs & maintenance
- −$1,628
- − Management
- −$1,628
- − HOA
- −$2,700
- − Depreciation
- −$5,789
- Taxable loss
- −$5,091
- Est. tax savings @ 24.0%
- +$1,222
- After-tax cash flow
- $-474/yr
For passive investors: Depreciation is non-cash, so a rental often shows a tax loss while cash-flowing — sheltering income. Rental losses are passive: they offset passive income freely, and up to $25,000/yr can offset ordinary (W-2) income if you actively participate and your MAGI is under $100k (phasing out to $0 by $150k); unused losses carry forward. On sale, claimed depreciation is recaptured at up to 25%, and gains may owe capital-gains tax (a 1031 exchange can defer both). Figures are a year-1 estimate at your 24.0% rate — not tax advice; consult a CPA.
Schools (NCES district)
- District
- Rankin County School District
- NCES district ID
- 2803830
- Math proficiency
- 56% ▼ -4.00%
- Reading proficiency
- 48% ▼ -6.00%
- Median HH income
- $61,867
- Composite
- 45.62/100
- National rank
- #2587
- State rank
- #6 of 130 in MS
Livability — Flowood
- Score
- 77/100
- State rank
- #10
- US rank
- #3075
Category grades
Schools grade is shown separately in the Schools card above.
Census & demographics
- County
- Rankin County · 123,614 people
- City population
- 9,222
- Metro
- Jackson, MS
- Population (ZIP)
- 40,808
- Household income
- $100,347
- Rent vs Own
- Severe rent burden
- 551.0
Population outlook (Rankin County) Hauer SSP2
- Today (2025)
- 164,317 people
- By 2030
- 171,013 · +4.1%
- By 2040
- 182,723 · +11.2%
- By 2050
- 192,376 · +17.1%
- By 2075
- 209,535 · +27.5%
- By 2100
- 209,534 · +27.5%
Race, ethnicity, and origin ACS 2023
- Neighborhood character
- Predominantly White (77%)
- Race & ethnicity
- White 77% Black 16% Two or more races 4% Hispanic / Latino 2% Asian 1%
- Common ancestry
- Italian 4% Slovak 3% Serbian 3%
- Foreign-born
- 3% · Canada
- Languages at home
- 95% English-only · Spanish 3% Other Indo-European 1% Other Asian/Pacific 1%
Political lean MEDSL · Rankin
- 2024 margin
- Solid R (+47.1) · D 25.9% · R 73.0% · Other 1.0%
- 2008→2024 swing
- +6.4pp toward D · 2008: -53.5pp · 2024: -47.1pp
- All cycles
- 2024: R+47.1 2020: R+45.4 2016: R+52.9 2012: R+51.9 2008: R+53.5
Not yet ingested
- Civics
- —
Market trends
- HPI YoY
- ▼ -79.01%
- Current HPI
- 162.9709
- Rent YoY
- ▲ 2.90%
- Metro
- Jackson, MS
- State GDP YoY
- —
- F500 in state
- 0
Price history
+126.1% since first listed9 events — show timeline
- 2026-05-24 Listed $199,000 MLSU
- 2024-05-22 Listing Removed — MLSU
- 2024-04-26 Price Changed $205,000 MLSU
- 2024-04-19 Listed $230,000 MLSU
- 2022-11-10 Sold (MLS) — MLSU
- 2022-11-07 Pending — MLSU
- 2022-11-04 Listed $120,000 MLSU
- 2010-10-15 Sold (MLS) — MLSU
- 2010-03-19 Listed $88,000 MLSU
Property tax history
+12.5%/yrLatest (2025): $1,559 · +5.4% YoY. Source: county tax records.
Cash-flow waterfall
monthlySold comps — $/sqft
last 12 mo · ≤1 miLoading sold comps…