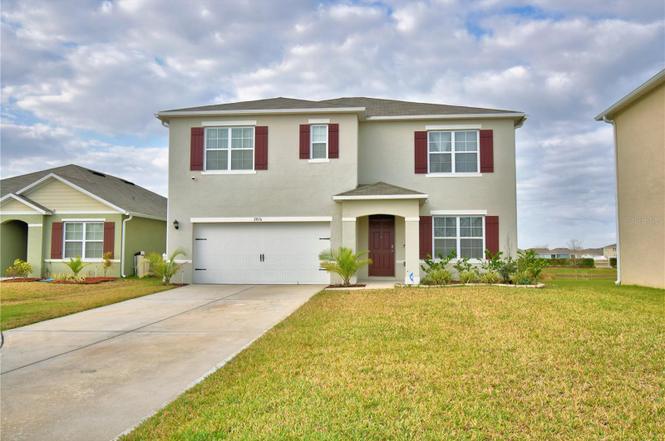
2816 Ivy Lake Ct · Lakeland, FL
Flood risk 4/10 · Minor
- FEMA flood zone
- X (unshaded)
- Chance of flooding over 30 yrs
- 0.2%
- Est. flood insurance / yr
- $507 – $1,088
Fire risk 5/10 · Moderate
- Est. fire insurance / yr
- $947 – $1,759
Heat risk 8/10 · Major
- Hot days now (above 108°F)
- 7 days/yr
- Hot days in 30 yrs
- 22 days/yr
Wind risk 9/10 · Severe
- Chance of severe wind over 30 yrs
- 99.0%
Air-quality risk 2/10 · Minimal
- Unhealthy air days now
- 1 days/yr
- Unhealthy air days in 30 yrs
- 2 days/yr
Risk factors via First Street. Map © Google.
Why this score? — see what drove the D grade
The composite is a weighted blend of 9 inputs, each scored 0–100. Each bar is that input's sub-score; the figure is the points it added to the 100-point composite (weight × sub-score).
- Cash flow +13.9/30.0
- ARV discount +7.5/15.0
- DSCR +4.2/10.0
- Livability +3.9/5.0
- Schools +3.5/10.0
- 1% rule +2.9/10.0
- Rent growth +2.5/5.0
- Condition / age +2.5/5.0
- Appreciation +0.0/10.0
$384,000
🖨 Deal sheet (PDF) 📄 Offer letter ✓ Due diligence
Listing remarks
PRICE REDUCTION!!! Welcome to this exceptional 5-bedroom, 3-bathroom home, where your peaceful sanctuary awaits! The fully fenced backyard offers privacy and space for outdoor activities. Step inside to discover an expansive open floor plan designed for modern living. The chef’s kitchen boasts stainless steel appliances, ample cabinetry, stone countertops and a spacious island that overlooks the bright and airy living room—ideal for both daily living and entertaining. Natural light floods the home, enhancing its warm and inviting atmosphere. A versatile fifth bedroom on the main floor, along with a full bathroom, makes the perfect home office or guest suite. Ceramic tile floor
Key facts
- Spacious island
- Open floor plan
- Stone countertops
Tags
Property features AI
Finance
- Other: Lease restrictions apply
- HOA & community: HOA: Artemis (monthly HOA $107; quarterly fee $321); Clubhouse; Community mailbox; Deed restrictions; Playground; Pool; Sidewalks; Pets allowed
Exterior
- Parking: Attached 2-car garage
- Utilities: Public water; Public sewer; Cable connected; High-speed internet available; Electricity connected; Water connected; Sewer connected
- Home design: Single family residence; Two stories; Faces northeast; Residential property
- Construction: Block and stucco construction; Shingle roof; Slab foundation; Built on a 0.17-acre lot
- Exterior features: Sliding doors; Other exterior features
Interior
- Kitchen: Dishwasher; Microwave; Range; Refrigerator
- Bedrooms: 5 bedrooms
- Flooring: Carpet; Tile
- Bathrooms: 3 full bathrooms
- Heating & cooling: Central heating; Central air conditioning
- Interior features: Ceiling fans; Eat-in kitchen; Stone counters; Thermostat; Walk-in closets; Window treatments
- Laundry & utility: Inside laundry room
Neighborhood map
What this means for you Summary
Snapshot
- This is a 4-bed/3.0-bath single-family listed at $384k.
Deal economics
- At list price, monthly cash flow is $39 ($470/yr) — positive.
- The deal already cash-flows at list — no discount required.
- To meet the 1% rule (rent ≥ 1% of price), the offer needs to be $303k (21.0% below list).
- Recommended offer: $303k (21.0% below list) — sets the bar for 1% rule.
Location & tenants
- Location reads 77/100 on livability (#206 in FL, #3,179 nationally) — a middle-class / working-renter tenant base. Strengths: cost of living A+, housing A+, health & safety A+; Watch: employment D+, amenities F, commute F.
- Polk (suburban): math 39% / reading 43% proficiency, ranked #62 of 73 in FL (top 85%) — families likely to look elsewhere, expect single-tenant / working-renter base with shorter leases.
- Zoned schools: Jesse Keen Elementary School (math 20% / reading 21%, grade F, #2,094 of 2,144 statewide, top 98%, 649 students, 67% FRL); Sleepy Hill Middle School (math 29% / reading 34%, grade F, #453 of 571 statewide, top 81%, 1,090 students, 66% FRL); Kathleen Senior High School (math 19% / reading 31%, grade F, #501 of 667 statewide, top 75%, 2,051 students, 59% FRL) — zoned schools at 64% FRL track the district average.
- Zoned-school proficiency averages 26% at this address vs 41% district-wide (-15 pts) — the specific schools serving this property underperform the Polk average; the district grade overstates school quality for this exact location.
- Market conditions: Rents soft (-0.2%/yr); 363 active listings in the ZIP; 7 comparable units currently listed for rent nearby; rentals leasing fast (median 12d on market — plan ~1-2 weeks tenant-placement turnaround); solid renter incomes; 10,384 units permitted in Polk County in 2024 (1,716 in 5+ unit buildings).
- This rent runs 40% of the median local income ($90k/yr) — at the standard rent-burdened threshold; future hikes will face affordability resistance.
Forward outlook
- Local home prices are declining (-3.0%/yr); year-one equity from $3k of loan paydown is wiped out by about $12k of value loss. Plan a longer hold.
- Polk County population projected at +33% by 2050 — long-run rental-demand tailwind backs the buy-and-hold thesis.
Negotiation context
- It's been on market 241 days — a 12% lower offer ($338k) is reasonable based on typical stale-listing flexibility.
- 4 sale attempts since 2y ago with the ask held roughly flat each time — persistent listings suggest the price (not the market) is what's stuck; bring a comps-based counter.
Risks & watch-outs
- Climate carrying-cost: severe wind risk, 99% chance of damaging wind over 30y; moderate wildfire risk; extreme-heat days projected 7→22/yr by 2055 (HVAC capex compounding) — expect insurance premiums to compound above CPI over the hold.
Questions for the listing agent
- It's been on market 241 days. Have you received any prior offers? Is the seller open to a 21% concession, seller financing, or rate buy-down credit?
- What does the HOA fee cover, when was the last increase, and are there any pending special assessments or reserve-fund shortfalls?
- Why hasn't it sold? Are there any deal-killer items the seller is aware of (foundation, flood, title, zoning, code violations)?
- Is there a deadline driving the sale (1031 exchange, divorce, estate, relocation)? That informs how much negotiation room exists.
- The area grade is low — what's the realistic commute time and amenity access for the typical tenant pool here? Any planned neighborhood developments (good or bad) we should know about?
- What's the average days-on-market for RENTAL listings here right now (not sales)? A rising rental-DOM trend means longer vacancies and softer asking-rent achievability than the comps imply.
- What's the recent tenant-quality profile in this submarket — average credit score on applications, eviction rate, late-payment / NSF rate, and stable-employment percentage? A property-management company in the area should have these aggregated.
- How much new for-sale + rental construction is in the pipeline within 1–3 miles? Heavy new supply typically softens prices + rents 12–24 months out; constrained supply supports both.
Investment metrics
- 1% rule
- 0.79% ✗
- Cap rate
- 6.42%
- Cash-on-cash
- 0.44%
- DSCR
- 1.02
- GRM
- 10.5
CMA / ARV
No comps found within radius.
Projected returns pro-forma
-3.0% appreciation · 0.0% rent growth · sell at horizon
- IRR
- -18.7%
- Equity multiple
- 0.36×
- Total profit
- $-68,757
- Equity at exit
- $57,256
- IRR
- -17.7%
- Equity multiple
- 0.15×
- Total profit
- $-91,572
- Equity at exit
- $33,201
Cash invested: $107,520 (down + closing). Projections, not guarantees.
Landlord ↔ Tenant lean methodology
- Overall (STATE)
- 87 Strongly Landlord-Friendly
- State Florida
- 87 Strongly Landlord-Friendly · R+3
- County
- — inherits STATE
- City
- — inherits STATE
ZIP-level market 33811
- Home prices YoY
- -26.2%
- Rents YoY
- -0.2%
- Active inventory
- 363
- Price-to-rent
- 10.5×
Monthly cashflow live
- Estimated rent
- $3,033 high interval (Pro) →
- Mortgage (P&I)
- −$2,014
- Tax from tax record
- −$77 /mo · $918/yr
- Insurance
- −$160
- HOA
- −$107
- Vacancy / Maint / Mgmt
- −$637
- Net cashflow
- $39
Break-even live
Sensitivity live
| Price | -10% $257 | -5% $148 | +0% $39 | +5% $-70 | +10% $-178 |
|---|---|---|---|---|---|
| Rent | -10% $-200 | -5% $-81 | +0% $39 | +5% $159 | +10% $279 |
| Rate | -1.0pp $233 | -0.5pp $137 | base $39 | +0.5pp $-60 | +1.0pp $-162 |
UW: 25.0% down · 7.5% · 30yr · 1.5% tax · 5.0% vac · 8.0% maint · 8.0% mgmt
Financing live
Cash to close
- Down payment
- $96,000
- Closing costs
- $11,520
- Reserves months
- —
- Total cash needed
- —
Loan-product check · same deal, 3 products live
Conventional
25% down · 7.5% · 30yr
- Down + closing
- —
- Monthly P&I
- —
- Monthly cashflow
- —
- DSCR
- —
- Eligible?
- —
Personal DTI + credit; lowest rate.
DSCR
20% down · 8.5% · 30yr
- Down + closing
- —
- Monthly P&I
- —
- Monthly cashflow
- —
- DSCR
- —
- Eligible?
- —
No personal income docs; deal must DSCR.
Hard money
10% down · 12.0% · 12mo
- Down + closing
- —
- Monthly P&I
- —
- Monthly cashflow
- —
- DSCR
- —
- Eligible?
- —
Short-term bridge; refi at stabilization.
Rent comps 7 comps
| Address | Beds | Baths | Sqft | Rent | $/sqft | DOM | Units | Dist |
|---|---|---|---|---|---|---|---|---|
| 2796 Grandbury Grove Rd Lakeland, FL | 4.0 | 2.0 | 1867 | $3,295 | $1.76 | 13d | 1 | 0.25mi |
| 3227 Bayou Bay Dr Lakeland, FL | 4.0 | 2.0 | 1872 | $2,600 | $1.39 | 5d | 1 | 0.41mi |
| 2127 Blue Highlands Dr Lakeland, FL | 4.0 | 2.0 | 1872 | $2,275 | $1.22 | 25d | 1 | 0.57mi |
| 3370 Cup Dr Unit 16 Lakeland, FL | 3.0 | 2.0 | 1837 | $2,975 | $1.62 | 5d | 1 | 1.07mi |
| 3442 Cup Dr Lakeland, FL | 3.0 | 2.0 | 1826 | $2,975 | $1.63 | 5d | 1 | 1.10mi |
| 3460 Cup Dr Unit 01 Lakeland, FL | 3.0 | 2.0 | 1837 | $2,864 | $1.56 | 12d | 1 | 1.11mi |
| 3372 Turnberry Ln Lakeland, FL | 3.0 | 3.0 | 2472 | $4,000 | $1.62 | 25d | 1 | 1.25mi |
HOA detail
- Monthly dues
- $107 · $1,284/yr
Listing history 24 events
-
2026-06-22days on market $384,000 Active 241 DOM
-
2026-06-18days on market $384,000 Active 238 DOM
-
2026-06-17days on market $384,000 Active 237 DOM
-
2026-06-16days on market $384,000 Active 236 DOM
-
2026-06-15days on market $384,000 Active 235 DOM
-
2026-06-13days on market $384,000 Active 233 DOM
-
2026-06-10days on market $384,000 Active 230 DOM
-
2026-06-09days on market $384,000 Active 229 DOM
-
2026-06-08days on market $384,000 Active 228 DOM
-
2026-06-07days on market $384,000 Active 227 DOM
-
2026-06-05days on market $384,000 Active 224 DOM
-
2026-06-03days on market $384,000 Active 222 DOM
-
2026-06-01days on market $384,000 Active 221 DOM
-
2026-05-31days on market $384,000 Active 220 DOM
-
2026-04-26price $384,000
-
2026-03-22status Active
-
2025-05-21status Active
-
2025-02-07$390,000 Active
-
2024-09-27historical
-
2024-08-30price $405,000
-
2024-08-02price $415,000
-
2024-07-01price $420,000
-
2024-06-18price $425,000
-
2024-06-11$429,000 Active
ⓘ Source: listings_history table (triggers on properties + properties_extension) + one-shot
backfill from property_details.listing_events for pre-trigger history.
Tax reassessment forecast FL · Resets to sale price
- Current annual tax
- $918 · $77/mo
- Projected year-2 tax
- $3,187 · $266/mo
- Expected delta
- +$2,269/yr (+$189/mo · 247.0%)
ⓘ Screening estimate from a state-policy table — verify with the county assessor before closing.
Climate risk First Street
- Flood 4/10 Moderate FEMA zone X (unshaded) · 20% chance over 30 yrs
- Wildfire 5/10 Major
- Heat 8/10 Severe 7 d/yr ≥108°F today · 22 d/yr by 30 yrs out
- Wind 9/10 Extreme 99% chance of damaging wind over 30 yrs
- Air quality 2/10 Low 1 unhealthy d/yr today · 2 by 30 yrs out
Nearby sold comps map
Loading sold comps map…
Walkable amenities ~0.75 mi
Loading nearby amenities…
Taxation est. · year 1
- Rental income
- $36,401
- − Mortgage interest
- −$21,510
- − Property taxes
- −$918
- − Insurance
- −$1,920
- − Repairs & maintenance
- −$2,912
- − Management
- −$2,912
- − HOA
- −$1,284
- − Depreciation
- −$11,171
- Taxable loss
- −$6,226
- Est. tax savings @ 24.0%
- +$1,494
- After-tax cash flow
- $1,964/yr
For passive investors: Depreciation is non-cash, so a rental often shows a tax loss while cash-flowing — sheltering income. Rental losses are passive: they offset passive income freely, and up to $25,000/yr can offset ordinary (W-2) income if you actively participate and your MAGI is under $100k (phasing out to $0 by $150k); unused losses carry forward. On sale, claimed depreciation is recaptured at up to 25%, and gains may owe capital-gains tax (a 1031 exchange can defer both). Figures are a year-1 estimate at your 24.0% rate — not tax advice; consult a CPA.
Schools (NCES district)
- District
- Polk
- NCES district ID
- 1201590
- Math proficiency
- 39% ▼ -11.00%
- Reading proficiency
- 43% ▼ -4.00%
- Median HH income
- $43,979
- Composite
- 34.74/100
- National rank
- #5132
- State rank
- #62 of 73 in FL
Livability — Lakeland
- Score
- 77/100
- State rank
- #206
- US rank
- #3179
Category grades
Schools grade is shown separately in the Schools card above.
Census & demographics
- Census place
- Lakeland, FL
- County
- Polk County · 740,051 people
- City population
- 277,690
- Metro
- Lakeland-Winter Haven, FL
- Population (ZIP)
- 29,472
- Household income
- $90,263
- Rent vs Own
- Severe rent burden
- 477.0
Population outlook (Polk County) Hauer SSP2
- Today (2025)
- 752,975 people
- By 2030
- 804,621 · +6.9%
- By 2040
- 906,117 · +20.3%
- By 2050
- 1,000,476 · +32.9%
- By 2075
- 1,197,520 · +59.0%
- By 2100
- 1,271,518 · +68.9%
Race, ethnicity, and origin ACS 2023
- Neighborhood character
- Majority White (63%)
- Race & ethnicity
- White 63% Hispanic / Latino 23% Two or more races 14% Black 8% Asian 1%
- Hispanic origin (detail)
- Mexican 6% Puerto Rican 5% Cuban 4%
- Common ancestry
- Italian 3% Lithuanian 2% Slovak 2%
- Foreign-born
- 8% · Canada, Jamaica
- Languages at home
- 83% English-only · Spanish 14% French/Haitian/Cajun 1% Tagalog/Filipino 1%
Political lean MEDSL · Polk
- 2024 margin
- Strong R (+20.7) · D 39.2% · R 59.9%
- 2008→2024 swing
- -14.6pp toward R · 2008: -6.1pp · 2024: -20.7pp
- All cycles
- 2024: R+20.7 2020: R+14.4 2016: R+14.1 2012: R+6.8 2008: R+6.1
Not yet ingested
- Civics
- —
Market trends
- HPI YoY
- ▼ -109.57%
- Current HPI
- 309.0061
- Rent YoY
- ▼ -0.19%
- Metro
- Lakeland-Winter Haven, FL
- State GDP YoY
- ▲ 3.28%
- F500 in state
- 36
Industry mix (Fortune 500 HQ in FL)
| Industry | F500 HQs | Revenue |
|---|---|---|
| Industrial Technology | 2 | $29B |
|
||
| Insurance | 2 | $17B |
|
||
| Retail | 1 | $60B |
|
||
| Technology Distribution | 1 | $58B |
|
||
| Homebuilding | 1 | $35B |
|
||
| Technology Manufacturing | 1 | $35B |
|
||
Price history
-10.5% since first listed10 events — show timeline
- 2026-04-26 Price Changed $384,000 Stellar MLS as Distributed by MLS Grid
- 2026-03-22 Relisted — Stellar MLS as Distributed by MLS Grid
- 2025-05-21 Relisted — Stellar MLS as Distributed by MLS Grid
- 2025-02-07 Listed $390,000 Stellar MLS as Distributed by MLS Grid
- 2024-09-27 Listing Removed — Stellar MLS as Distributed by MLS Grid
- 2024-08-30 Price Changed $405,000 Stellar MLS as Distributed by MLS Grid
- 2024-08-02 Price Changed $415,000 Stellar MLS as Distributed by MLS Grid
- 2024-07-01 Price Changed $420,000 Stellar MLS as Distributed by MLS Grid
- 2024-06-18 Price Changed $425,000 Stellar MLS as Distributed by MLS Grid
- 2024-06-11 Listed $429,000 Stellar MLS as Distributed by MLS Grid
Cash-flow waterfall
monthlySold comps — $/sqft
last 12 mo · ≤1 miLoading sold comps…