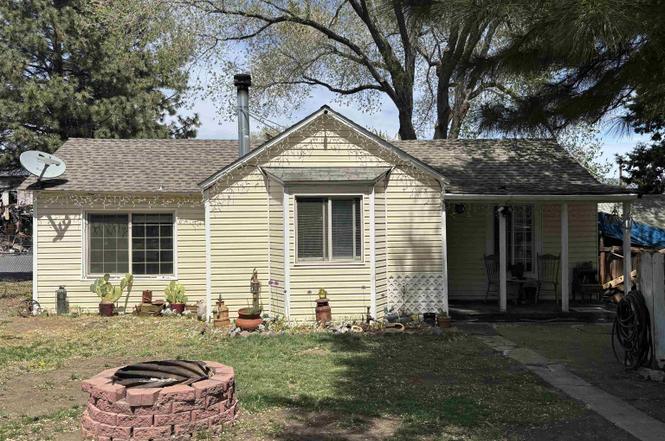
903 Cottage St · Susanville, CA
Flood risk 1/10 · Minimal
- FEMA flood zone
- X (unshaded)
- Chance of flooding over 30 yrs
- 0.0%
- Est. flood insurance / yr
- $507 – $1,088
Fire risk 8/10 · Major
- Est. fire insurance / yr
- $659 – $1,223
Heat risk 4/10 · Minor
- Hot days now (above 92°F)
- 9 days/yr
- Hot days in 30 yrs
- 21 days/yr
Wind risk 1/10 · Minimal
- Chance of severe wind over 30 yrs
- —
Air-quality risk 10/10 · Severe
- Unhealthy air days now
- 30 days/yr
- Unhealthy air days in 30 yrs
- 31 days/yr
Risk factors via First Street. Map © Google.
Why this score? — see what drove the B grade
The composite is a weighted blend of 9 inputs, each scored 0–100. Each bar is that input's sub-score; the figure is the points it added to the 100-point composite (weight × sub-score).
- Cash flow +30.0/30.0
- ARV discount +15.0/15.0
- DSCR +10.0/10.0
- 1% rule +8.7/10.0
- Livability +3.2/5.0
- Schools +2.6/10.0
- Rent growth +2.5/5.0
- Condition / age +2.5/5.0
- Appreciation +0.0/10.0
$98,900
🖨 Deal sheet 📄 Offer letter ✓ Due diligence
Listing remarks MLS
This is a nice investment property that boasts two bedroom two bathroom home and is located close to schools and shopping. Home has just has newer carpet and interior paint, as well as the hardwood floors stained. The master bedroom is on-suite style with a huge walk in shower that has multiple heads, plays music/answers phone calls and other features, master bedroom also has a walk in closet with custom shelving and plenty of storage space. The second bedroom features a loft and the closet has custom shelving as well. There is a bonus room on the home that can be used as an office. There is a storage shed and driveway area on the side of the property for off street parking ease
Key facts
- Wood stove
- Bonus room
- Quiet neighborhood
Tags
Property features AI
Exterior
- Security: Smoke detector(s)
- Utilities: Public water; Public sewer
- Home design: Single family residence; Residential property; R1 zoning
- Construction: Frame construction; Wood siding; Composition roof
- Exterior features: Covered patio/porch; Fenced yard; Corner lot
Interior
- Kitchen: Refrigerator
- Flooring: Hardwood
- Heating & cooling: Wood stove heating; Natural gas heating; Ceiling fan(s)
- Interior features: Walk-in closet(s); Insulated windows; Has fireplace (living room); Basement
- Laundry & utility: Dedicated laundry room
Neighborhood map
What this means for you Summary
Snapshot
- This is a 3-bed/1.0-bath single-family listed at $99k.
Deal economics
- At list price, monthly cash flow is $435 ($5k/yr) — positive.
- The deal already cash-flows at list — no discount required.
- Meets the 1% rule at list price ($1k rent vs $99k).
- Recommended offer: $93k (6.0% below list) — sets the bar for market timing.
- Cap rate 11.6% vs local median 3.8% in Susanville — top-decile yield for the area; either an underpriced asset or a hidden risk that comps aren't pricing in. Stress-test before assuming the spread holds.
Location & tenants
- Location reads 64/100 on livability (#421 in CA) — a middle-class / working-renter tenant base. Strengths: housing A+, commute A-, health & safety A-; Watch: schools F, crime F, amenities F.
- Susanville Elementary (town): math 27% / reading 32% proficiency, ranked #350 of 517 in CA (top 68%) — low school quality limits family demand, transient renter base, plan for 1-2y turnover.
- Market conditions: 236 active listings in the ZIP; 5 comparable units currently listed for rent nearby; rentals at typical pace (median 21d on market — plan ~3-4 weeks tenant-placement turnaround); 6 units permitted in Lassen County in 2024 (0 in 5+ unit buildings).
Forward outlook
- Local home prices are declining (-3.0%/yr); year-one equity from $684 of loan paydown is wiped out by about $3k of value loss. Plan a longer hold.
- Lassen County population projected at -14% by 2050 — secular population decline; favor cash flow + early exit over multi-decade hold.
- At projected returns (-3.0% appreciation + 3.0% rent growth), your $28k cash investment doubles in ~7 years — after that, you're playing with house money.
Negotiation context
- It's been on market 83 days — a 6% lower offer ($93k) is reasonable based on typical stale-listing flexibility.
- 2 sale attempts since 7y ago; this cycle's ask has dropped $13k (12%) from the opening price — seller is motivated, your offer sets the floor, not the list.
- Current owner paid $72k; 36% above their basis — modest negotiation headroom, anchor on the comps not their cost.
Risks & watch-outs
- Watch-outs: built in 1935 — expect roof / HVAC / electrical / plumbing capex.
- Climate carrying-cost: severe wildfire risk — expect insurance premiums to compound above CPI over the hold.
Questions for the listing agent
- It's been on market 83 days. Have you received any prior offers? Is the seller open to a 6% concession, seller financing, or rate buy-down credit?
- Built in 1935 — when were the roof, HVAC, electrical panel, plumbing, and water heater last replaced?
- Why hasn't it sold? Are there any deal-killer items the seller is aware of (foundation, flood, title, zoning, code violations)?
- Is there a deadline driving the sale (1031 exchange, divorce, estate, relocation)? That informs how much negotiation room exists.
- Schools are F-rated, which usually means shorter tenancies and higher turnover. Who's the typical renter profile here, and what's been the actual vacancy rate?
- Crime grade is F in this area — have there been break-ins, vandalism, or insurance claims at this property in the last 3 years? What carrier currently insures it and at what premium?
- What's the average days-on-market for RENTAL listings here right now (not sales)? A rising rental-DOM trend means longer vacancies and softer asking-rent achievability than the comps imply.
- What's the recent tenant-quality profile in this submarket — average credit score on applications, eviction rate, late-payment / NSF rate, and stable-employment percentage? A property-management company in the area should have these aggregated.
- How much new for-sale + rental construction is in the pipeline within 1–3 miles? Heavy new supply typically softens prices + rents 12–24 months out; constrained supply supports both.
Investment metrics
- 1% rule
- 1.37% ✓
- Cap rate
- 11.57%
- Cash-on-cash
- 18.85%
- DSCR
- 1.84
- GRM
- 6.1
CMA / ARV
- ARV (on-the-fly)
- $173,340
- Comps found
- 12
Show comp detail 12 sales within ~0.75 mi
| Address | Dist | Beds/Ba | Sqft | Sold | Price | $/sf | Match |
|---|---|---|---|---|---|---|---|
| 1500 Cornell St | 0.40mi | 2/1.0 (-1) | 1,066 (-0%) | 2mo | $140,000 | $131 | 74 |
| 449 Prospect Ave Ave | 0.38mi | 3/1.0 | 1,019 (-5%) | 3mo | $65,000 | $64 | 72 |
| 360 Adaline St | 0.40mi | 2/1.0 (-1) | 1,008 (-6%) | 2mo | $199,000 | $197 | 65 |
| 227 Maple St | 0.26mi | 3/2.0 | 1,200 (+12%) | 2mo | $226,000 | $188 | 62 |
| 85 Foss St | 0.34mi | 2/1.0 (-1) | 987 (-8%) | 7mo | $160,000 | $162 | 60 |
| 612 Willow St | 0.35mi | 2/1.5 (-1) | 975 (-9%) | 3mo | $107,000 | $110 | 59 |
| 220 Park Street St | 0.53mi | 2/1.0 (-1) | 1,008 (-6%) | 3mo | $179,000 | $178 | 58 |
| 1418 Fourth St | 0.52mi | 2/1.0 (-1) | 1,149 (+7%) | 4mo | $95,000 | $83 | 55 |
| 14 Upland St | 0.72mi | 3/1.5 | 1,146 (+7%) | 5mo | $139,000 | $121 | 49 |
| 330 Ash St | 0.63mi | 2/1.0 (-1) | 984 (-8%) | 5mo | $40,000 | $41 | 48 |
| 645 Juniper Street St | 0.51mi | 3/0.5 | 911 (-15%) | 3mo | $160,000 | $176 | 47 |
| 428 Alexander Avenue Ave | 0.51mi | 2/1.0 (-1) | 936 (-12%) | 8mo | $153,500 | $164 | 44 |
Match score weights: distance 35% · size 25% · config 20% · recency 20%. Top-matched comps best support the ARV.
Projected returns pro-forma
-3.0% appreciation · 3.0% rent growth · sell at horizon
- IRR
- 10.7%
- Equity multiple
- 1.42×
- Total profit
- $11,665
- Equity at exit
- $14,746
- IRR
- 19.7%
- Equity multiple
- 2.65×
- Total profit
- $45,787
- Equity at exit
- $8,551
Cash invested: $27,692 (down + closing). Projections, not guarantees.
Landlord ↔ Tenant lean methodology
- Overall (STATE)
- 18 Strongly Tenant-Friendly
- State California
- 18 Strongly Tenant-Friendly · D+13
- County
- — inherits STATE
- City
- — inherits STATE
ZIP-level market 96130
- Active inventory
- 236
- Price-to-rent
- 6.1×
Monthly cashflow live
- Estimated rent
- $1,353 high interval (Pro) →
- Mortgage (P&I)
- −$519
- Tax from tax record
- −$74 /mo · $886/yr
- Insurance
- −$41
- HOA
- −$0
- Vacancy / Maint / Mgmt
- −$284
- Net cashflow
- $435
Break-even live
UW: 25.0% down · 7.5% · 30yr · 1.5% tax · 5.0% vac · 8.0% maint · 8.0% mgmt
Financing live
Cash to close
- Down payment
- $24,725
- Closing costs
- $2,967
- Reserves months
- —
- Total cash needed
- —
Loan-product check · same deal, 3 products live
Conventional
25% down · 7.5% · 30yr
- Down + closing
- —
- Monthly P&I
- —
- Monthly cashflow
- —
- DSCR
- —
- Eligible?
- —
Personal DTI + credit; lowest rate.
DSCR
20% down · 8.5% · 30yr
- Down + closing
- —
- Monthly P&I
- —
- Monthly cashflow
- —
- DSCR
- —
- Eligible?
- —
No personal income docs; deal must DSCR.
Hard money
10% down · 12.0% · 12mo
- Down + closing
- —
- Monthly P&I
- —
- Monthly cashflow
- —
- DSCR
- —
- Eligible?
- —
Short-term bridge; refi at stabilization.
Rent comps 5 comps
| Address | Beds | Baths | Sqft | Rent | $/sqft | DOM | Units | Dist |
|---|---|---|---|---|---|---|---|---|
| 200 Carroll St Unit 18 Susanville, CA | 2.0 | 1.5 | 1100 | $1,400 | $1.27 | 21d | 1 | 0.15mi |
| 413 Pardee Ave Susanville, CA | 2.0 | 1.0 | 924 | $1,400 | $1.52 | 21d | 1 | 0.44mi |
| 525 Hall St Susanville, CA | 2.0 | 1.0 | 900 | $1,100 | $1.22 | 21d | 1 | 0.77mi |
| 55 S Sacramento St Susanville, CA | 2.0 | 2.0 | 1500 | $1,500 | $1.00 | 21d | 1 | 0.82mi |
| 1070 Paiute Ln Susanville, CA | 2.0 | 1.0 | 828 | $1,062 | $1.28 | 21d | 1 | 0.86mi |
Listing history 23 events
-
2026-06-19days on market $98,900 Active 83 DOM
-
2026-06-18days on market $98,900 Active 82 DOM
-
2026-06-17days on market $98,900 Active 81 DOM
-
2026-06-16days on market $98,900 Active 80 DOM
-
2026-06-15days on market $98,900 Active 79 DOM
-
2026-06-14days on market $98,900 Active 77 DOM
-
2026-06-12days on market $98,900 Active 76 DOM
-
2026-06-09days on market $98,900 Active 73 DOM
-
2026-06-08days on market $98,900 Active 72 DOM
-
2026-06-07days on market $98,900 Active 71 DOM
-
2026-06-07days on market $98,900 Active 70 DOM
-
2026-06-04days on market $98,900 Active 67 DOM
-
2026-06-03status $98,900 Active 66 DOM
-
2026-05-17status Pending
-
2026-04-27price $98,900
-
2026-03-12$112,000 Active
-
2025-08-17price $115,000
-
2025-07-18price $139,000
-
2019-02-26soldstatus $72,500 687-char remark
Show marketing remark (687 chars)
This is a nice investment property that boasts two bedroom two bathroom home and is located close to schools and shopping. Home has just has newer carpet and interior paint, as well as the hardwood floors stained. The master bedroom is on-suite style with a huge walk in shower that has multiple heads, plays music/answers phone calls and other features, master bedroom also has a walk in closet with custom shelving and plenty of storage space. The second bedroom features a loft and the closet has custom shelving as well. There is a bonus room on the home that can be used as an office. There is a storage shed and driveway area on the side of the property for off street parking ease
-
2019-02-26soldstatus $72,500
Show marketing remark (687 chars)
This is a nice investment property that boasts two bedroom two bathroom home and is located close to schools and shopping. Home has just has newer carpet and interior paint, as well as the hardwood floors stained. The master bedroom is on-suite style with a huge walk in shower that has multiple heads, plays music/answers phone calls and other features, master bedroom also has a walk in closet with custom shelving and plenty of storage space. The second bedroom features a loft and the closet has custom shelving as well. There is a bonus room on the home that can be used as an office. There is a storage shed and driveway area on the side of the property for off street parking ease
-
2019-01-28$75,000 687-char remark
Show marketing remark (687 chars)
This is a nice investment property that boasts two bedroom two bathroom home and is located close to schools and shopping. Home has just has newer carpet and interior paint, as well as the hardwood floors stained. The master bedroom is on-suite style with a huge walk in shower that has multiple heads, plays music/answers phone calls and other features, master bedroom also has a walk in closet with custom shelving and plenty of storage space. The second bedroom features a loft and the closet has custom shelving as well. There is a bonus room on the home that can be used as an office. There is a storage shed and driveway area on the side of the property for off street parking ease
-
2005-10-25soldstatus $90,000
-
1994-06-13soldstatus $37,500
ⓘ Source: listings_history table (triggers on properties + properties_extension) + one-shot
backfill from property_details.listing_events for pre-trigger history.
Tax reassessment forecast CA · Resets to sale price
- Current annual tax
- $886 · $74/mo
- Projected year-2 tax
- $886 · $74/mo
- Expected delta
- $0/yr ($0/mo · -0.0%)
ⓘ Screening estimate from a state-policy table — verify with the county assessor before closing.
Climate risk First Street
- Flood 1/10 Low FEMA zone X (unshaded) · 0% chance over 30 yrs
- Wildfire 8/10 Severe
- Heat 4/10 Moderate 9 d/yr ≥92°F today · 21 d/yr by 30 yrs out
- Wind 1/10 Low
- Air quality 10/10 Extreme 30 unhealthy d/yr today · 31 by 30 yrs out
Nearby sold comps map
Loading sold comps map…
Walkable amenities ~0.75 mi
Loading nearby amenities…
Taxation est. · year 1
- Rental income
- $16,233
- − Mortgage interest
- −$5,540
- − Property taxes
- −$886
- − Insurance
- −$494
- − Repairs & maintenance
- −$1,299
- − Management
- −$1,299
- − Depreciation
- −$2,877
- Taxable income
- $3,838
- Est. tax owed @ 24.0%
- −$921
- After-tax cash flow
- $4,298/yr
For passive investors: Depreciation is non-cash, so a rental often shows a tax loss while cash-flowing — sheltering income. Rental losses are passive: they offset passive income freely, and up to $25,000/yr can offset ordinary (W-2) income if you actively participate and your MAGI is under $100k (phasing out to $0 by $150k); unused losses carry forward. On sale, claimed depreciation is recaptured at up to 25%, and gains may owe capital-gains tax (a 1031 exchange can defer both). Figures are a year-1 estimate at your 24.0% rate — not tax advice; consult a CPA.
Schools (NCES district)
- District
- Susanville Elementary
- NCES district ID
- 0638550
- Math proficiency
- 27% ▼ -6.00%
- Reading proficiency
- 32% ▬ 0.00%
- Median HH income
- $49,068
- Composite
- 25.69/100
- National rank
- #7387
- State rank
- #350 of 517 in CA
Livability — Susanville
- Score
- 64/100
- State rank
- #421
- US rank
- #14210
Category grades
Schools grade is shown separately in the Schools card above.
Census & demographics
- Census place
- Susanville, CA
- Population (ZIP)
- 20,892
Population outlook (Lassen County) Hauer SSP2
- Today (2025)
- 27,112 people
- By 2030
- 26,732 · -1.4%
- By 2040
- 25,536 · -5.8%
- By 2050
- 23,262 · -14.2%
- By 2075
- 18,620 · -31.3%
- By 2100
- 14,679 · -45.9%
Race, ethnicity, and origin ACS 2023
- Neighborhood character
- Diverse neighborhood (Simpson 0.60)
- Race & ethnicity
- White 57% Hispanic / Latino 26% Two or more races 17% Black 9% Native American 2% Pacific Islander 1% Asian 1%
- Hispanic origin (detail)
- Mexican 23%
- Common ancestry
- Iranian 2% Lithuanian 2% Slovak 2%
- Foreign-born
- 5% · Canada
- Languages at home
- 80% English-only · Spanish 16% Other Asian/Pacific 1% Other Indo-European 1%
Political lean MEDSL · Lassen
- 2024 margin
- Solid R (+54.0) · D 21.8% · R 75.8% · Other 2.4%
- 2008→2024 swing
- -19.8pp toward R · 2008: -34.2pp · 2024: -54.0pp
- All cycles
- 2024: R+54.0 2020: R+51.5 2016: R+51.3 2012: R+39.8 2008: R+34.2
Not yet ingested
- Civics
- —
Market trends
- HPI YoY
- ▼ -126.12%
- Current HPI
- 136.1585
- Rent YoY
- —
- Metro
- —
- State GDP YoY
- ▲ 3.21%
- F500 in state
- 116
Industry mix (Fortune 500 HQ in CA)
| Industry | F500 HQs | Revenue |
|---|---|---|
| Technology | 27 | $1,492B |
|
||
| Financial Services | 3 | $174B |
|
||
| Retail | 3 | $44B |
|
||
| Insurance | 3 | $26B |
|
||
| Media / Entertainment | 2 | $115B |
|
||
| Pharmaceuticals / Biotech | 2 | $62B |
|
||
Price history
+163.7% since first listed10 events — show timeline
- 2026-05-17 Pending — LAORMLS
- 2026-04-27 Price Changed $98,900 LAORMLS
- 2026-03-12 Listed $112,000 LAORMLS
- 2025-08-17 Price Changed $115,000 LAORMLS
- 2025-07-18 Price Changed $139,000 LAORMLS
- 2019-02-26 Sold (Public Records) $72,500 Public Records
- 2019-02-26 Sold (MLS) $72,500 LAORMLS
- 2019-01-28 Listed $75,000 LAORMLS
- 2005-10-25 Sold (Public Records) $90,000 Public Records
- 1994-06-13 Sold (Public Records) $37,500 Public Records
Property tax history
-1.7%/yrLatest (2025): $886 · +2.1% YoY. Source: county tax records.
Cash-flow waterfall
monthlySold comps — $/sqft
last 12 mo · ≤1 miLoading sold comps…