 🏷️ Likely Rental
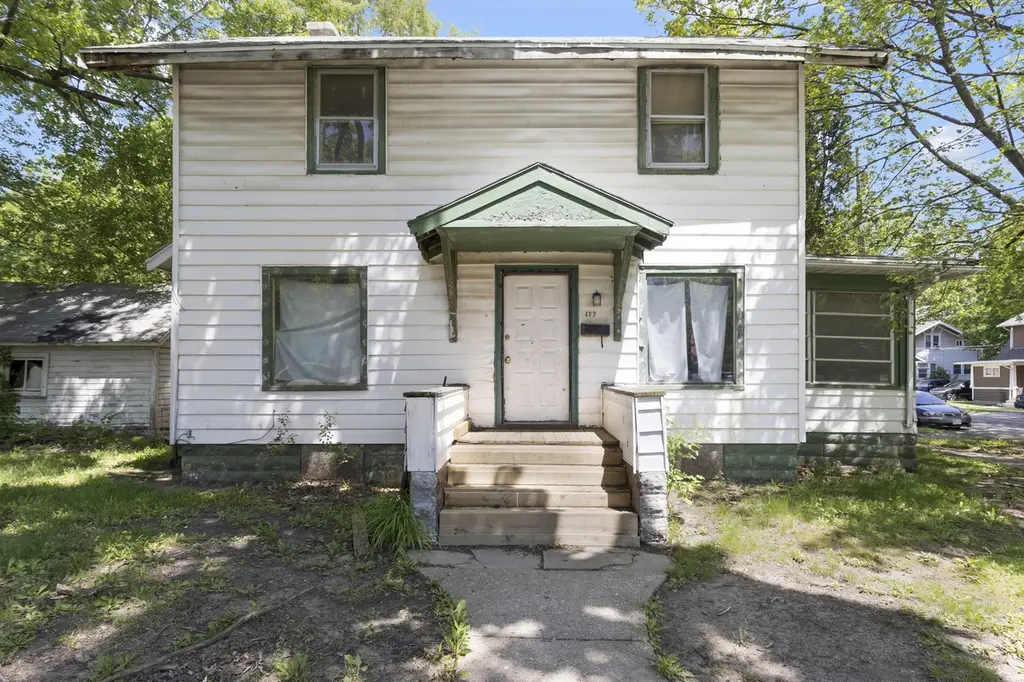
402 Royal Ave · Rockford, IL
Flood risk 1/10 · Minimal
- FEMA flood zone
- X (unshaded)
- Chance of flooding over 30 yrs
- 0.0%
- Est. flood insurance / yr
- $473 – $860
Fire risk 1/10 · Minimal
- Est. fire insurance / yr
- $804 – $1,492
Heat risk 2/10 · Minimal
- Hot days now (above 102°F)
- 7 days/yr
- Hot days in 30 yrs
- 15 days/yr
Wind risk 2/10 · Minimal
- Chance of severe wind over 30 yrs
- —
Air-quality risk 2/10 · Minimal
- Unhealthy air days now
- 1 days/yr
- Unhealthy air days in 30 yrs
- 2 days/yr
Risk factors via First Street. Map © Google.
Why this score? — see what drove the B grade
The composite is a weighted blend of 9 inputs, each scored 0–100. Each bar is that input's sub-score; the figure is the points it added to the 100-point composite (weight × sub-score).
- Cash flow +30.0/30.0
- ARV discount +15.0/15.0
- 1% rule +10.0/10.0
- DSCR +10.0/10.0
- Livability +3.1/5.0
- Rent growth +2.5/5.0
- Condition / age +2.5/5.0
- Schools +1.2/10.0
- Appreciation +0.0/10.0
$60,000
🖨 Deal sheet 📄 Offer letter ✓ Due diligence
Listing remarks MLS
Tenant-occupied 2-story home offering a great opportunity to add to your rental portfolio! This property features 3 bedrooms, 1 bathroom, a spacious living and family room. Sold as-is, no FHA/VA
Key facts
- 4,792 sq ft lot
- Built 1920
- Listed 12 days
Property features AI
Finance
- Other: Ownership: Fee simple
- HOA & community: No master association fee required
Exterior
- Utilities: Public water; Public sewer
- Home design: Detached single-family home; 2-story
- Construction: Aluminum siding; Property over 100 years old; Built before 1978
- Exterior features: 50 x 100 lot; Lot less than 0.25 acre; Currently leased
Interior
- Kitchen: Kitchen on main level (7 x 7)
- Bedrooms: 3 bedrooms (Master: second level, 12 x 13; Bedroom: second level, 10 x 11; Bedroom: second level, 10 x 10)
- Bathrooms: 1 full bathroom
- Heating & cooling: Forced air heating
- Interior features: Six total rooms; Unfinished full basement
- Laundry & utility: Laundry room
Neighborhood map
What this means for you Summary
Snapshot
- This is a 3-bed/1.0-bath single-family listed at $60k.
Deal economics
- At list price, monthly cash flow is $727 ($9k/yr) — positive.
- The deal already cash-flows at list — no discount required.
- Meets the 1% rule at list price ($1k rent vs $60k).
- Cap rate 20.8% vs local median 6.1% in Rockford — top-decile yield for the area; either an underpriced asset or a hidden risk that comps aren't pricing in. Stress-test before assuming the spread holds.
Location & tenants
- Location reads 62/100 on livability (#876 in IL) — a middle-class / working-renter tenant base. Strengths: cost of living A+, housing A+, health & safety A+; Watch: schools F, crime F, amenities F.
- Rockford SD 205 (urban): math 12% / reading 16% proficiency, ranked #533 of 620 in IL (top 86%) — low school quality limits family demand, transient renter base, plan for 1-2y turnover; 73% free/reduced lunch — lower-income household profile, screen leases tightly.
- Market conditions: 76 active listings in the ZIP; 23 comparable units currently listed for rent nearby; rentals lingering (median 44d on market — plan ~5-8 weeks vacancy on turnover, expect pricing pressure); 52% of comp listings sitting > 30 days — soft ceiling on asking rent; 285 units permitted in Winnebago County in 2024 (0 in 5+ unit buildings).
- This rent runs 38% of the median local income ($46k/yr) — at the standard rent-burdened threshold; future hikes will face affordability resistance.
Forward outlook
- Local home prices are declining (-3.0%/yr); year-one equity from $415 of loan paydown is wiped out by about $2k of value loss. Plan a longer hold.
- Winnebago County population projected at -20% by 2050 — secular population decline; favor cash flow + early exit over multi-decade hold.
- At projected returns (-3.0% appreciation + 3.0% rent growth), your $17k cash investment doubles in ~3 years — after that, you're playing with house money.
Negotiation context
- Only 13 days on market — expect competitive offers; lowballing is unlikely to land.
- 2 sale attempts with the ask held roughly flat each time — persistent listings suggest the price (not the market) is what's stuck; bring a comps-based counter.
- Current owner paid $18k; list at $60k implies a 233% gain — meaningful room to come down on a strong offer.
Risks & watch-outs
- Watch-outs: built in 1920 — expect roof / HVAC / electrical / plumbing capex.
Questions for the listing agent
- Built in 1920 — when were the roof, HVAC, electrical panel, plumbing, and water heater last replaced?
- Is there a deadline driving the sale (1031 exchange, divorce, estate, relocation)? That informs how much negotiation room exists.
- Schools are F-rated, which usually means shorter tenancies and higher turnover. Who's the typical renter profile here, and what's been the actual vacancy rate?
- Crime grade is F in this area — have there been break-ins, vandalism, or insurance claims at this property in the last 3 years? What carrier currently insures it and at what premium?
- What's the average days-on-market for RENTAL listings here right now (not sales)? A rising rental-DOM trend means longer vacancies and softer asking-rent achievability than the comps imply.
- What's the recent tenant-quality profile in this submarket — average credit score on applications, eviction rate, late-payment / NSF rate, and stable-employment percentage? A property-management company in the area should have these aggregated.
- How much new for-sale + rental construction is in the pipeline within 1–3 miles? Heavy new supply typically softens prices + rents 12–24 months out; constrained supply supports both.
Investment metrics
- 1% rule
- 2.44% ✓
- Cap rate
- 20.82%
- Cash-on-cash
- 51.89%
- DSCR
- 3.31
- GRM
- 3.4
CMA / ARV
- ARV (on-the-fly)
- $110,755
- Comps found
- 12
Show comp detail 12 sales within ~0.75 mi
| Address | Dist | Beds/Ba | Sqft | Sold | Price | $/sf | Match |
|---|---|---|---|---|---|---|---|
| 425 Albert Ave | 0.10mi | 3/1.0 | 1,232 (-5%) | 0mo | $50,000 | $41 | 86 |
| 707 Royal Ave | 0.23mi | 3/1.0 | 1,279 (-2%) | 1mo | $87,000 | $68 | 85 |
| 2001 School St | 0.10mi | 4/1.0 (+1) | 1,376 (+6%) | 2mo | $117,000 | $85 | 79 |
| 2118 Elm St | 0.33mi | 3/2.0 | 1,352 (+4%) | 2mo | $150,000 | $111 | 72 |
| 319 Foster Ave | 0.45mi | 4/1.5 (+1) | 1,264 (-3%) | 2mo | $170,000 | $134 | 66 |
| 2111 Sherman Ave | 0.38mi | 3/2.0 | 1,371 (+5%) | 5mo | $56,898 | $42 | 65 |
| 410 Oakley Ave | 0.31mi | 3/1.0 | 1,440 (+10%) | 5mo | $105,000 | $73 | 64 |
| 617 N Central Ave | 0.33mi | 4/1.0 (+1) | 1,164 (-11%) | 3mo | $75,000 | $64 | 60 |
| 204 Willard Ave | 0.59mi | 3/1.0 | 1,209 (-7%) | 2mo | $130,000 | $108 | 59 |
| 4310 Wilshire Ave | 0.66mi | 3/1.0 | 1,220 (-6%) | 2mo | $120,000 | $98 | 57 |
| 417 Oakley Ave | 0.33mi | 4/2.0 (+1) | 1,456 (+12%) | 0mo | $38,000 | $26 | 56 |
| 1425 Green St | 0.66mi | 3/1.5 | 1,188 (-9%) | 2mo | $105,000 | $88 | 51 |
Match score weights: distance 35% · size 25% · config 20% · recency 20%. Top-matched comps best support the ARV.
Projected returns pro-forma
-3.0% appreciation · 3.0% rent growth · sell at horizon
- IRR
- 49.8%
- Equity multiple
- 3.18×
- Total profit
- $36,582
- Equity at exit
- $8,946
- IRR
- 55.3%
- Equity multiple
- 6.45×
- Total profit
- $91,570
- Equity at exit
- $5,188
Cash invested: $16,800 (down + closing). Projections, not guarantees.
Landlord ↔ Tenant lean methodology
- Overall (STATE)
- 43 Moderately Tenant-Leaning
- State Illinois
- 43 Moderately Tenant-Leaning · D+7
- County
- — inherits STATE
- City
- — inherits STATE
ZIP-level market 61101
- Home prices YoY
- -25.4%
- Active inventory
- 76
- Price-to-rent
- 3.4×
Monthly cashflow live
- Estimated rent
- $1,465 high interval (Pro) →
- Mortgage (P&I)
- −$315
- Tax from tax record
- −$92 /mo · $1,098/yr
- Insurance
- −$25
- HOA
- −$0
- Vacancy / Maint / Mgmt
- −$308
- Net cashflow
- $727
Break-even live
UW: 25.0% down · 7.5% · 30yr · 1.5% tax · 5.0% vac · 8.0% maint · 8.0% mgmt
Financing live
Cash to close
- Down payment
- $15,000
- Closing costs
- $1,800
- Reserves months
- —
- Total cash needed
- —
Loan-product check · same deal, 3 products live
Conventional
25% down · 7.5% · 30yr
- Down + closing
- —
- Monthly P&I
- —
- Monthly cashflow
- —
- DSCR
- —
- Eligible?
- —
Personal DTI + credit; lowest rate.
DSCR
20% down · 8.5% · 30yr
- Down + closing
- —
- Monthly P&I
- —
- Monthly cashflow
- —
- DSCR
- —
- Eligible?
- —
No personal income docs; deal must DSCR.
Hard money
10% down · 12.0% · 12mo
- Down + closing
- —
- Monthly P&I
- —
- Monthly cashflow
- —
- DSCR
- —
- Eligible?
- —
Short-term bridge; refi at stabilization.
Rent comps 23 comps
| Address | Beds | Baths | Sqft | Rent | $/sqft | DOM | Units | Dist |
|---|---|---|---|---|---|---|---|---|
| 2011 School St Rockford, IL | 3.0 | 1.0 | 950 | $1,500 | $1.58 | 43d | 1 | 0.10mi |
| 2222 Andrews St Rockford, IL | 4.0 | 1.0 | 1400 | $1,600 | $1.14 | 13d | 1 | 0.11mi |
| 2305 School St Unit 2305-7 Rockford, IL | 2.0 | 1.0 | 875 | $995 | $1.14 | 43d | 1 | 0.16mi |
| 207 N Central Ave Rockford, IL | 4.0 | 1.5 | 1296 | $1,500 | $1.16 | 13d | 1 | 0.31mi |
| 2403 Elm St Rockford, IL | 2.0 | 1.0 | 1373 | $1,400 | $1.02 | 43d | 1 | 0.35mi |
| 2403 Elm St Rockford, IL | 2.0 | 1.0 | 1373 | $1,400 | $1.02 | 13d | 1 | 0.35mi |
| 1510 School St Unit 1 Rockford, IL | 3.0 | 1.5 | 1400 | $1,200 | $0.86 | 43d | 1 | 0.36mi |
| 418 Orchard Park Rockford, IL | 3.0 | 1.0 | 1232 | $1,500 | $1.22 | 13d | 1 | 0.43mi |
| 2315 Green St Rockford, IL | 3.0 | 1.0 | 1290 | $1,600 | $1.24 | 43d | 1 | 0.47mi |
| 1826 Green St Rockford, IL | 2.0 | 1.0 | 1000 | $1,300 | $1.30 | 21d | 1 | 0.49mi |
| 2916 School St Rockford, IL | 3.0 | 1.5 | 1578 | $2,400 | $1.52 | 43d | 1 | 0.55mi |
| 901 N Horace Ave Rockford, IL | 3.0 | 2.0 | 1400 | $1,700 | $1.21 | 13d | 1 | 0.59mi |
| 3016 School St Rockford, IL | 4.0 | 1.0 | 1090 | $1,400 | $1.28 | 43d | 1 | 0.61mi |
| 912 Furman St Rockford, IL | 2.0 | 1.0 | 1000 | $1,300 | $1.30 | 13d | 1 | 0.61mi |
| 303 Forest Ave Rockford, IL | 4.0 | 1.0 | 1568 | $1,800 | $1.15 | 43d | 1 | 0.61mi |
| 1146 Fairview Ave Rockford, IL | 4.0 | 1.5 | 1344 | $1,250 | $0.93 | 21d | 1 | 0.68mi |
| 1617 Vermont St Rockford, IL | 2.0 | 1.0 | 1375 | $1,325 | $0.96 | 43d | 1 | 0.92mi |
| 1614 Pauline Ave Rockford, IL | 2.0 | 1.0 | 956 | $1,400 | $1.46 | 43d | 1 | 1.21mi |
| 3834 Preston St Rockford, IL | 3.0 | 1.0 | 912 | $1,300 | $1.43 | 13d | 1 | 1.30mi |
| 2330 Kilburn Ave Rockford, IL | 2.0–3.0 | 1.0–2.0 | 950 | $1,199 | $1.26 | 13d | 1 | 1.32mi |
| 2422 Benderwirt Ave Unit 2422-1 Rockford, IL | 2.0 | 1.0 | 1150 | $1,025 | $0.89 | 43d | 1 | 1.37mi |
| 728 N Winnebago St Rockford, IL | 4.0 | 1.0 | 1250 | $1,600 | $1.28 | 13d | 1 | 1.38mi |
| 1413 La Belle Ave Rockford, IL | 2.0 | 1.0 | 900 | $1,200 | $1.33 | 43d | 1 | 1.46mi |
Listing history 13 events
-
2026-06-19days on market $60,000 Active 13 DOM
-
2026-06-18days on market $60,000 Active 12 DOM
-
2026-06-17days on market $60,000 Active 11 DOM
-
2026-06-16days on market $60,000 Active 10 DOM
-
2026-06-15days on market $60,000 Active 9 DOM
-
2026-06-14days on market $60,000 Active 7 DOM
-
2026-06-13days on market $60,000 Active 6 DOM
-
2026-06-10days on market $60,000 Active 4 DOM
-
2026-06-09days on market $60,000 Active 3 DOM
-
2026-06-09$60,000 Active 2 DOM
-
2026-06-08days on market $60,000 Active 2 DOM
-
2026-06-07remarks 194-char remark
-
2026-06-07$60,000 Active 1 DOM
ⓘ Source: listings_history table (triggers on properties + properties_extension) + one-shot
backfill from property_details.listing_events for pre-trigger history.
Tax reassessment forecast IL · Partial reset (capped growth)
- Current annual tax
- $1,098 · $92/mo
- Projected year-2 tax
- $1,230 · $103/mo
- Expected delta
- +$132/yr (+$11/mo · 12.0%)
ⓘ Screening estimate from a state-policy table — verify with the county assessor before closing.
Climate risk First Street
- Flood 1/10 Low FEMA zone X (unshaded) · 0% chance over 30 yrs
- Wildfire 1/10 Low
- Heat 2/10 Low 7 d/yr ≥102°F today · 15 d/yr by 30 yrs out
- Wind 2/10 Low
- Air quality 2/10 Low 1 unhealthy d/yr today · 2 by 30 yrs out
Nearby sold comps map
Loading sold comps map…
Walkable amenities ~0.75 mi
Loading nearby amenities…
Taxation est. · year 1
- Rental income
- $17,586
- − Mortgage interest
- −$3,361
- − Property taxes
- −$1,098
- − Insurance
- −$300
- − Repairs & maintenance
- −$1,407
- − Management
- −$1,407
- − Depreciation
- −$1,745
- Taxable income
- $8,267
- Est. tax owed @ 24.0%
- −$1,984
- After-tax cash flow
- $6,734/yr
For passive investors: Depreciation is non-cash, so a rental often shows a tax loss while cash-flowing — sheltering income. Rental losses are passive: they offset passive income freely, and up to $25,000/yr can offset ordinary (W-2) income if you actively participate and your MAGI is under $100k (phasing out to $0 by $150k); unused losses carry forward. On sale, claimed depreciation is recaptured at up to 25%, and gains may owe capital-gains tax (a 1031 exchange can defer both). Figures are a year-1 estimate at your 24.0% rate — not tax advice; consult a CPA.
Schools (NCES district)
- District
- Rockford SD 205
- NCES district ID
- 1734510
- Math proficiency
- 12% ▼ -2.00%
- Reading proficiency
- 16% ▼ -3.00%
- Median HH income
- $42,533
- Composite
- 12.21/100
- National rank
- #9649
- State rank
- #533 of 620 in IL
Livability — Rockford
- Score
- 62/100
- State rank
- #876
- US rank
- #17035
Category grades
Schools grade is shown separately in the Schools card above.
Census & demographics
- Census place
- Rockford, IL
- County
- Winnebago County · 147,297 people
- City population
- 147,297
- Metro
- Rockford, IL
- Population (ZIP)
- 19,318
- Household income
- $46,163
- Rent vs Own
- Severe rent burden
- 1170.0
Population outlook (Winnebago County) Hauer SSP2
- Today (2025)
- 271,080 people
- By 2030
- 260,684 · -3.8%
- By 2040
- 238,405 · -12.1%
- By 2050
- 216,129 · -20.3%
- By 2075
- 172,882 · -36.2%
- By 2100
- 135,336 · -50.1%
Race, ethnicity, and origin ACS 2023
- Neighborhood character
- Diverse neighborhood (Simpson 0.66)
- Race & ethnicity
- White 44% Black 34% Hispanic / Latino 16% Two or more races 8% Asian 1%
- Hispanic origin (detail)
- Mexican 14% Puerto Rican 1%
- Common ancestry
- Romanian 3% Italian 2% Portuguese 2%
- Foreign-born
- 9% · Canada
- Languages at home
- 84% English-only · Spanish 13% Other Indo-European 1% Russian/Polish/Slavic 1%
Political lean MEDSL · Winnebago
- 2024 margin
- Toss-up / Even · D 49.5% · R 49.0% · Other 1.5%
- 2008→2024 swing
- -12.2pp toward R · 2008: 12.8pp · 2024: 0.6pp
- All cycles
- 2024: D+0.6 2020: D+2.5 2016: R+1.2 2012: D+5.7 2008: D+12.8
Not yet ingested
- Civics
- —
Market trends
- HPI YoY
- ▼ -69.58%
- Current HPI
- 204.8946
- Rent YoY
- —
- Metro
- Rockford, IL
- State GDP YoY
- ▲ 1.59%
- F500 in state
- 60
Industry mix (Fortune 500 HQ in IL)
| Industry | F500 HQs | Revenue |
|---|---|---|
| Insurance | 4 | $201B |
|
||
| Consumer Goods | 4 | $87B |
|
||
| Industrial Machinery | 3 | $64B |
|
||
| Healthcare | 2 | $55B |
|
||
| Retail / Pharmacy | 1 | $148B |
|
||
| Agriculture / Food | 1 | $86B |
|
||
Price history
+140.0% since first listed4 events — show timeline
- 2026-06-06 Listed $60,000 MRED as Distributed by MLS Grid
- 2026-06-05 Listed $60,000 NWIAR
- 2001-10-04 Sold (Public Records) $18,000 Public Records
- 1998-04-20 Sold (Public Records) $25,000 Public Records
Property tax history
-2.1%/yrLatest (2025): $1,098 · +77.4% YoY. Source: county tax records.
Cash-flow waterfall
monthlySold comps — $/sqft
last 12 mo · ≤1 miLoading sold comps…