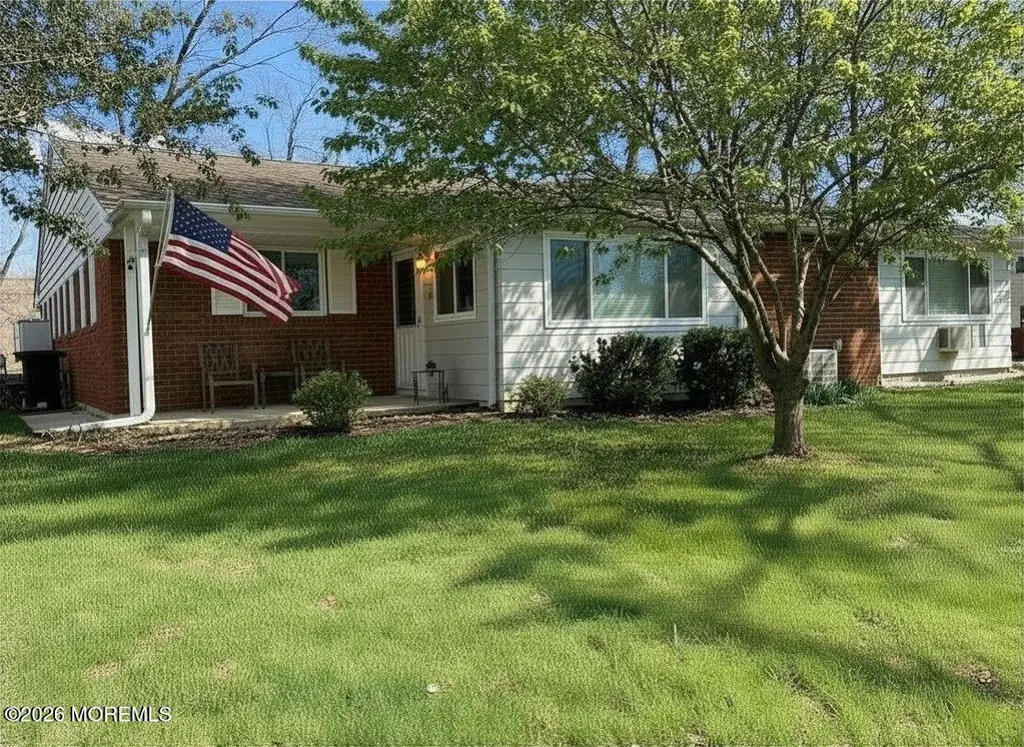
16 B Dove St · Cedar Glen West, NJ
Flood risk 1/10 · Minimal
- FEMA flood zone
- X (unshaded)
- Chance of flooding over 30 yrs
- 0.0%
- Est. flood insurance / yr
- $507 – $1,088
Fire risk 5/10 · Moderate
- Est. fire insurance / yr
- $526 – $976
Heat risk 6/10 · Moderate
- Hot days now (above 103°F)
- 7 days/yr
- Hot days in 30 yrs
- 15 days/yr
Wind risk 6/10 · Moderate
- Chance of severe wind over 30 yrs
- 57.0%
Air-quality risk 3/10 · Minor
- Unhealthy air days now
- 3 days/yr
- Unhealthy air days in 30 yrs
- 4 days/yr
Risk factors via First Street. Map © Google.
Why this score? — see what drove the B+ grade
The composite is a weighted blend of 9 inputs, each scored 0–100. Each bar is that input's sub-score; the figure is the points it added to the 100-point composite (weight × sub-score).
- Cash flow +30.0/30.0
- ARV discount +14.1/15.0
- 1% rule +10.0/10.0
- DSCR +10.0/10.0
- Livability +3.3/5.0
- Schools +2.9/10.0
- Condition / age +2.8/5.0
- Rent growth +2.5/5.0
- Appreciation +0.0/10.0
$79,000
🖨 Deal sheet 📄 Offer letter ✓ Due diligence
Listing remarks MLS
Cedar Glen West Co-Op 55+Charming 1 bed, 1 bath home in desirable Cedar Glen West. Features Updated Kitchen with Granite Counter Tops Stainless Steel Appliances with a Dishwasher and Luxury Vinyl Plank Flooring. Upgraded windows, central A/C, Hardwood Floors Throughout, Gas Heat and Gas Cooking also upgraded shower stall with Sliding Shower Doors. Enjoy the Community Recreation Hall with shuffleboard, pool table, card table, and a library. Community bus service available for added convenience. HOA fee covers property taxes, water, sewer, lawn maintenance, and snow removal also repair or replace hot water and heating, roof and gutters. Just a short drive to Atlantic City for beaches, dining, and entertainment. Photo/Grass Enhanced
Key facts
- Parking
- Built 1968
- Listed 35 days
Neighborhood map
What this means for you Summary
Snapshot
- This is a 1-bed/1.0-bath single-family listed at $79k. Condition is rated average.
Deal economics
- At list price, monthly cash flow is $325 ($4k/yr) — positive.
- The deal already cash-flows at list — no discount required.
- Meets the 1% rule at list price ($2k rent vs $79k).
- Recommended offer: $77k (3.0% below list) — sets the bar for market timing.
- Cap rate 11.2% vs local median 3.8% in Cedar Glen West — top-decile yield for the area; either an underpriced asset or a hidden risk that comps aren't pricing in. Stress-test before assuming the spread holds.
Location & tenants
- Location reads 66/100 on livability (#366 in NJ) — a middle-class / working-renter tenant base. Strengths: crime A+, cost of living A+, housing A+; Watch: schools F, amenities F, commute F.
- Manchester Township School District (suburban): math 25% / reading 44% proficiency, ranked #320 of 472 in NJ (top 68%) — families likely to look elsewhere, expect single-tenant / working-renter base with shorter leases.
- Market conditions: 648 active listings in the ZIP; 4,434 units permitted in Ocean County in 2024 (868 in 5+ unit buildings).
Forward outlook
- Local home prices are declining (-3.0%/yr); year-one equity from $546 of loan paydown is wiped out by about $2k of value loss. Plan a longer hold.
- Ocean County population projected to shrink 8% by 2050 — rents likely to lag national; underwrite the cash flow, not the appreciation.
- At projected returns (-3.0% appreciation + 3.0% rent growth), your $22k cash investment doubles in ~7 years — after that, you're playing with house money.
Negotiation context
- It's been on market 35 days — a 3% lower offer ($77k) is reasonable based on typical stale-listing flexibility.
Risks & watch-outs
- Watch-outs: HOA is 28% of rent.
- Climate carrying-cost: major wind risk, 57% chance of damaging wind over 30y; moderate wildfire risk; extreme-heat days projected 7→15/yr by 2055 (HVAC capex compounding) — expect insurance premiums to compound above CPI over the hold.
Questions for the listing agent
- It's been on market 35 days. Have you received any prior offers? Is the seller open to a 3% concession, seller financing, or rate buy-down credit?
- Built in 1968 — when were the roof, HVAC, electrical panel, plumbing, and water heater last replaced?
- What does the HOA fee cover, when was the last increase, and are there any pending special assessments or reserve-fund shortfalls?
- Is there a deadline driving the sale (1031 exchange, divorce, estate, relocation)? That informs how much negotiation room exists.
- Schools are F-rated, which usually means shorter tenancies and higher turnover. Who's the typical renter profile here, and what's been the actual vacancy rate?
- What's the average days-on-market for RENTAL listings here right now (not sales)? A rising rental-DOM trend means longer vacancies and softer asking-rent achievability than the comps imply.
- What's the recent tenant-quality profile in this submarket — average credit score on applications, eviction rate, late-payment / NSF rate, and stable-employment percentage? A property-management company in the area should have these aggregated.
- How much new for-sale + rental construction is in the pipeline within 1–3 miles? Heavy new supply typically softens prices + rents 12–24 months out; constrained supply supports both.
Investment metrics
- 1% rule
- 2.15% ✓
- Cap rate
- 11.24%
- Cash-on-cash
- 17.65%
- DSCR
- 1.79
- GRM
- 3.9
CMA / ARV
- ARV (median comp)
- $92,654
- List price
- $79,000
- Delta
- -14.74%
- Verdict
- UNDERPRICED
- Comps
- 20 within 1.0 mi
Show comp detail 12 sales within ~0.75 mi
| Address | Dist | Beds/Ba | Sqft | Sold | Price | $/sf | Match |
|---|---|---|---|---|---|---|---|
| 16 B Dove St | 0.00mi | 1/1.0 | 970 (0%) | 0mo | $73,000 | $75 | 100 |
| 18 Dove St Unit A | 0.00mi | 1/1.0 | 970 (0%) | 6mo | $69,900 | $72 | 95 |
| 12 Heron St Unit D | 0.10mi | 1/1.0 | 980 (+1%) | 1mo | $120,000 | $122 | 93 |
| 17 Heron St Unit D | 0.09mi | 1/1.0 | 970 (0%) | 4mo | $55,000 | $57 | 92 |
| 6 Dove St Unit D | 0.12mi | 1/1.0 | 970 (0%) | 3mo | $80,000 | $82 | 92 |
| 5 Blue Jay St Unit A | 0.14mi | 1/1.0 | 970 (0%) | 3mo | $53,000 | $55 | 91 |
| 12A Robin St Unit A | 0.08mi | 1/1.0 | 970 (0%) | 6mo | $109,900 | $113 | 91 |
| 22 C Robin St | 0.07mi | 2/1.0 (+1) | 970 (0%) | 3mo | $158,000 | $163 | 89 |
| 4 Flamingo Ter Unit A | 0.19mi | 1/1.0 | 970 (0%) | 5mo | $45,000 | $46 | 87 |
| 9 D Dove St Unit D | 0.10mi | 2/1.0 (+1) | 970 (0%) | 6mo | $57,500 | $59 | 86 |
| 6 C Swallow St | 0.17mi | 2/1.0 (+1) | 970 (0%) | 2mo | $110,000 | $113 | 85 |
| 2C Dove St | 0.16mi | 2/1.0 (+1) | 970 (0%) | 6mo | $78,000 | $80 | 82 |
Match score weights: distance 35% · size 25% · config 20% · recency 20%. Top-matched comps best support the ARV.
Projected returns pro-forma
-3.0% appreciation · 3.0% rent growth · sell at horizon
- IRR
- 9.4%
- Equity multiple
- 1.37×
- Total profit
- $8,237
- Equity at exit
- $11,779
- IRR
- 18.8%
- Equity multiple
- 2.59×
- Total profit
- $35,135
- Equity at exit
- $6,830
Cash invested: $22,120 (down + closing). Projections, not guarantees.
Landlord ↔ Tenant lean methodology
- Overall (STATE)
- 21 Tenant-Leaning
- State New Jersey
- 21 Tenant-Leaning · D+6
- County
- — inherits STATE
- City
- — inherits STATE
ZIP-level market 08759
- Active inventory
- 648
- Price-to-rent
- 3.9×
Monthly cashflow live
- Estimated rent
- $1,698 medium interval (Pro) →
- Mortgage (P&I)
- −$414
- Tax est. 1.5%
- −$99 /mo · $1,185/yr
- Insurance
- −$33
- HOA
- −$470
- Vacancy / Maint / Mgmt
- −$357
- Net cashflow
- $325
Break-even live
UW: 25.0% down · 7.5% · 30yr · 1.5% tax · 5.0% vac · 8.0% maint · 8.0% mgmt
Financing live
Cash to close
- Down payment
- $19,750
- Closing costs
- $2,370
- Reserves months
- —
- Total cash needed
- —
Loan-product check · same deal, 3 products live
Conventional
25% down · 7.5% · 30yr
- Down + closing
- —
- Monthly P&I
- —
- Monthly cashflow
- —
- DSCR
- —
- Eligible?
- —
Personal DTI + credit; lowest rate.
DSCR
20% down · 8.5% · 30yr
- Down + closing
- —
- Monthly P&I
- —
- Monthly cashflow
- —
- DSCR
- —
- Eligible?
- —
No personal income docs; deal must DSCR.
Hard money
10% down · 12.0% · 12mo
- Down + closing
- —
- Monthly P&I
- —
- Monthly cashflow
- —
- DSCR
- —
- Eligible?
- —
Short-term bridge; refi at stabilization.
HOA detail
- Monthly dues
- $470 · $5,640/yr
- Likely covers
- watersewergassnow removalpool
Listing history 2 events
-
2026-05-13status Pending 739-char remark
Show marketing remark (739 chars)
Cedar Glen West Co-Op 55+Charming 1 bed, 1 bath home in desirable Cedar Glen West. Features Updated Kitchen with Granite Counter Tops Stainless Steel Appliances with a Dishwasher and Luxury Vinyl Plank Flooring. Upgraded windows, central A/C, Hardwood Floors Throughout, Gas Heat and Gas Cooking also upgraded shower stall with Sliding Shower Doors. Enjoy the Community Recreation Hall with shuffleboard, pool table, card table, and a library. Community bus service available for added convenience. HOA fee covers property taxes, water, sewer, lawn maintenance, and snow removal also repair or replace hot water and heating, roof and gutters. Just a short drive to Atlantic City for beaches, dining, and entertainment. Photo/Grass Enhanced
-
2026-04-08$79,000 Active 739-char remark
Show marketing remark (739 chars)
Cedar Glen West Co-Op 55+Charming 1 bed, 1 bath home in desirable Cedar Glen West. Features Updated Kitchen with Granite Counter Tops Stainless Steel Appliances with a Dishwasher and Luxury Vinyl Plank Flooring. Upgraded windows, central A/C, Hardwood Floors Throughout, Gas Heat and Gas Cooking also upgraded shower stall with Sliding Shower Doors. Enjoy the Community Recreation Hall with shuffleboard, pool table, card table, and a library. Community bus service available for added convenience. HOA fee covers property taxes, water, sewer, lawn maintenance, and snow removal also repair or replace hot water and heating, roof and gutters. Just a short drive to Atlantic City for beaches, dining, and entertainment. Photo/Grass Enhanced
ⓘ Source: listings_history table (triggers on properties + properties_extension) + one-shot
backfill from property_details.listing_events for pre-trigger history.
Climate risk First Street
- Flood 1/10 Low FEMA zone X (unshaded) · 0% chance over 30 yrs
- Wildfire 5/10 Major
- Heat 6/10 Major 7 d/yr ≥103°F today · 15 d/yr by 30 yrs out
- Wind 6/10 Major 57% chance of damaging wind over 30 yrs
- Air quality 3/10 Moderate 3 unhealthy d/yr today · 4 by 30 yrs out
Nearby sold comps map
Loading sold comps map…
Walkable amenities ~0.75 mi
Loading nearby amenities…
Taxation est. · year 1
- Rental income
- $20,375
- − Mortgage interest
- −$4,425
- − Property taxes
- −$1,185
- − Insurance
- −$395
- − Repairs & maintenance
- −$1,630
- − Management
- −$1,630
- − HOA
- −$5,640
- − Depreciation
- −$2,298
- Taxable income
- $3,171
- Est. tax owed @ 24.0%
- −$761
- After-tax cash flow
- $3,143/yr
For passive investors: Depreciation is non-cash, so a rental often shows a tax loss while cash-flowing — sheltering income. Rental losses are passive: they offset passive income freely, and up to $25,000/yr can offset ordinary (W-2) income if you actively participate and your MAGI is under $100k (phasing out to $0 by $150k); unused losses carry forward. On sale, claimed depreciation is recaptured at up to 25%, and gains may owe capital-gains tax (a 1031 exchange can defer both). Figures are a year-1 estimate at your 24.0% rate — not tax advice; consult a CPA.
Condition & rehab AI · 13 photos
This home is in average condition with some cosmetic updates needed. It has a good layout and is located in a desirable community with amenities like a recreation hall. Painting and landscaping improvements can significantly increase its value.
Repairs flagged
- Minor Paint — Paint appears faded in some areas
- Minor Curtains — Curtains appear slightly worn
Value-add opportunities
- Both Painting exterior and interior — Fresh paint can improve curb appeal and interior aesthetics
- Both Upgrading curtains — Fresh curtains can enhance the home's appearance and comfort
- Both Landscaping improvements — Well-maintained landscaping can increase curb appeal and property value
Renovation cost estimate screening
| Repair item | Severity | Est. cost |
|---|---|---|
| Paint · Paint appears faded in some areas | Minor | $500–3,000 |
| Curtains · Curtains appear slightly worn | Minor | $500–3,000 |
| Total estimated repair cost · 2 items | $1,000–6,000 |
Value-add ROI direction
- Both Painting exterior and interior — Fresh paint can improve curb appeal and interior aesthetics ↑
- Both Upgrading curtains — Fresh curtains can enhance the home's appearance and comfort ↑
- Both Landscaping improvements — Well-maintained landscaping can increase curb appeal and property value ↑
ⓘ Cost ranges are severity-bucket heuristics (US national rule-of-thumb). Get contractor quotes + a written scope before underwriting a rehab budget.
Schools (NCES district)
- District
- Manchester Township School District
- NCES district ID
- 3409450
- Math proficiency
- 25% ▼ -17.00%
- Reading proficiency
- 44% ▼ -5.00%
- Median HH income
- $38,905
- Composite
- 28.8/100
- National rank
- #6662
- State rank
- #320 of 472 in NJ
Livability — Cedar Glen West
- Score
- 66/100
- State rank
- #366
- US rank
- #12309
Category grades
Schools grade is shown separately in the Schools card above.
Census & demographics
- Census place
- Cedar Glen West, NJ
- Population (ZIP)
- 34,290
Population outlook (Ocean County) Hauer SSP2
- Today (2025)
- 586,991 people
- By 2030
- 581,403 · -1.0%
- By 2040
- 564,913 · -3.8%
- By 2050
- 538,149 · -8.3%
- By 2075
- 468,845 · -20.1%
- By 2100
- 350,297 · -40.3%
Race, ethnicity, and origin ACS 2023
- Neighborhood character
- Predominantly White (87%)
- Race & ethnicity
- White 87% Hispanic / Latino 5% Black 4% Two or more races 4% Asian 2%
- Hispanic origin (detail)
- Puerto Rican 2%
- Common ancestry
- Romanian 8% Scotch-Irish 2% Lithuanian 2%
- Foreign-born
- 11% · Canada, China
- Languages at home
- 88% English-only · Spanish 3% Russian/Polish/Slavic 2% Other Indo-European 2%
Political lean MEDSL · Ocean
- 2024 margin
- Solid R (+36.0) · D 31.4% · R 67.4% · Other 1.2%
- 2008→2024 swing
- -17.6pp toward R · 2008: -18.4pp · 2024: -36.0pp
- All cycles
- 2024: R+36.0 2020: R+28.7 2016: R+34.0 2012: R+17.7 2008: R+18.4
Not yet ingested
- Civics
- —
Market trends
- HPI YoY
- ▼ -347.85%
- Current HPI
- 274.4679
- Rent YoY
- —
- Metro
- —
- State GDP YoY
- ▲ 2.05%
- F500 in state
- 34
Industry mix (Fortune 500 HQ in NJ)
| Industry | F500 HQs | Revenue |
|---|---|---|
| Consumer Goods | 3 | $31B |
|
||
| Pharmaceuticals | 2 | $153B |
|
||
| Technology | 2 | $21B |
|
||
| Insurance | 2 | $20B |
|
||
| Healthcare | 2 | $19B |
|
||
| Financial Services | 1 | $70B |
|
||
Price history
2 events — show timeline
- 2026-05-13 Pending — MOMLS
- 2026-04-08 Listed $79,000 MOMLS
Cash-flow waterfall
monthlySold comps — $/sqft
last 12 mo · ≤1 miLoading sold comps…