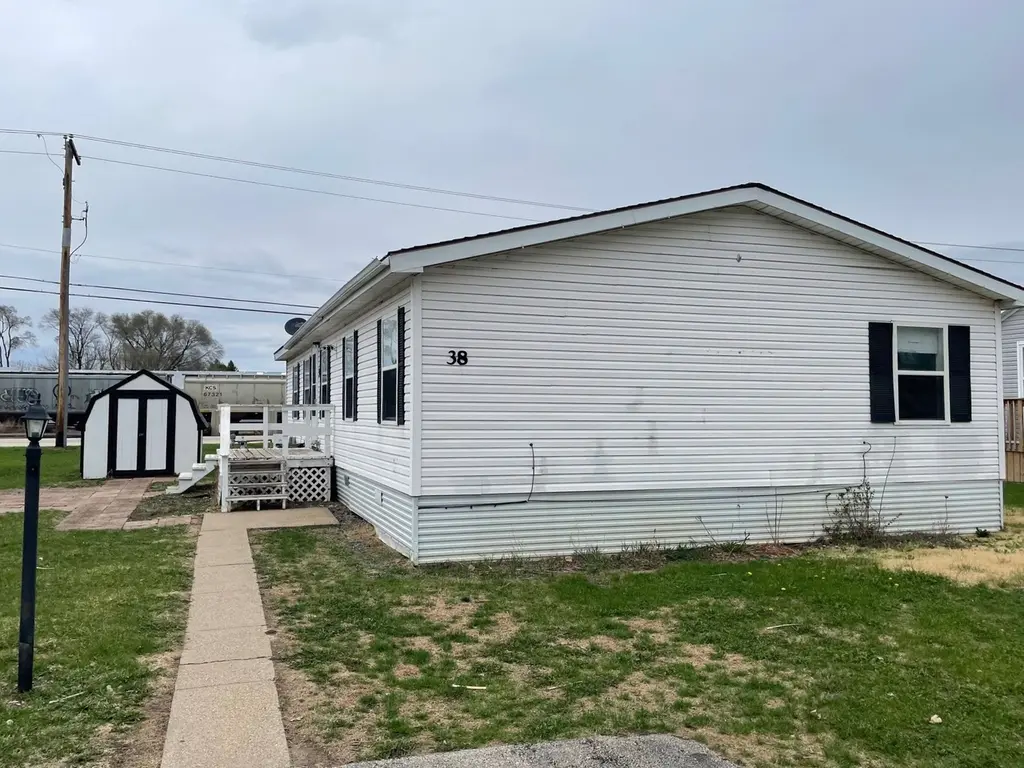
38 Erie Ln Unit E38 · Goodview, MN
Flood risk 1/10 · Minimal
- FEMA flood zone
- X
- Chance of flooding over 30 yrs
- 0.0%
- Est. flood insurance / yr
- $507 – $1,088
Fire risk 3/10 · Minor
- Est. fire insurance / yr
- $888 – $1,650
Heat risk 2/10 · Minimal
- Hot days now (above 101°F)
- 7 days/yr
- Hot days in 30 yrs
- 14 days/yr
Wind risk 2/10 · Minimal
- Chance of severe wind over 30 yrs
- —
Air-quality risk 1/10 · Minimal
- Unhealthy air days now
- 0 days/yr
- Unhealthy air days in 30 yrs
- 0 days/yr
Risk factors via First Street. Map © Google.
Why this score? — see what drove the B grade
The composite is a weighted blend of 9 inputs, each scored 0–100. Each bar is that input's sub-score; the figure is the points it added to the 100-point composite (weight × sub-score).
- Cash flow +30.0/30.0
- 1% rule +10.0/10.0
- DSCR +10.0/10.0
- ARV discount +7.5/15.0
- Rent growth +5.0/5.0
- Livability +3.7/5.0
- Schools +3.1/10.0
- Condition / age +2.8/5.0
- Appreciation +0.0/10.0
$38,500
🖨 Deal sheet 📄 Offer letter ✓ Due diligence
Listing remarks
* THIS IS A RESALE LISTING * This welcoming, well-maintained 3 bedroom, 2 bathroom home is a perfect place to raise your family. For your convenience, we have onsite community management to assist you when you need it. With our family-friendly community amenities such as community events, a playground, and a basketball court, your family will be excited to live here. This home won't be on the market long, so call us today for more information or to schedule a tour. Deposits & Fees are subject to change.
Key facts
- Built 2026
- Listed 3 days
Property features AI
Finance
- Other: Plan name 90969; Status: Active
- Financial info: List price $38,000
Exterior
- Utilities: Natural gas; Central air
- Home design: Spec-built property
- Exterior features: Living area approximately 1400
Interior
- Bedrooms: 3 bedrooms
- Bathrooms: 2 full bathrooms
- Heating & cooling: Natural gas heating; Central air conditioning
- Interior features: 2 total bathrooms
Neighborhood map
What this means for you Summary
Snapshot
- This is a 3-bed/2.0-bath manufactured listed at $38k. Condition is rated average.
Deal economics
- At list price, monthly cash flow is $990 ($12k/yr) — positive.
- The deal already cash-flows at list — no discount required.
- Meets the 1% rule at list price ($2k rent vs $38k).
Location & tenants
- Location reads 73/100 on livability (#236 in MN) — a middle-class / working-renter tenant base. Strengths: crime A+, cost of living A+, housing A+; Watch: schools C-, health & safety C-, amenities F.
- Winona Area Public School District (town): math 33% / reading 40% proficiency, ranked #244 of 301 in MN (top 81%) — families likely to look elsewhere, expect single-tenant / working-renter base with shorter leases.
- Market conditions: Rents rising fast (+18.0%/yr); 137 active listings in the ZIP; 37 units permitted in Winona County in 2024 (0 in 5+ unit buildings).
- This rent runs 31% of the median local income ($62k/yr) — at the standard rent-burdened threshold; future hikes will face affordability resistance.
Forward outlook
- Local home prices are declining (-3.0%/yr); year-one equity from $266 of loan paydown is wiped out by about $1k of value loss. Plan a longer hold.
- Winona County population projected to shrink 9% by 2050 — rents likely to lag national; underwrite the cash flow, not the appreciation.
- At projected returns (-3.0% appreciation + 8.0% rent growth), your $11k cash investment doubles in ~1 year — after that, you're playing with house money.
Negotiation context
- Only 3 days on market — expect competitive offers; lowballing is unlikely to land.
Questions for the listing agent
- Is there a deadline driving the sale (1031 exchange, divorce, estate, relocation)? That informs how much negotiation room exists.
- What's the average days-on-market for RENTAL listings here right now (not sales)? A rising rental-DOM trend means longer vacancies and softer asking-rent achievability than the comps imply.
- What's the recent tenant-quality profile in this submarket — average credit score on applications, eviction rate, late-payment / NSF rate, and stable-employment percentage? A property-management company in the area should have these aggregated.
- How much new for-sale + rental construction is in the pipeline within 1–3 miles? Heavy new supply typically softens prices + rents 12–24 months out; constrained supply supports both.
Investment metrics
- 1% rule
- 4.13% ✓
- Cap rate
- 37.15%
- Cash-on-cash
- 110.19%
- DSCR
- 5.90
- GRM
- 2.0
CMA / ARV
No comps found within radius.
Projected returns pro-forma
-3.0% appreciation · 8.0% rent growth · sell at horizon
- IRR
- —
- Equity multiple
- 7.05×
- Total profit
- $65,233
- Equity at exit
- $5,740
- IRR
- —
- Equity multiple
- 17.36×
- Total profit
- $176,322
- Equity at exit
- $3,329
Cash invested: $10,780 (down + closing). Projections, not guarantees.
Landlord ↔ Tenant lean methodology
- Overall (STATE)
- 46 Balanced
- State Minnesota
- 46 Balanced · D+2
- County
- — inherits STATE
- City
- — inherits STATE
ZIP-level market 55987
- Rents YoY
- 18.0%
- Active inventory
- 137
- Price-to-rent
- 2.0×
Monthly cashflow live
- Estimated rent
- $1,590 medium interval (Pro) →
- Mortgage (P&I)
- −$202
- Tax est. 1.5%
- −$48 /mo · $578/yr
- Insurance
- −$16
- HOA
- −$0
- Vacancy / Maint / Mgmt
- −$334
- Net cashflow
- $990
Break-even live
UW: 25.0% down · 7.5% · 30yr · 1.5% tax · 5.0% vac · 8.0% maint · 8.0% mgmt
Financing live
Cash to close
- Down payment
- $9,625
- Closing costs
- $1,155
- Reserves months
- —
- Total cash needed
- —
Loan-product check · same deal, 3 products live
Conventional
25% down · 7.5% · 30yr
- Down + closing
- —
- Monthly P&I
- —
- Monthly cashflow
- —
- DSCR
- —
- Eligible?
- —
Personal DTI + credit; lowest rate.
DSCR
20% down · 8.5% · 30yr
- Down + closing
- —
- Monthly P&I
- —
- Monthly cashflow
- —
- DSCR
- —
- Eligible?
- —
No personal income docs; deal must DSCR.
Hard money
10% down · 12.0% · 12mo
- Down + closing
- —
- Monthly P&I
- —
- Monthly cashflow
- —
- DSCR
- —
- Eligible?
- —
Short-term bridge; refi at stabilization.
Listing history 1 events
-
2026-06-03pricedays on market $38,500 Active 3 DOM
ⓘ Source: listings_history table (triggers on properties + properties_extension) + one-shot
backfill from property_details.listing_events for pre-trigger history.
Climate risk First Street
- Flood 1/10 Low FEMA zone X · 0% chance over 30 yrs
- Wildfire 3/10 Moderate
- Heat 2/10 Low 7 d/yr ≥101°F today · 14 d/yr by 30 yrs out
- Wind 2/10 Low
- Air quality 1/10 Low 0 unhealthy d/yr today · 0 by 30 yrs out
Nearby sold comps map
Loading sold comps map…
Walkable amenities ~0.75 mi
Loading nearby amenities…
Taxation est. · year 1
- Rental income
- $19,078
- − Mortgage interest
- −$2,157
- − Property taxes
- −$578
- − Insurance
- −$192
- − Repairs & maintenance
- −$1,526
- − Management
- −$1,526
- − Depreciation
- −$1,120
- Taxable income
- $11,979
- Est. tax owed @ 24.0%
- −$2,875
- After-tax cash flow
- $9,004/yr
For passive investors: Depreciation is non-cash, so a rental often shows a tax loss while cash-flowing — sheltering income. Rental losses are passive: they offset passive income freely, and up to $25,000/yr can offset ordinary (W-2) income if you actively participate and your MAGI is under $100k (phasing out to $0 by $150k); unused losses carry forward. On sale, claimed depreciation is recaptured at up to 25%, and gains may owe capital-gains tax (a 1031 exchange can defer both). Figures are a year-1 estimate at your 24.0% rate — not tax advice; consult a CPA.
Condition & rehab AI · 2 photos
This well-maintained mobile home is ready for a fresh coat of paint and some landscaping to enhance its curb appeal and rental value.
Repairs flagged
- Minor Paint — Slight discoloration on exterior siding
- Minor Landscaping — Overgrown grass and weeds
Value-add opportunities
- Resale Paint exterior siding — Fresh paint enhances curb appeal and property value
- Rental Landscaping — Well-maintained landscaping attracts tenants and enhances property value
Renovation cost estimate screening
| Repair item | Severity | Est. cost |
|---|---|---|
| Paint · Slight discoloration on exterior siding | Minor | $500–3,000 |
| Landscaping · Overgrown grass and weeds | Minor | $500–3,000 |
| Total estimated repair cost · 2 items | $1,000–6,000 |
Value-add ROI direction
- Resale Paint exterior siding — Fresh paint enhances curb appeal and property value ↑
- Rental Landscaping — Well-maintained landscaping attracts tenants and enhances property value ↑
ⓘ Cost ranges are severity-bucket heuristics (US national rule-of-thumb). Get contractor quotes + a written scope before underwriting a rehab budget.
Schools (NCES district)
- District
- Winona Area Public School District
- NCES district ID
- 2744070
- Math proficiency
- 33% ▼ -16.00%
- Reading proficiency
- 40% ▼ -9.00%
- Median HH income
- $45,678
- Composite
- 31.15/100
- National rank
- #6058
- State rank
- #244 of 301 in MN
Livability — Goodview
- Score
- 73/100
- State rank
- #236
- US rank
- #5015
Category grades
Schools grade is shown separately in the Schools card above.
Census & demographics
- Census place
- Goodview, MN
- County
- Winona County · 34,072 people
- Metro
- Winona, MN
- Population (ZIP)
- 34,072
- Household income
- $61,624
- Rent vs Own
- Severe rent burden
- 1525.0
Population outlook (Winona County) Hauer SSP2
- Today (2025)
- 50,614 people
- By 2030
- 50,243 · -0.7%
- By 2040
- 48,142 · -4.9%
- By 2050
- 45,872 · -9.4%
- By 2075
- 42,416 · -16.2%
- By 2100
- 40,031 · -20.9%
Race, ethnicity, and origin ACS 2023
- Neighborhood character
- Predominantly White (89%)
- Race & ethnicity
- White 89% Two or more races 4% Hispanic / Latino 4% Black 2% Asian 2%
- Common ancestry
- Portuguese 14% Romanian 12% Lithuanian 2%
- Foreign-born
- 3% · Canada
- Languages at home
- 96% English-only · Spanish 2% Other Asian/Pacific 1%
Political lean MEDSL · Winona
- 2024 margin
- Toss-up / Even · D 46.6% · R 51.5% · Other 1.8%
- 2008→2024 swing
- -24.0pp toward R · 2008: 19.1pp · 2024: -4.9pp
- All cycles
- 2024: R+4.9 2020: D+0.4 2016: R+2.9 2012: D+12.9 2008: D+19.1
Not yet ingested
- Civics
- —
Market trends
- HPI YoY
- ▼ -166.61%
- Current HPI
- 193.7509
- Rent YoY
- ▲ 17.99%
- Metro
- Winona, MN
- State GDP YoY
- ▲ 2.41%
- F500 in state
- 34
Industry mix (Fortune 500 HQ in MN)
| Industry | F500 HQs | Revenue |
|---|---|---|
| Healthcare | 2 | $407B |
|
||
| Retail | 2 | $150B |
|
||
| Consumer Goods | 2 | $32B |
|
||
| Industrial Machinery | 2 | $6B |
|
||
| Agriculture | 1 | $40B |
|
||
| Healthcare / Medical Devices | 1 | $32B |
|
||
Cash-flow waterfall
monthlySold comps — $/sqft
last 12 mo · ≤1 miLoading sold comps…