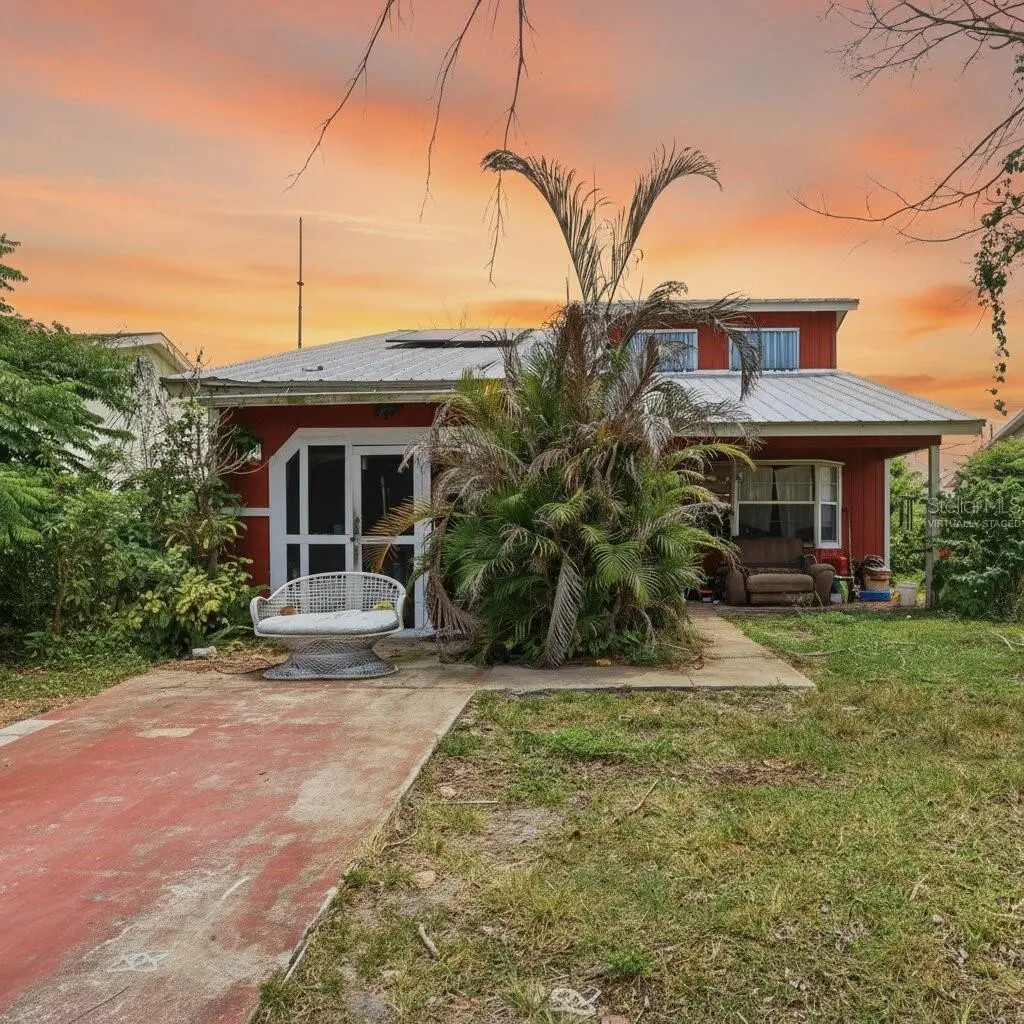
1646 3rd Ct SW · Florida Ridge, FL
Flood risk 5/10 · Moderate
- FEMA flood zone
- X (unshaded)
- Chance of flooding over 30 yrs
- 0.42%
- Est. flood insurance / yr
- $507 – $1,088
Fire risk 3/10 · Minor
- Est. fire insurance / yr
- $947 – $1,759
Heat risk 10/10 · Severe
- Hot days now (above 106°F)
- 7 days/yr
- Hot days in 30 yrs
- 23 days/yr
Wind risk 10/10 · Severe
- Chance of severe wind over 30 yrs
- 99.0%
Air-quality risk 1/10 · Minimal
- Unhealthy air days now
- 0 days/yr
- Unhealthy air days in 30 yrs
- 0 days/yr
Risk factors via First Street. Map © Google.
Why this score? — see what drove the C+ grade
The composite is a weighted blend of 9 inputs, each scored 0–100. Each bar is that input's sub-score; the figure is the points it added to the 100-point composite (weight × sub-score).
- Cash flow +21.4/30.0
- ARV discount +15.0/15.0
- DSCR +6.8/10.0
- 1% rule +4.3/10.0
- Schools +4.2/10.0
- Livability +3.6/5.0
- Rent growth +3.5/5.0
- Condition / age +2.5/5.0
- Appreciation +0.0/10.0
$193,000
🖨 Deal sheet (PDF) 📄 Offer letter ✓ Due diligence
Listing remarks
Under contract-accepting backup offers. Virtually Staged. This 3 bedroom, 2 bathroom home offers great potential with a functional layout and private backyard. Featuring owned solar panels for added value and long term savings. Ideal for buyers ready to renovate and make it their own with sweat equity. Conveniently located near shopping, dining, and a short drive to the beach.
Key facts
- Private backyard
- Owned solar panels
- Functional layout
Tags
Property features AI
Finance
- Other: Homestead exemption indicated; Solar energy generation; Property classified as attached in records; Total lot size about 0.11 acre
- HOA & community: No association indicated; Pets allowed: cats and dogs
Exterior
- Parking: Converted garage; Driveway; Workshop space in garage; 1-car garage (attached)
- Utilities: Public water; Public sewer; Electricity connected; Sewer connected; Cable available
- Home design: Single-family residence; Residential property in RS-6 zoning; Attached property; One story; Faces west; Fixer condition
- Construction: Concrete and frame construction with wood siding; Metal roof; Slab foundation; Built area approximately 1497 square feet (living area reported 982 sq ft)
- Exterior features: Private mailbox; Wood fencing; Level, paved lot; Lot dimensions approximately 50 x 100
Interior
- Kitchen: Dishwasher; Range; Refrigerator
- Bedrooms: 3 bedrooms
- Flooring: Carpet; Tile
- Bathrooms: 2 full bathrooms
- Heating & cooling: Central heating (electric); Solar heating; Central air conditioning
- Interior features: Ceiling fans; Eat-in kitchen; Kitchen open to family room; Vaulted ceilings; Window treatments; Skylight
- Laundry & utility: Laundry closet
Neighborhood map
What this means for you Summary
Snapshot
- This is a 2-bed/2.0-bath single-family listed at $193k.
Deal economics
- At list price, monthly cash flow is $284 ($3k/yr) — positive.
- The deal already cash-flows at list — no discount required.
- To meet the 1% rule (rent ≥ 1% of price), the offer needs to be $179k (7.0% below list).
- Recommended offer: $179k (7.0% below list) — sets the bar for 1% rule.
- Cap rate 8.1% vs local median 4.5% in Florida Ridge — top-decile yield for the area; either an underpriced asset or a hidden risk that comps aren't pricing in. Stress-test before assuming the spread holds.
Location & tenants
- Location reads 72/100 on livability (#353 in FL) — a middle-class / working-renter tenant base. Strengths: commute A+, cost of living A+, housing A+; Watch: employment D, amenities F, health & safety D-.
- Indian River (other): math 48% / reading 52% proficiency, ranked #35 of 73 in FL (top 48%) — acceptable for families but not a draw, mixed tenant base, ~2y average lease.
- Zoned schools: Indian River Academy (math 53% / reading 50%, grade C-, #1,035 of 2,144 statewide, top 49%, 430 students, 81% FRL); Oslo Middle School (math 39% / reading 45%, grade D-, #340 of 571 statewide, top 61%, 864 students, 72% FRL); Vero Beach High School (math 28% / reading 43%, grade F, #367 of 667 statewide, top 57%, 2,847 students, 50% FRL).
- Market conditions: Rents rising fast (+4.2%/yr); 351 active listings in the ZIP; 2 comparable units currently listed for rent nearby; 564 units permitted in Indian River County in 2024 (281 in 5+ unit buildings).
- This rent runs 32% of the median local income ($67k/yr) — at the standard rent-burdened threshold; future hikes will face affordability resistance.
Forward outlook
- Local home prices are declining (-3.0%/yr); year-one equity from $1k of loan paydown is wiped out by about $6k of value loss. Plan a longer hold.
- Indian River County population projected at +18% by 2050 — long-run rental-demand tailwind backs the buy-and-hold thesis.
Negotiation context
- It's been on market 35 days — a 3% lower offer ($187k) is reasonable based on typical stale-listing flexibility.
Risks & watch-outs
- Climate carrying-cost: moderate flood risk; severe wind risk, 99% chance of damaging wind over 30y; extreme-heat days projected 7→23/yr by 2055 (HVAC capex compounding) — expect insurance premiums to compound above CPI over the hold.
Questions for the listing agent
- It's been on market 35 days. Have you received any prior offers? Is the seller open to a 7% concession, seller financing, or rate buy-down credit?
- Is there a deadline driving the sale (1031 exchange, divorce, estate, relocation)? That informs how much negotiation room exists.
- Schools are D-rated, which usually means shorter tenancies and higher turnover. Who's the typical renter profile here, and what's been the actual vacancy rate?
- What's the average days-on-market for RENTAL listings here right now (not sales)? A rising rental-DOM trend means longer vacancies and softer asking-rent achievability than the comps imply.
- What's the recent tenant-quality profile in this submarket — average credit score on applications, eviction rate, late-payment / NSF rate, and stable-employment percentage? A property-management company in the area should have these aggregated.
- How much new for-sale + rental construction is in the pipeline within 1–3 miles? Heavy new supply typically softens prices + rents 12–24 months out; constrained supply supports both.
Investment metrics
- 1% rule
- 0.93% ✗
- Cap rate
- 8.06%
- Cash-on-cash
- 6.32%
- DSCR
- 1.28
- GRM
- 9.0
CMA / ARV
- ARV (on-the-fly)
- $241,572
- Comps found
- 12
Show comp detail 12 sales within ~0.75 mi
| Address | Dist | Beds/Ba | Sqft | Sold | Price | $/sf | Match |
|---|---|---|---|---|---|---|---|
| 219 15th Pl SW | 0.22mi | 2/2.0 | 986 (+0%) | 1mo | $229,500 | $233 | 88 |
| 354 15th Ln SW | 0.14mi | 2/2.0 | 1,036 (+6%) | 4mo | $255,000 | $246 | 81 |
| 490 14th St SW | 0.38mi | 2/2.0 | 962 (-2%) | 10mo | $209,000 | $217 | 71 |
| 233 13th St SW | 0.45mi | 2/1.5 | 1,008 (+3%) | 4mo | $190,000 | $188 | 69 |
| 426 12th St SW | 0.54mi | 2/2.0 | 978 (-0%) | 8mo | $249,000 | $255 | 68 |
| 503 20th St SW | 0.39mi | 3/2.0 (+1) | 927 (-6%) | 2mo | $232,000 | $250 | 65 |
| 344 13th Pl SW | 0.42mi | 3/2.0 (+1) | 1,030 (+5%) | 4mo | $240,000 | $233 | 64 |
| 154 21 St SW | 0.60mi | 3/2.0 (+1) | 1,000 (+2%) | 2mo | $282,000 | $282 | 62 |
| 308 14th Pl SW | 0.28mi | 2/2.0 | 1,128 (+15%) | 8mo | $240,000 | $213 | 56 |
| 725 21st St SW | 0.70mi | 2/2.0 | 924 (-6%) | 6mo | $245,000 | $265 | 52 |
| 1924 Sunset Dr SW | 0.38mi | 3/1.0 (+1) | 874 (-11%) | 5mo | $235,200 | $269 | 51 |
| 2075 7th Ct SW | 0.69mi | 2/2.0 | 1,100 (+12%) | 2mo | $265,000 | $241 | 46 |
Match score weights: distance 35% · size 25% · config 20% · recency 20%. Top-matched comps best support the ARV.
Projected returns pro-forma
-3.0% appreciation · 4.18% rent growth · sell at horizon
- IRR
- -5.5%
- Equity multiple
- 0.79×
- Total profit
- $-11,100
- Equity at exit
- $28,777
- IRR
- 5.4%
- Equity multiple
- 1.41×
- Total profit
- $22,330
- Equity at exit
- $16,687
Cash invested: $54,040 (down + closing). Projections, not guarantees.
Landlord ↔ Tenant lean methodology
- Overall (STATE)
- 87 Strongly Landlord-Friendly
- State Florida
- 87 Strongly Landlord-Friendly · R+3
- County
- — inherits STATE
- City
- — inherits STATE
ZIP-level market 32962
- Rents YoY
- 4.2%
- Active inventory
- 351
- Price-to-rent
- 9.0×
Monthly cashflow live
- Estimated rent
- $1,794 medium interval (Pro) →
- Mortgage (P&I)
- −$1,012
- Tax from tax record
- −$41 /mo · $488/yr
- Insurance
- −$80
- HOA
- −$0
- Vacancy / Maint / Mgmt
- −$377
- Net cashflow
- $284
Break-even live
Sensitivity live
| Price | -10% $394 | -5% $339 | +0% $284 | +5% $230 | +10% $175 |
|---|---|---|---|---|---|
| Rent | -10% $143 | -5% $214 | +0% $284 | +5% $355 | +10% $426 |
| Rate | -1.0pp $382 | -0.5pp $334 | base $284 | +0.5pp $234 | +1.0pp $184 |
UW: 25.0% down · 7.5% · 30yr · 1.5% tax · 5.0% vac · 8.0% maint · 8.0% mgmt
Financing live
Cash to close
- Down payment
- $48,250
- Closing costs
- $5,790
- Reserves months
- —
- Total cash needed
- —
Loan-product check · same deal, 3 products live
Conventional
25% down · 7.5% · 30yr
- Down + closing
- —
- Monthly P&I
- —
- Monthly cashflow
- —
- DSCR
- —
- Eligible?
- —
Personal DTI + credit; lowest rate.
DSCR
20% down · 8.5% · 30yr
- Down + closing
- —
- Monthly P&I
- —
- Monthly cashflow
- —
- DSCR
- —
- Eligible?
- —
No personal income docs; deal must DSCR.
Hard money
10% down · 12.0% · 12mo
- Down + closing
- —
- Monthly P&I
- —
- Monthly cashflow
- —
- DSCR
- —
- Eligible?
- —
Short-term bridge; refi at stabilization.
Rent comps 2 comps
| Address | Beds | Baths | Sqft | Rent | $/sqft | DOM | Units | Dist |
|---|---|---|---|---|---|---|---|---|
| 16 Vista Palm Ln Vero Beach, FL | 1.0–2.0 | 1.5–2.0 | 800 | $1,700 | $2.12 | 22d | 2 | 1.42mi |
| 19 Pine Arbor Ln #105 Vero Beach, FL | 1.0 | 1.5 | 750 | $1,800 | $2.40 | 22d | 1 | 1.42mi |
Listing history 12 events
-
2026-06-13remarks 379-char remark
-
2026-06-13status $193,000 Pending 35 DOM
-
2026-06-08days on market $193,000 Active 35 DOM
-
2026-06-07days on market $193,000 Active 34 DOM
-
2026-06-05days on market $193,000 Active 31 DOM
-
2026-06-02days on market $193,000 Active 29 DOM
-
2026-06-01days on market $193,000 Active 28 DOM
-
2026-05-31days on market $193,000 Active 27 DOM
-
2026-05-30days on market $193,000 Active 26 DOM
-
2026-05-21price $193,000
-
2026-05-12price $194,000
-
2026-05-04$199,000 Active
ⓘ Source: listings_history table (triggers on properties + properties_extension) + one-shot
backfill from property_details.listing_events for pre-trigger history.
Tax reassessment forecast FL · Resets to sale price
- Current annual tax
- $488 · $41/mo
- Projected year-2 tax
- $1,602 · $133/mo
- Expected delta
- +$1,114/yr (+$93/mo · 228.1%)
ⓘ Screening estimate from a state-policy table — verify with the county assessor before closing.
Climate risk First Street
- Flood 5/10 Major FEMA zone X (unshaded) · 42% chance over 30 yrs
- Wildfire 3/10 Moderate
- Heat 10/10 Extreme 7 d/yr ≥106°F today · 23 d/yr by 30 yrs out
- Wind 10/10 Extreme 99% chance of damaging wind over 30 yrs
- Air quality 1/10 Low 0 unhealthy d/yr today · 0 by 30 yrs out
Nearby sold comps map
Loading sold comps map…
Walkable amenities ~0.75 mi
Loading nearby amenities…
Taxation est. · year 1
- Rental income
- $21,534
- − Mortgage interest
- −$10,811
- − Property taxes
- −$488
- − Insurance
- −$965
- − Repairs & maintenance
- −$1,723
- − Management
- −$1,723
- − Depreciation
- −$5,615
- Taxable income
- $210
- Est. tax owed @ 24.0%
- −$50
- After-tax cash flow
- $3,363/yr
For passive investors: Depreciation is non-cash, so a rental often shows a tax loss while cash-flowing — sheltering income. Rental losses are passive: they offset passive income freely, and up to $25,000/yr can offset ordinary (W-2) income if you actively participate and your MAGI is under $100k (phasing out to $0 by $150k); unused losses carry forward. On sale, claimed depreciation is recaptured at up to 25%, and gains may owe capital-gains tax (a 1031 exchange can defer both). Figures are a year-1 estimate at your 24.0% rate — not tax advice; consult a CPA.
Schools (NCES district)
- District
- Indian River
- NCES district ID
- 1200930
- Math proficiency
- 48% ▼ -9.00%
- Reading proficiency
- 52% ▼ -3.00%
- Median HH income
- $46,597
- Composite
- 42.45/100
- National rank
- #3218
- State rank
- #35 of 73 in FL
Livability — Florida Ridge
- Score
- 72/100
- State rank
- #353
- US rank
- #6129
Category grades
Schools grade is shown separately in the Schools card above.
Census & demographics
- Census place
- Florida Ridge, FL
- County
- Indian River County · 143,738 people
- City population
- 25,629
- Metro
- Sebastian-Vero Beach, FL
- Population (ZIP)
- 25,522
- Household income
- $66,664
- Rent vs Own
- Severe rent burden
- 425.0
Population outlook (Indian River County) Hauer SSP2
- Today (2025)
- 165,104 people
- By 2030
- 172,869 · +4.7%
- By 2040
- 185,640 · +12.4%
- By 2050
- 194,465 · +17.8%
- By 2075
- 211,115 · +27.9%
- By 2100
- 211,781 · +28.3%
Race, ethnicity, and origin ACS 2023
- Neighborhood character
- Predominantly White (70%)
- Race & ethnicity
- White 70% Black 13% Hispanic / Latino 12% Two or more races 5% Native American 1%
- Hispanic origin (detail)
- Mexican 1% Puerto Rican 2% Cuban 1%
- Common ancestry
- Romanian 4% Lithuanian 4% Italian 3%
- Foreign-born
- 12% · Canada, Jamaica, Dominican Republic
- Languages at home
- 85% English-only · Spanish 9% Other Indo-European 2% French/Haitian/Cajun 1%
Political lean MEDSL · Indian River
- 2024 margin
- Strong R (+27.4) · D 36.0% · R 63.4%
- 2008→2024 swing
- -12.5pp toward R · 2008: -14.8pp · 2024: -27.4pp
- All cycles
- 2024: R+27.4 2020: R+21.6 2016: R+24.5 2012: R+22.3 2008: R+14.8
Not yet ingested
- Civics
- —
Market trends
- HPI YoY
- ▼ -182.13%
- Current HPI
- 333.3274
- Rent YoY
- ▲ 4.18%
- Metro
- Sebastian-Vero Beach, FL
- State GDP YoY
- ▲ 3.28%
- F500 in state
- 36
Industry mix (Fortune 500 HQ in FL)
| Industry | F500 HQs | Revenue |
|---|---|---|
| Industrial Technology | 2 | $29B |
|
||
| Insurance | 2 | $17B |
|
||
| Retail | 1 | $60B |
|
||
| Technology Distribution | 1 | $58B |
|
||
| Homebuilding | 1 | $35B |
|
||
| Technology Manufacturing | 1 | $35B |
|
||
Price history
-3.0% since first listed3 events — show timeline
- 2026-05-21 Price Changed $193,000 Stellar MLS as Distributed by MLS Grid
- 2026-05-12 Price Changed $194,000 Stellar MLS as Distributed by MLS Grid
- 2026-05-04 Listed $199,000 Stellar MLS as Distributed by MLS Grid
Property tax history
+4.7%/yrLatest (2025): $488 · +89.8% YoY. Source: county tax records.
Cash-flow waterfall
monthlySold comps — $/sqft
last 12 mo · ≤1 miLoading sold comps…