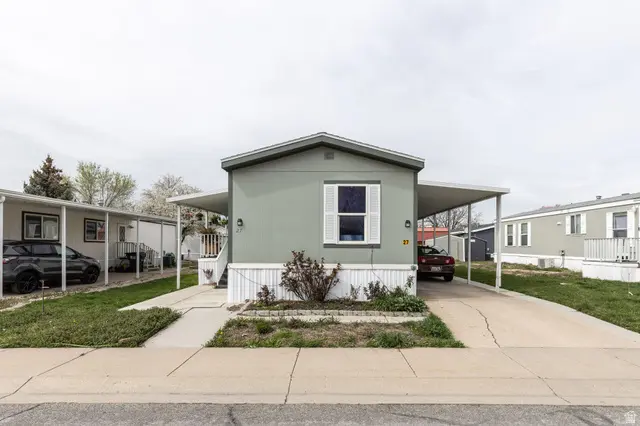
1450 N Washington Blvd #27 · Ogden, UT
Flood risk 1/10 · Minimal
- FEMA flood zone
- X (unshaded)
- Chance of flooding over 30 yrs
- 0.0%
- Est. flood insurance / yr
- $507 – $1,088
Fire risk 6/10 · Moderate
- Est. fire insurance / yr
- $453 – $841
Heat risk 4/10 · Minor
- Hot days now (above 87°F)
- 8 days/yr
- Hot days in 30 yrs
- 22 days/yr
Wind risk 1/10 · Minimal
- Chance of severe wind over 30 yrs
- —
Air-quality risk 3/10 · Minor
- Unhealthy air days now
- 2 days/yr
- Unhealthy air days in 30 yrs
- 3 days/yr
Risk factors via First Street. Map © Google.
Why this score? — see what drove the B- grade
The composite is a weighted blend of 9 inputs, each scored 0–100. Each bar is that input's sub-score; the figure is the points it added to the 100-point composite (weight × sub-score).
- Cash flow +30.0/30.0
- 1% rule +10.0/10.0
- DSCR +10.0/10.0
- ARV discount +7.5/15.0
- Livability +4.2/5.0
- Rent growth +3.1/5.0
- Condition / age +2.5/5.0
- Schools +2.4/10.0
- Appreciation +0.0/10.0
$84,900
🖨 Deal sheet 📄 Offer letter ✓ Due diligence
Listing remarks
This has such a good feel to it when you walk into the front doors with open concept, livingroom, diningroom, kithen that is updated and so homie!! You for sure need to check it out if you are looking for others in this well kept up park. Has a pool, RV parking and a nice covered deck to sit out and enjoy your early morning time and evening down time and the mountain views. Primary has a private bath and on the oposite side of the home away from the primary there are 2 bedrooms and a separate bath for guest. Just off the deck is a patio area in case you want to catch some sun rays. Covered parking, and a easily manageable yard. Roof is in great shape. sewer and water paid
Key facts
- Covered deck
- Rv parking
- Open concept
Tags
Property features AI
Finance
- Other: Has view; Above-grade finished area listed
- HOA & community: Community clubhouse; Community pool; Playground; Management; Pet rules; pets permitted; Association pays sewer and water; Association fees include water and sewer
Exterior
- Parking: Covered parking; Uncovered open parking
- Utilities: Natural gas connected; Electricity connected; Public sewer connected; Culinary (public) water connected
- Home design: Rambler/Ranch style; Built and standing condition; Single-family zoning
- Construction: Asphalt roof
- Exterior features: Covered deck; Open patio; Private in-ground pool with fencing; Storage shed(s); Mountain view; Paved road and sidewalks
Interior
- Kitchen: Updated kitchen; Countertop range; Free-standing range/oven; Refrigerator; Garbage disposal
- Bedrooms: 3 main-level bedrooms
- Flooring: Carpet flooring
- Bathrooms: 2 full bathrooms
- Heating & cooling: Forced air heating (gas central); Evaporative cooling
- Interior features: Primary bathroom; Walk-in closet; Garbage disposal; Updated kitchen; Countertop range; Free-standing range/oven; Refrigerator
Neighborhood map
What this means for you Summary
Snapshot
- This is a 3-bed/2.0-bath manufactured listed at $85k.
Deal economics
- At list price, monthly cash flow is $882 ($11k/yr) — positive.
- The deal already cash-flows at list — no discount required.
- Meets the 1% rule at list price ($2k rent vs $85k).
- Recommended offer: $80k (6.0% below list) — sets the bar for market timing.
Location & tenants
- Location reads 84/100 on livability (#19 in UT, #810 nationally) — a professional / high-income tenant draw. Strengths: amenities A+, commute A+, cost of living A+; Watch: crime F.
- Ogden City District (urban): math 25% / reading 31% proficiency, ranked #72 of 80 in UT (top 90%) — low school quality limits family demand, transient renter base, plan for 1-2y turnover; 75% free/reduced lunch — lower-income household profile, screen leases tightly.
- Zoned schools: Mound Fort Junior High (math 26% / reading 27%, grade F, #116 of 138 statewide, top 85%, 627 students, 98% FRL); Ben Lomond High (math 11% / reading 28%, grade F, #158 of 171 statewide, top 94%, 1,169 students, 44% FRL) — zoned schools at 71% FRL track the district average.
- Market conditions: Rents rising (+2.3%/yr); 611 active listings in the ZIP; 8 comparable units currently listed for rent nearby; rentals at typical pace (median 22d on market — plan ~3-4 weeks tenant-placement turnaround); solid renter incomes; 1,630 units permitted in Weber County in 2024 (521 in 5+ unit buildings).
Forward outlook
- Local home prices are declining (-3.0%/yr); year-one equity from $587 of loan paydown is wiped out by about $3k of value loss. Plan a longer hold.
- Weber County population projected at +24% by 2050 — long-run rental-demand tailwind backs the buy-and-hold thesis.
- At projected returns (-3.0% appreciation + 2.3% rent growth), your $24k cash investment doubles in ~3 years — after that, you're playing with house money.
Negotiation context
- It's been on market 82 days — a 6% lower offer ($80k) is reasonable based on typical stale-listing flexibility.
- 4 sale attempts since 25y ago with the ask held roughly flat each time — persistent listings suggest the price (not the market) is what's stuck; bring a comps-based counter.
Risks & watch-outs
- Climate carrying-cost: major wildfire risk — expect insurance premiums to compound above CPI over the hold.
Questions for the listing agent
- It's been on market 82 days. Have you received any prior offers? Is the seller open to a 6% concession, seller financing, or rate buy-down credit?
- Why hasn't it sold? Are there any deal-killer items the seller is aware of (foundation, flood, title, zoning, code violations)?
- Is there a deadline driving the sale (1031 exchange, divorce, estate, relocation)? That informs how much negotiation room exists.
- Crime grade is F in this area — have there been break-ins, vandalism, or insurance claims at this property in the last 3 years? What carrier currently insures it and at what premium?
- What's the average days-on-market for RENTAL listings here right now (not sales)? A rising rental-DOM trend means longer vacancies and softer asking-rent achievability than the comps imply.
- What's the recent tenant-quality profile in this submarket — average credit score on applications, eviction rate, late-payment / NSF rate, and stable-employment percentage? A property-management company in the area should have these aggregated.
- How much new for-sale + rental construction is in the pipeline within 1–3 miles? Heavy new supply typically softens prices + rents 12–24 months out; constrained supply supports both.
Investment metrics
- 1% rule
- 2.19% ✓
- Cap rate
- 18.76%
- Cash-on-cash
- 44.51%
- DSCR
- 2.98
- GRM
- 3.8
CMA / ARV
No comps found within radius.
Projected returns pro-forma
-3.0% appreciation · 2.33% rent growth · sell at horizon
- IRR
- 40.8%
- Equity multiple
- 2.73×
- Total profit
- $41,186
- Equity at exit
- $12,659
- IRR
- 46.7%
- Equity multiple
- 5.34×
- Total profit
- $103,255
- Equity at exit
- $7,341
Cash invested: $23,772 (down + closing). Projections, not guarantees.
Landlord ↔ Tenant lean methodology
- Overall (STATE)
- 86 Strongly Landlord-Friendly
- State Utah
- 86 Strongly Landlord-Friendly · R+15
- County
- — inherits STATE
- City
- — inherits STATE
ZIP-level market 84404
- Rents YoY
- 2.3%
- Active inventory
- 611
- Price-to-rent
- 3.8×
Monthly cashflow live
- Estimated rent
- $1,859 high interval (Pro) →
- Mortgage (P&I)
- −$445
- Tax est. 1.5%
- −$106 /mo · $1,274/yr
- Insurance
- −$35
- HOA
- −$0
- Vacancy / Maint / Mgmt
- −$390
- Net cashflow
- $882
Break-even live
UW: 25.0% down · 7.5% · 30yr · 1.5% tax · 5.0% vac · 8.0% maint · 8.0% mgmt
Financing live
Cash to close
- Down payment
- $21,225
- Closing costs
- $2,547
- Reserves months
- —
- Total cash needed
- —
Loan-product check · same deal, 3 products live
Conventional
25% down · 7.5% · 30yr
- Down + closing
- —
- Monthly P&I
- —
- Monthly cashflow
- —
- DSCR
- —
- Eligible?
- —
Personal DTI + credit; lowest rate.
DSCR
20% down · 8.5% · 30yr
- Down + closing
- —
- Monthly P&I
- —
- Monthly cashflow
- —
- DSCR
- —
- Eligible?
- —
No personal income docs; deal must DSCR.
Hard money
10% down · 12.0% · 12mo
- Down + closing
- —
- Monthly P&I
- —
- Monthly cashflow
- —
- DSCR
- —
- Eligible?
- —
Short-term bridge; refi at stabilization.
Rent comps 8 comps
| Address | Beds | Baths | Sqft | Rent | $/sqft | DOM | Units | Dist |
|---|---|---|---|---|---|---|---|---|
| 551 E 900 North St Ogden, UT | 3.0 | 2.5 | 1400 | $1,850 | $1.32 | 23d | 2 | 0.74mi |
| 551 E 900 North St Ogden, UT | 3.0 | 2.5 | 1400 | $1,795 | $1.28 | 14d | 1 | 0.74mi |
| 445 E 800 North St Ogden, UT | 2.0 | 1.0 | 1030 | $1,250 | $1.21 | 23d | 1 | 0.88mi |
| 3041 E 2050 N Unit 10 Ogden, UT | 3.0 | 2.5 | 1362 | $1,795 | $1.32 | 23d | 1 | 0.90mi |
| 298 E 2350 N Ogden, UT | 3.0 | 2.5 | 1368 | $1,975 | $1.44 | 21d | 1 | 1.25mi |
| 282 W 1975 N Ogden, UT | 3.0 | 2.5 | 1362 | $1,700 | $1.25 | 14d | 1 | 1.30mi |
| 1933 N 325 W Ogden, UT | 3.0 | 2.5 | 1374 | $1,795 | $1.31 | 19d | 1 | 1.32mi |
| 381 N Washington Blvd Ogden, UT | 1.0–3.0 | 1.0–2.0 | 1062 | $1,683 | $1.58 | 14d | 15 | 1.37mi |
Listing history 23 events
-
2026-06-18days on market $84,900 Active 82 DOM
-
2026-06-17days on market $84,900 Active 81 DOM
-
2026-06-16days on market $84,900 Active 80 DOM
-
2026-06-15days on market $84,900 Active 79 DOM
-
2026-06-14days on market $84,900 Active 77 DOM
-
2026-06-13pricedays on market $84,900 Active 76 DOM
-
2026-06-10days on market $89,000 Active 74 DOM
-
2026-06-09days on market $89,000 Active 73 DOM
-
2026-06-08days on market $89,000 Active 72 DOM
-
2026-06-07days on market $89,000 Active 71 DOM
-
2026-06-05days on market $89,000 Active 68 DOM
-
2026-06-03days on market $89,000 Active 67 DOM
-
2026-06-02days on market $89,000 Active 66 DOM
-
2026-06-01days on market $89,000 Active 65 DOM
-
2026-05-31days on market $89,000 Active 64 DOM
-
2026-05-31days on market $89,000 Active 63 DOM
-
2026-03-28$89,000 Active
-
2008-05-26historical
-
2007-11-27$32,500
-
2003-11-30historical
-
2003-05-27$39,900
-
2002-02-17soldstatus
-
2001-10-10$37,500
ⓘ Source: listings_history table (triggers on properties + properties_extension) + one-shot
backfill from property_details.listing_events for pre-trigger history.
Climate risk First Street
- Flood 1/10 Low FEMA zone X (unshaded) · 0% chance over 30 yrs
- Wildfire 6/10 Major
- Heat 4/10 Moderate 8 d/yr ≥87°F today · 22 d/yr by 30 yrs out
- Wind 1/10 Low
- Air quality 3/10 Moderate 2 unhealthy d/yr today · 3 by 30 yrs out
Nearby sold comps map
Loading sold comps map…
Walkable amenities ~0.75 mi
Loading nearby amenities…
Taxation est. · year 1
- Rental income
- $22,306
- − Mortgage interest
- −$4,756
- − Property taxes
- −$1,274
- − Insurance
- −$424
- − Repairs & maintenance
- −$1,785
- − Management
- −$1,785
- − Depreciation
- −$2,470
- Taxable income
- $9,814
- Est. tax owed @ 24.0%
- −$2,355
- After-tax cash flow
- $8,226/yr
For passive investors: Depreciation is non-cash, so a rental often shows a tax loss while cash-flowing — sheltering income. Rental losses are passive: they offset passive income freely, and up to $25,000/yr can offset ordinary (W-2) income if you actively participate and your MAGI is under $100k (phasing out to $0 by $150k); unused losses carry forward. On sale, claimed depreciation is recaptured at up to 25%, and gains may owe capital-gains tax (a 1031 exchange can defer both). Figures are a year-1 estimate at your 24.0% rate — not tax advice; consult a CPA.
Schools (NCES district)
- District
- Ogden City District
- NCES district ID
- 4900720
- Math proficiency
- 25% ▼ -2.00%
- Reading proficiency
- 31% ▼ -5.00%
- Median HH income
- $41,974
- Composite
- 23.76/100
- National rank
- #7818
- State rank
- #72 of 80 in UT
Livability — Ogden
- Score
- 84/100
- State rank
- #19
- US rank
- #810
Category grades
Schools grade is shown separately in the Schools card above.
Census & demographics
- Census place
- Ogden, UT
- County
- Weber County · 260,557 people
- City population
- 152,611
- Metro
- Ogden-Clearfield, UT
- Population (ZIP)
- 66,587
- Household income
- $85,057
- Rent vs Own
- Severe rent burden
- 1201.0
Population outlook (Weber County) Hauer SSP2
- Today (2025)
- 274,329 people
- By 2030
- 288,577 · +5.2%
- By 2040
- 314,848 · +14.8%
- By 2050
- 338,710 · +23.5%
- By 2075
- 384,412 · +40.1%
- By 2100
- 409,305 · +49.2%
Race, ethnicity, and origin ACS 2023
- Neighborhood character
- Predominantly White (70%)
- Race & ethnicity
- White 70% Hispanic / Latino 24% Two or more races 7% Asian 1%
- Hispanic origin (detail)
- Mexican 20%
- Common ancestry
- Italian 5% Slovak 4% Iranian 3%
- Foreign-born
- 8% · Canada
- Languages at home
- 83% English-only · Spanish 15% Other Indo-European 1%
Political lean MEDSL · Weber
- 2024 margin
- Strong R (+23.5) · D 36.8% · R 60.3% · Other 2.9%
- 2008→2024 swing
- +4.1pp toward D · 2008: -27.6pp · 2024: -23.5pp
- All cycles
- 2024: R+23.5 2020: R+22.7 2016: R+20.0 2012: R+46.0 2008: R+27.6
Not yet ingested
- Civics
- —
Market trends
- HPI YoY
- ▼ -317.85%
- Current HPI
- 323.2499
- Rent YoY
- ▲ 2.33%
- Metro
- Ogden-Clearfield, UT
- State GDP YoY
- ▲ 3.54%
- F500 in state
- 2
Industry mix (Fortune 500 HQ in UT)
| Industry | F500 HQs | Revenue |
|---|---|---|
| Financial Services | 1 | $3B |
|
||
Price history
+137.3% since first listed7 events — show timeline
- 2026-03-28 Listed $89,000 WFRMLS
- 2008-05-26 Listing Removed — WFRMLS
- 2007-11-27 Listed $32,500 WFRMLS
- 2003-11-30 Listing Removed — WFRMLS
- 2003-05-27 Listed $39,900 WFRMLS
- 2002-02-17 Sold (MLS) — WFRMLS
- 2001-10-10 Listed $37,500 WFRMLS
Cash-flow waterfall
monthlySold comps — $/sqft
last 12 mo · ≤1 miLoading sold comps…