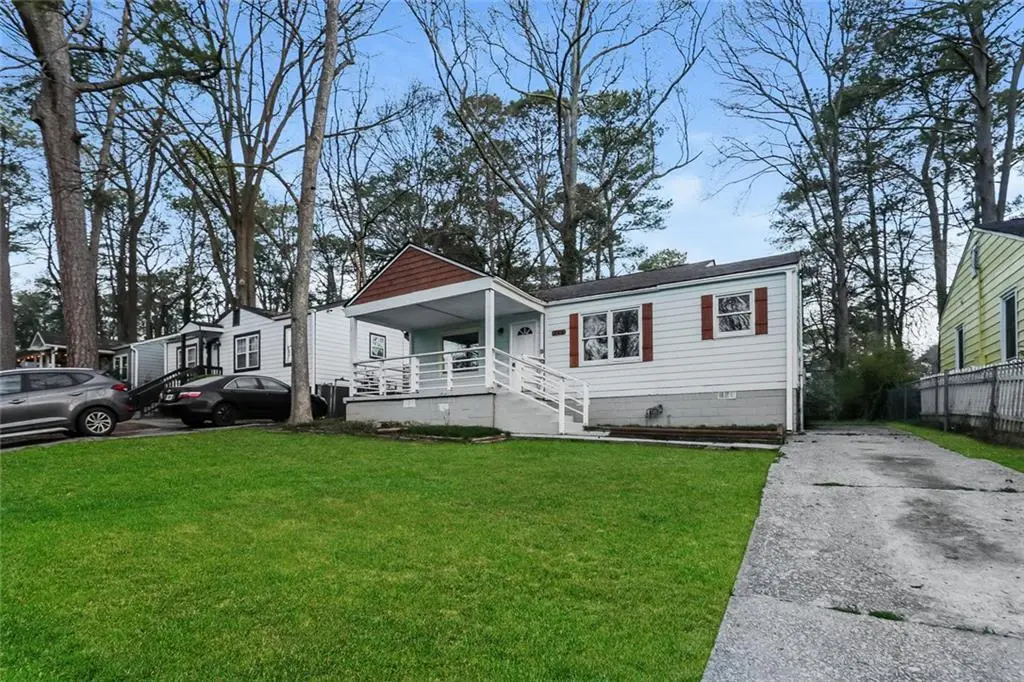
269 Moreland Way · Hapeville, GA
Flood risk 1/10 · Minimal
- FEMA flood zone
- X (unshaded)
- Chance of flooding over 30 yrs
- 0.0%
- Est. flood insurance / yr
- $473 – $860
Fire risk 1/10 · Minimal
- Est. fire insurance / yr
- $963 – $1,789
Heat risk 5/10 · Moderate
- Hot days now (above 104°F)
- 6 days/yr
- Hot days in 30 yrs
- 15 days/yr
Wind risk 6/10 · Moderate
- Chance of severe wind over 30 yrs
- 27.0%
Air-quality risk 4/10 · Minor
- Unhealthy air days now
- 4 days/yr
- Unhealthy air days in 30 yrs
- 6 days/yr
Risk factors via First Street. Map © Google.
Why this score? — see what drove the C- grade
The composite is a weighted blend of 9 inputs, each scored 0–100. Each bar is that input's sub-score; the figure is the points it added to the 100-point composite (weight × sub-score).
- ARV discount +15.0/15.0
- Cash flow +14.3/30.0
- Schools +4.5/10.0
- DSCR +4.3/10.0
- Rent growth +3.9/5.0
- 1% rule +3.8/10.0
- Livability +3.8/5.0
- Condition / age +2.5/5.0
- Appreciation +0.0/10.0
$203,000
🖨 Deal sheet (PDF) 📄 Offer letter ✓ Due diligence
Listing remarks MLS
Situated at 269 Moreland Way in Atlanta, Georgia, US, this inviting residence stands prepared for immediate occupancy. The culinary space presents a harmonious blend of functionality and refined aesthetics, featuring a convenient kitchen peninsula that offers a versatile surface for preparation or casual gatherings. This area is further enhanced by an elegant backsplash and durable stone countertops, while shaker cabinets provide ample storage, contributing to an organized and serene environment. A distinguished bedroom provides a tranquil retreat, enhanced by sophisticated crown molding that adds a touch of classic elegance. This personal sanctuary is complete with an ensuite bathroom, offering privacy and convenience for the occupant. The residence encompasses 1036 square feet of meticulously maintained living area, originally constructed in 1950, presenting a timeless appeal. An inviting porch extends an opportunity for peaceful moments outdoors, providing a delightful extension of the living space. This property offers a refined living experience, poised to become a cherished home.
Key facts
- Elegant backsplash
- Stone countertops
- Shaker cabinets
Tags
Neighborhood map
What this means for you Summary
Snapshot
- This is a 3-bed/2.0-bath single-family listed at $203k.
Deal economics
- At list price, monthly cash flow is $37 ($440/yr) — positive.
- The deal already cash-flows at list — no discount required.
- To meet the 1% rule (rent ≥ 1% of price), the offer needs to be $179k (12.0% below list).
- Recommended offer: $179k (12.0% below list) — sets the bar for 1% rule.
- Cap rate 6.5% vs local median 3.4% in Hapeville — top-decile yield for the area; either an underpriced asset or a hidden risk that comps aren't pricing in. Stress-test before assuming the spread holds.
Location & tenants
- Location reads 76/100 on livability (#25 in GA, #3,590 nationally) — a middle-class / working-renter tenant base. Strengths: cost of living A+, housing A+, employment A-; Watch: schools F, commute F.
- Fulton County (suburban): math 49% / reading 53% proficiency, ranked #12 of 174 in GA (top 7%) — acceptable for families but not a draw, mixed tenant base, ~2y average lease.
- Market conditions: Rents rising fast (+5.5%/yr); 179 active listings in the ZIP; 40 comparable units currently listed for rent nearby; rentals at typical pace (median 17d on market — plan ~3-4 weeks tenant-placement turnaround); 11,565 units permitted in Fulton County in 2024 (8,159 in 5+ unit buildings).
- This rent runs 34% of the median local income ($63k/yr) — at the standard rent-burdened threshold; future hikes will face affordability resistance.
Forward outlook
- Local home prices are declining (-3.0%/yr); year-one equity from $1k of loan paydown is wiped out by about $6k of value loss. Plan a longer hold.
- Fulton County population projected at +38% by 2050 — long-run rental-demand tailwind backs the buy-and-hold thesis.
Negotiation context
- It's been on market 100 days — a 9% lower offer ($185k) is reasonable based on typical stale-listing flexibility.
- 20 sale attempts since 9y ago; this cycle's ask has dropped $12k (6%) from the opening price — seller is motivated, your offer sets the floor, not the list.
Risks & watch-outs
- Watch-outs: built in 1950 — expect roof / HVAC / electrical / plumbing capex.
- Climate carrying-cost: major wind risk, 27% chance of damaging wind over 30y; extreme-heat days projected 6→15/yr by 2055 (HVAC capex compounding) — expect insurance premiums to compound above CPI over the hold.
Questions for the listing agent
- It's been on market 100 days. Have you received any prior offers? Is the seller open to a 12% concession, seller financing, or rate buy-down credit?
- Built in 1950 — when were the roof, HVAC, electrical panel, plumbing, and water heater last replaced?
- Why hasn't it sold? Are there any deal-killer items the seller is aware of (foundation, flood, title, zoning, code violations)?
- Is there a deadline driving the sale (1031 exchange, divorce, estate, relocation)? That informs how much negotiation room exists.
- Schools are F-rated, which usually means shorter tenancies and higher turnover. Who's the typical renter profile here, and what's been the actual vacancy rate?
- What's the average days-on-market for RENTAL listings here right now (not sales)? A rising rental-DOM trend means longer vacancies and softer asking-rent achievability than the comps imply.
- What's the recent tenant-quality profile in this submarket — average credit score on applications, eviction rate, late-payment / NSF rate, and stable-employment percentage? A property-management company in the area should have these aggregated.
- How much new for-sale + rental construction is in the pipeline within 1–3 miles? Heavy new supply typically softens prices + rents 12–24 months out; constrained supply supports both.
Investment metrics
- 1% rule
- 0.88% ✗
- Cap rate
- 6.51%
- Cash-on-cash
- 0.77%
- DSCR
- 1.03
- GRM
- 9.5
CMA / ARV
- ARV (median comp)
- $244,683
- List price
- $203,000
- Delta
- -17.04%
- Verdict
- UNDERPRICED
- Comps
- 20 within 1.0 mi
Show comp detail 12 sales within ~0.75 mi
| Address | Dist | Beds/Ba | Sqft | Sold | Price | $/sf | Match |
|---|---|---|---|---|---|---|---|
| 419 Mount Zion Rd SW | 0.08mi | 3/2.0 | 1,032 (-0%) | 5mo | $225,000 | $218 | 92 |
| 3010 1st Ave SW | 0.11mi | 3/1.0 | 1,075 (+4%) | 1mo | $182,500 | $170 | 83 |
| 3018 Wanda Cir SW | 0.54mi | 3/2.0 | 1,000 (-4%) | 3mo | $229,000 | $229 | 67 |
| 2931 Diana Dr SW | 0.56mi | 3/1.5 | 1,000 (-4%) | 1mo | $220,000 | $220 | 65 |
| 2980 Wanda Cir SW | 0.45mi | 3/1.0 | 975 (-6%) | 2mo | $120,000 | $123 | 64 |
| 2955 Wanda Cir SW | 0.49mi | 3/1.0 | 975 (-6%) | 1mo | $151,000 | $155 | 63 |
| 2928 Diana Dr SW | 0.54mi | 3/1.0 | 1,000 (-4%) | 5mo | $87,000 | $87 | 61 |
| 544 Lake Dr | 0.45mi | 3/0.5 | 952 (-8%) | 1mo | $118,000 | $124 | 59 |
| 540 Lake Dr | 0.44mi | 3/1.0 | 930 (-10%) | 1mo | $102,000 | $110 | 57 |
| 3128 Waters Rd SW | 0.44mi | 3/1.5 | 1,150 (+11%) | 3mo | $106,500 | $93 | 57 |
| 528 Lake Dr | 0.43mi | 2/1.0 (-1) | 936 (-10%) | 0mo | $125,000 | $134 | 54 |
| 682 Steve Dr SW | 0.55mi | 2/1.5 (-1) | 975 (-6%) | 5mo | $90,000 | $92 | 53 |
Match score weights: distance 35% · size 25% · config 20% · recency 20%. Top-matched comps best support the ARV.
Projected returns pro-forma
-3.0% appreciation · 5.45% rent growth · sell at horizon
- IRR
- -12.4%
- Equity multiple
- 0.54×
- Total profit
- $-26,037
- Equity at exit
- $30,268
- IRR
- -0.0%
- Equity multiple
- 1.00×
- Total profit
- $-155
- Equity at exit
- $17,552
Cash invested: $56,840 (down + closing). Projections, not guarantees.
Landlord ↔ Tenant lean methodology
- Overall (STATE)
- 90 Strongly Landlord-Friendly
- State Georgia
- 90 Strongly Landlord-Friendly · R+3
- County
- — inherits STATE
- City
- — inherits STATE
ZIP-level market 30354
- Home prices YoY
- -17.5%
- Rents YoY
- 5.5%
- Active inventory
- 179
- Price-to-rent
- 9.5×
Monthly cashflow live
- Estimated rent
- $1,787 high interval (Pro) →
- Mortgage (P&I)
- −$1,065
- Tax from tax record
- −$226 /mo · $2,709/yr
- Insurance
- −$85
- HOA
- −$0
- Vacancy / Maint / Mgmt
- −$375
- Net cashflow
- $37
Break-even live
Sensitivity live
| Price | -10% $152 | -5% $94 | +0% $37 | +5% $-21 | +10% $-78 |
|---|---|---|---|---|---|
| Rent | -10% $-104 | -5% $-34 | +0% $37 | +5% $107 | +10% $178 |
| Rate | -1.0pp $139 | -0.5pp $88 | base $37 | +0.5pp $-16 | +1.0pp $-69 |
UW: 25.0% down · 7.5% · 30yr · 1.5% tax · 5.0% vac · 8.0% maint · 8.0% mgmt
Financing live
Cash to close
- Down payment
- $50,750
- Closing costs
- $6,090
- Reserves months
- —
- Total cash needed
- —
Loan-product check · same deal, 3 products live
Conventional
25% down · 7.5% · 30yr
- Down + closing
- —
- Monthly P&I
- —
- Monthly cashflow
- —
- DSCR
- —
- Eligible?
- —
Personal DTI + credit; lowest rate.
DSCR
20% down · 8.5% · 30yr
- Down + closing
- —
- Monthly P&I
- —
- Monthly cashflow
- —
- DSCR
- —
- Eligible?
- —
No personal income docs; deal must DSCR.
Hard money
10% down · 12.0% · 12mo
- Down + closing
- —
- Monthly P&I
- —
- Monthly cashflow
- —
- DSCR
- —
- Eligible?
- —
Short-term bridge; refi at stabilization.
Rent comps 40 comps
| Address | Beds | Baths | Sqft | Rent | $/sqft | DOM | Units | Dist |
|---|---|---|---|---|---|---|---|---|
| 278 Moreland Way Atlanta, GA | 3.0 | 2.0 | 1000 | $1,945 | $1.95 | 25d | 1 | 0.02mi |
| 231 Maple St Atlanta, GA | 3.0 | 2.0 | 1068 | $1,645 | $1.54 | 45d | 1 | 0.13mi |
| 2959 Forrest Hills Dr SW Atlanta, GA | 1.0–2.0 | 1.0–1.5 | 925 | $1,250 | $1.35 | 18d | 2 | 0.23mi |
| 2959 Forrest Hills Dr SW Atlanta, GA | 1.0–2.0 | 1.0–1.5 | 925 | $1,250 | $1.35 | 15d | 1 | 0.23mi |
| 3116 Jackson St Atlanta, GA | 2.0 | 2.0 | 1016 | $1,900 | $1.87 | 45d | 1 | 0.31mi |
| 2875 3rd Ave SW Unit A Atlanta, GA | 2.0 | 1.0 | 900 | $1,245 | $1.38 | 3d | 1 | 0.32mi |
| 436 Grady Pl Atlanta, GA | 3.0 | 2.0 | 1425 | $2,100 | $1.47 | 16d | 1 | 0.33mi |
| 3066 Waters Rd SW Atlanta, GA | 3.0 | 1.0 | 1144 | $1,395 | $1.22 | 21d | 1 | 0.37mi |
| 3054 Waters Rd SW Atlanta, GA | 3.0 | 1.0 | 891 | $1,800 | $2.02 | 9d | 1 | 0.38mi |
| 535 Lake Dr Atlanta, GA | 3.0 | 2.0 | 1080 | $2,275 | $2.11 | 45d | 1 | 0.39mi |
| 735 Oak Dr Hapeville, GA | 2.0 | 1.0 | 1053 | $1,550 | $1.47 | 23d | 1 | 0.45mi |
| 3301 Old Jonesboro Rd Atlanta, GA | 2.0 | 1.0 | 899 | $2,250 | $2.50 | 6d | 1 | 0.48mi |
| 2800 Grand Ave SW Atlanta, GA | 3.0 | 1.0 | 1052 | $1,600 | $1.52 | 0d | 1 | 0.49mi |
| 518 North Ave Atlanta, GA | 2.0 | 1.5 | 1096 | $2,150 | $1.96 | 11d | 1 | 0.51mi |
| 45 Baker Dr SW Atlanta, GA | 3.0 | 2.0 | 1056 | $1,600 | $1.52 | 25d | 1 | 0.52mi |
| 3287 Russell St Atlanta, GA | 2.0 | 1.0 | 800 | $1,195 | $1.49 | 45d | 1 | 0.55mi |
| 3162 Oakdale Rd Atlanta, GA | 3.0 | 1.0 | 1040 | $3,200 | $3.08 | 45d | 1 | 0.61mi |
| 532 Cleveland Ave SW Atlanta, GA | 2.0 | 1.0 | 836 | $925 | $1.11 | 23d | 1 | 0.67mi |
| 532 Cleveland Ave SW Atlanta, GA | 2.0 | 1.0 | 836 | $950 | $1.14 | 16d | 1 | 0.67mi |
| 2786 Old Hapeville Rd SW Atlanta, GA | 2.0 | 1.5 | 1050 | $1,150 | $1.10 | 25d | 1 | 0.77mi |
| 2745 Old Hapeville Rd SW Atlanta, GA | 2.0–3.0 | 2.0 | 1007 | $1,375 | $1.36 | 16d | 1 | 0.77mi |
| 3420 Northside Dr Unit B Hapeville, GA | 2.0 | 1.0 | 1000 | $1,150 | $1.15 | 0d | 1 | 0.82mi |
| 801 N Central Ave Atlanta, GA | 2.0–4.0 | 2.5–3.5 | 1586 | $3,195 | $2.01 | 4d | 10 | 0.94mi |
| 2738 Springdale Rd SW Unit 0A Atlanta, GA | 3.0 | 2.0 | 1384 | $1,650 | $1.19 | 0d | 1 | 0.95mi |
| 210 Oak Dr SE Atlanta, GA | 3.0 | 2.0 | 1330 | $1,400 | $1.05 | 25d | 1 | 0.97mi |
| 2952 Palm Dr Atlanta, GA | 3.0 | 2.0 | 1120 | $1,875 | $1.67 | 6d | 1 | 0.98mi |
| 3188 Ward Dr SW Atlanta, GA | 3.0 | 1.5 | 1025 | $1,800 | $1.76 | 13d | 1 | 0.98mi |
| 488 Pomona Cir SW Atlanta, GA | 3.0 | 1.0 | 1000 | $1,800 | $1.80 | 25d | 1 | 1.00mi |
| 167 Alyson Ct SE Atlanta, GA | 4.0 | 2.0 | 1344 | $1,825 | $1.36 | 25d | 1 | 1.01mi |
| 2801 Palm Dr Atlanta, GA | 3.0 | 1.0 | 1064 | $1,550 | $1.46 | 14d | 1 | 1.08mi |
| 3558 Elm St Atlanta, GA | 3.0 | 1.0–2.0 | 1098 | $3,249 | $2.96 | 14d | 33 | 1.12mi |
| 2874 Blount St Atlanta, GA | 3.0 | 1.0 | 1190 | $1,750 | $1.47 | 6d | 1 | 1.15mi |
| 397 N Central Ave Hapeville, GA | 1.0–2.0 | 1.0–2.0 | 950 | $2,704 | $2.85 | 2d | 24 | 1.16mi |
| 536 College St Hapeville, GA | 2.0 | 1.0 | 765 | $1,295 | $1.69 | 18d | 1 | 1.18mi |
| 558 College St Atlanta, GA | 1.0–2.0 | 1.5 | 850 | $1,289 | $1.52 | 16d | 6 | 1.20mi |
| 2744 Miles Cir Unit 2746 Atlanta, GA | 2.0 | 1.0 | 800 | $1,295 | $1.62 | 3d | 1 | 1.24mi |
| 3640 S Fulton Ave Atlanta, GA | 1.0–2.0 | 1.0–2.0 | 950 | $1,833 | $1.93 | 0d | 27 | 1.26mi |
| 2748 Blount St Atlanta, GA | 3.0 | 1.0 | 1068 | $1,850 | $1.73 | 45d | 1 | 1.29mi |
| 2718 Miles Cir Unit 1 Atlanta, GA | 2.0 | 1.0 | 750 | $1,300 | $1.73 | 16d | 1 | 1.32mi |
| 2636 Acadia St Atlanta, GA | 3.0 | 2.0 | 1300 | $1,800 | $1.38 | 25d | 1 | 1.35mi |
Listing history 50 events
-
2026-06-21days on market $203,000 Active 100 DOM
-
2026-06-18days on market $203,000 Active 97 DOM
-
2026-06-17days on market $203,000 Active 96 DOM
-
2026-06-16days on market $203,000 Active 95 DOM
-
2026-06-15days on market $203,000 Active 94 DOM
-
2026-06-13days on market $203,000 Active 92 DOM
-
2026-06-09days on market $203,000 Active 88 DOM
-
2026-06-08pricedays on market $203,000 Active 87 DOM
-
2026-06-07days on market $215,000 Active 86 DOM
-
2026-06-04days on market $215,000 Active 83 DOM
-
2026-06-03days on market $215,000 Active 82 DOM
-
2026-06-01days on market $215,000 Active 80 DOM
-
2026-05-31days on market $215,000 Active 79 DOM
-
2026-03-13$215,000 New 1102-char remark
Show marketing remark (1102 chars)
Situated at 269 Moreland Way in Atlanta, Georgia, US, this inviting residence stands prepared for immediate occupancy. The culinary space presents a harmonious blend of functionality and refined aesthetics, featuring a convenient kitchen peninsula that offers a versatile surface for preparation or casual gatherings. This area is further enhanced by an elegant backsplash and durable stone countertops, while shaker cabinets provide ample storage, contributing to an organized and serene environment. A distinguished bedroom provides a tranquil retreat, enhanced by sophisticated crown molding that adds a touch of classic elegance. This personal sanctuary is complete with an ensuite bathroom, offering privacy and convenience for the occupant. The residence encompasses 1036 square feet of meticulously maintained living area, originally constructed in 1950, presenting a timeless appeal. An inviting porch extends an opportunity for peaceful moments outdoors, providing a delightful extension of the living space. This property offers a refined living experience, poised to become a cherished home.
-
2026-03-13$215,000 Active 1102-char remark
Show marketing remark (1102 chars)
Situated at 269 Moreland Way in Atlanta, Georgia, US, this inviting residence stands prepared for immediate occupancy. The culinary space presents a harmonious blend of functionality and refined aesthetics, featuring a convenient kitchen peninsula that offers a versatile surface for preparation or casual gatherings. This area is further enhanced by an elegant backsplash and durable stone countertops, while shaker cabinets provide ample storage, contributing to an organized and serene environment. A distinguished bedroom provides a tranquil retreat, enhanced by sophisticated crown molding that adds a touch of classic elegance. This personal sanctuary is complete with an ensuite bathroom, offering privacy and convenience for the occupant. The residence encompasses 1036 square feet of meticulously maintained living area, originally constructed in 1950, presenting a timeless appeal. An inviting porch extends an opportunity for peaceful moments outdoors, providing a delightful extension of the living space. This property offers a refined living experience, poised to become a cherished home.
-
2025-01-22historical
-
2025-01-22historical
-
2024-12-05price $253,000
-
2024-12-05price $253,000
-
2024-11-21price $257,000
-
2024-11-21price $257,000
-
2024-11-08price $261,000
-
2024-11-08price $261,000
-
2024-10-24price $265,000
-
2024-10-24price $265,000
-
2024-10-11price $276,000
-
2024-10-11price $276,000
-
2024-09-27price $280,000
-
2024-09-27price $280,000
-
2024-09-10price $284,000
-
2024-09-10price $284,000
-
2024-09-09$289,000 Active
-
2024-09-09$289,000 New
-
2021-07-20soldstatus $215,000
-
2021-07-01soldstatus $215,000 Sold
-
2021-06-14status Under Contract
-
2021-06-07status Back on Market
-
2021-06-02status Under Contract
-
2021-05-31$195,000 New
-
2021-05-05historical
-
2021-05-04status Back on Market
-
2021-05-01status Under Contract
-
2021-04-27status Back on Market
-
2021-04-21status Under Contract
-
2021-04-20$195,000 New
-
2020-07-07status Under Contract
-
2020-07-07historical
-
2020-06-16price $189,999
-
2020-06-15$199,999 New
-
2020-01-22historical
ⓘ Source: listings_history table (triggers on properties + properties_extension) + one-shot
backfill from property_details.listing_events for pre-trigger history.
Tax reassessment forecast GA · Resets to sale price
- Current annual tax
- $2,709 · $226/mo
- Projected year-2 tax
- $2,709 · $226/mo
- Expected delta
- $0/yr ($0/mo · 0.0%)
ⓘ Screening estimate from a state-policy table — verify with the county assessor before closing.
Climate risk First Street
- Flood 1/10 Low FEMA zone X (unshaded) · 0% chance over 30 yrs
- Wildfire 1/10 Low
- Heat 5/10 Major 6 d/yr ≥104°F today · 15 d/yr by 30 yrs out
- Wind 6/10 Major 27% chance of damaging wind over 30 yrs
- Air quality 4/10 Moderate 4 unhealthy d/yr today · 6 by 30 yrs out
Nearby sold comps map
Loading sold comps map…
Walkable amenities ~0.75 mi
Loading nearby amenities…
Taxation est. · year 1
- Rental income
- $21,442
- − Mortgage interest
- −$11,371
- − Property taxes
- −$2,709
- − Insurance
- −$1,015
- − Repairs & maintenance
- −$1,715
- − Management
- −$1,715
- − Depreciation
- −$5,905
- Taxable loss
- −$2,990
- Est. tax savings @ 24.0%
- +$718
- After-tax cash flow
- $1,158/yr
For passive investors: Depreciation is non-cash, so a rental often shows a tax loss while cash-flowing — sheltering income. Rental losses are passive: they offset passive income freely, and up to $25,000/yr can offset ordinary (W-2) income if you actively participate and your MAGI is under $100k (phasing out to $0 by $150k); unused losses carry forward. On sale, claimed depreciation is recaptured at up to 25%, and gains may owe capital-gains tax (a 1031 exchange can defer both). Figures are a year-1 estimate at your 24.0% rate — not tax advice; consult a CPA.
Schools (NCES district)
- District
- Fulton County
- NCES district ID
- 1302280
- Math proficiency
- 49% ▼ -2.00%
- Reading proficiency
- 53% ▬ 0.00%
- Median HH income
- $68,035
- Composite
- 45.33/100
- National rank
- #2640
- State rank
- #12 of 174 in GA
Livability — Hapeville
- Score
- 76/100
- State rank
- #25
- US rank
- #3590
Category grades
Schools grade is shown separately in the Schools card above.
Census & demographics
- Census place
- Hapeville, GA
- County
- Fulton County · 1,094,430 people
- Metro
- Atlanta-Sandy Springs-Alpharetta, GA
- Population (ZIP)
- 16,182
- Household income
- $63,189
- Rent vs Own
- Severe rent burden
- 930.0
Population outlook (Fulton County) Hauer SSP2
- Today (2025)
- 1,203,707 people
- By 2030
- 1,299,706 · +8.0%
- By 2040
- 1,488,256 · +23.6%
- By 2050
- 1,664,580 · +38.3%
- By 2075
- 2,036,072 · +69.2%
- By 2100
- 2,222,402 · +84.6%
Race, ethnicity, and origin ACS 2023
- Neighborhood character
- Predominantly Black (68%)
- Race & ethnicity
- Black 68% Hispanic / Latino 16% White 10% Two or more races 9% Native American 2% Asian 1%
- Hispanic origin (detail)
- Mexican 13%
- Common ancestry
- Italian 2% Romanian 1% Swedish 1%
- Foreign-born
- 11% · Canada, Vietnam, Guatemala
- Languages at home
- 81% English-only · Spanish 15% German/W. Germanic 1% Vietnamese 1%
Political lean MEDSL · Fulton
- 2024 margin
- Solid D (+44.9) · D 71.9% · R 27.0% · Other 1.1%
- 2008→2024 swing
- +9.8pp toward D · 2008: 35.0pp · 2024: 44.9pp
- All cycles
- 2024: D+44.9 2020: D+46.4 2016: D+42.1 2012: D+29.6 2008: D+35.0
Not yet ingested
- Civics
- —
Market trends
- HPI YoY
- ▼ -67.78%
- Current HPI
- 320.1111
- Rent YoY
- ▲ 5.45%
- Metro
- Atlanta-Sandy Springs-Alpharetta, GA
- State GDP YoY
- ▲ 2.66%
- F500 in state
- 28
Industry mix (Fortune 500 HQ in GA)
| Industry | F500 HQs | Revenue |
|---|---|---|
| Paper / Packaging | 2 | $29B |
|
||
| Retail | 1 | $160B |
|
||
| Transportation / Logistics | 1 | $91B |
|
||
| Airlines | 1 | $62B |
|
||
| Consumer Goods | 1 | $47B |
|
||
| Utilities | 1 | $25B |
|
||
Price history
+760.0% since first listed71 events — show timeline
- 2026-03-13 Listed $215,000 FMLS
- 2026-03-13 Listed $215,000 GAMLS
- 2025-01-22 Listing Removed — GAMLS
- 2025-01-22 Listing Removed — FMLS
- 2024-12-05 Price Changed $253,000 FMLS
- 2024-12-05 Price Changed $253,000 GAMLS
- 2024-11-21 Price Changed $257,000 GAMLS
- 2024-11-21 Price Changed $257,000 FMLS
- 2024-11-08 Price Changed $261,000 GAMLS
- 2024-11-08 Price Changed $261,000 FMLS
- 2024-10-24 Price Changed $265,000 GAMLS
- 2024-10-24 Price Changed $265,000 FMLS
- 2024-10-11 Price Changed $276,000 GAMLS
- 2024-10-11 Price Changed $276,000 FMLS
- 2024-09-27 Price Changed $280,000 GAMLS
- 2024-09-27 Price Changed $280,000 FMLS
- 2024-09-10 Price Changed $284,000 GAMLS
- 2024-09-10 Price Changed $284,000 FMLS
- 2024-09-09 Listed $289,000 GAMLS
- 2024-09-09 Listed $289,000 FMLS
- 2021-07-20 Sold (Public Records) $215,000 Public Records
- 2021-07-01 Sold (MLS) $215,000 GAMLS
- 2021-06-14 Pending — GAMLS
- 2021-06-07 Relisted — GAMLS
- 2021-06-02 Pending — GAMLS
- 2021-05-31 Listed $195,000 GAMLS
- 2021-05-05 Listing Removed — GAMLS
- 2021-05-04 Relisted — GAMLS
- 2021-05-01 Pending — GAMLS
- 2021-04-27 Relisted — GAMLS
- 2021-04-21 Pending — GAMLS
- 2021-04-20 Listed $195,000 GAMLS
- 2020-07-07 Pending — GAMLS
- 2020-07-07 Listing Removed — GAMLS
- 2020-06-16 Price Changed $189,999 GAMLS
- 2020-06-15 Listed $199,999 GAMLS
- 2020-01-22 Listing Removed — GAMLS
- 2019-10-25 Price Changed $150,000 GAMLS
- 2019-09-05 Relisted — GAMLS
- 2019-08-19 Pending — GAMLS
- 2019-06-17 Listed $153,500 GAMLS
- 2018-10-23 Listing Removed — GAMLS
- 2018-10-21 Relisted — GAMLS
- 2018-09-06 Pending — GAMLS
- 2018-08-27 Price Changed $135,000 GAMLS
- 2018-07-20 Price Changed $139,900 GAMLS
- 2018-07-05 Listed $149,900 GAMLS
- 2018-06-30 Listing Removed — FMLS
- 2018-05-19 Price Changed $149,900 FMLS
- 2018-05-19 Relisted — FMLS
- 2018-05-12 Pending — FMLS
- 2018-03-25 Price Changed $159,900 FMLS
- 2018-03-13 Price Changed $165,000 FMLS
- 2018-02-10 Price Changed $172,000 FMLS
- 2018-02-09 Listed $72,000 FMLS
- 2017-11-21 Sold (MLS) $74,500 GAMLS
- 2017-11-21 Sold (MLS) $74,500 FMLS
- 2017-10-18 Price Changed $80,500 FMLS
- 2017-10-17 Pending — GAMLS
- 2017-10-17 Pending — FMLS
- 2017-10-17 Price Changed $80,500 GAMLS
- 2017-10-16 Price Changed $64,900 GAMLS
- 2017-10-16 Price Changed $64,900 FMLS
- 2017-10-12 Relisted — GAMLS
- 2017-10-12 Relisted — FMLS
- 2017-09-19 Pending — GAMLS
- 2017-09-19 Pending — FMLS
- 2017-09-13 Listed $69,900 FMLS
- 2017-09-12 Listed $69,900 GAMLS
- 2001-08-17 Sold (Public Records) $47,500 Public Records
- 1993-05-25 Sold (Public Records) $25,000 Public Records
Property tax history
+7.3%/yrLatest (2025): $2,709 · -0.0% YoY. Source: county tax records.
Cash-flow waterfall
monthlySold comps — $/sqft
last 12 mo · ≤1 miLoading sold comps…