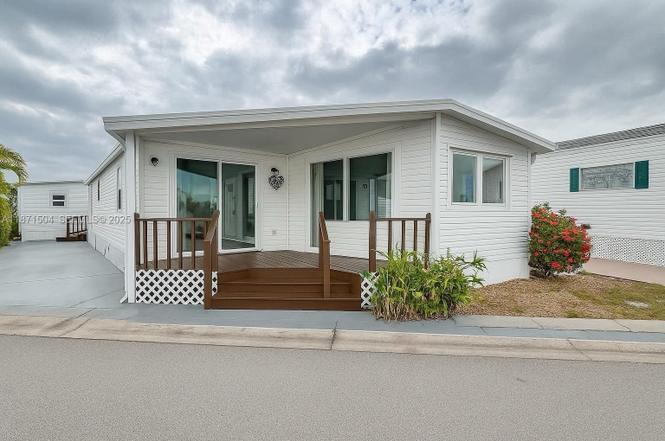
204 Flamingo Dr #1 · Briny Breezes, FL
Flood risk 8/10 · Major
- FEMA flood zone
- X (unshaded)
- Chance of flooding over 30 yrs
- 0.97%
- Est. flood insurance / yr
- $507 – $1,088
Fire risk 1/10 · Minimal
- Est. fire insurance / yr
- $947 – $1,759
Heat risk 10/10 · Severe
- Hot days now (above 105°F)
- 7 days/yr
- Hot days in 30 yrs
- 28 days/yr
Wind risk 10/10 · Severe
- Chance of severe wind over 30 yrs
- 99.0%
Air-quality risk 2/10 · Minimal
- Unhealthy air days now
- 1 days/yr
- Unhealthy air days in 30 yrs
- 2 days/yr
Risk factors via First Street. Map © Google.
Why this score? — see what drove the D grade
The composite is a weighted blend of 9 inputs, each scored 0–100. Each bar is that input's sub-score; the figure is the points it added to the 100-point composite (weight × sub-score).
- Cash flow +12.2/30.0
- ARV discount +7.5/15.0
- 1% rule +6.0/10.0
- Schools +4.3/10.0
- Livability +3.7/5.0
- DSCR +3.6/10.0
- Rent growth +3.4/5.0
- Condition / age +2.5/5.0
- Appreciation +0.0/10.0
$210,000
🖨 Deal sheet 📄 Offer letter ✓ Due diligence
Listing remarks
Welcome to the sought-after water front community of Briny Breezes. This purchase Comes with 31 SHARES!!! Just steps from the Intracoastal, community pool, and clubhouse. Enjoy the coastal breeze and vibrant community lifestyle—ideal as a year-round residence or a relaxing beach side retreat!
Key facts
- $412 HOA
- Community pool
- Built 1969
Neighborhood map
What this means for you Summary
Snapshot
- This is a 2-bed/1.0-bath condo listed at $210k.
Deal economics
- At list price, monthly cash flow is $-110 ($-1k/yr) — negative.
- To cash-flow at today's rent, offer at most $194k (7.6% below list).
- Meets the 1% rule at list price ($2k rent vs $210k).
- Recommended offer: $194k (7.6% below list) — sets the bar for cash-flow.
Location & tenants
- Location reads 74/100 on livability (#277 in FL, #4,433 nationally) — a middle-class / working-renter tenant base. Strengths: housing A+, health & safety A+, crime A; Watch: amenities F, commute F.
- Palm Beach (suburban): math 46% / reading 53% proficiency, ranked #34 of 73 in FL (top 47%) — families likely to look elsewhere, expect single-tenant / working-renter base with shorter leases.
- Zoned schools: Forest Park Elementary School (math 42% / reading 38%, grade F, #1,491 of 2,144 statewide, top 70%, 571 students, 81% FRL); Congress Community Middle School (math 21% / reading 28%, grade F, #522 of 571 statewide, top 93%, 988 students, 72% FRL); Atlantic High School (math 28% / reading 52%, grade F, #296 of 667 statewide, top 45%, 1,889 students, 59% FRL) — zoned schools average 71% FRL vs 52% district-wide (19 pts higher); higher-poverty schools than district average — tighter screening recommended.
- Zoned-school proficiency averages 35% at this address vs 50% district-wide (-15 pts) — the specific schools serving this property underperform the Palm Beach average; the district grade overstates school quality for this exact location.
- Market conditions: Rents rising (+3.6%/yr); 536 active listings in the ZIP; 28 comparable units currently listed for rent nearby; rentals at typical pace (median 22d on market — plan ~3-4 weeks tenant-placement turnaround); 3,974 units permitted in Palm Beach County in 2024 (1,012 in 5+ unit buildings).
- This rent runs 41% of the median local income ($68k/yr) — at the standard rent-burdened threshold; future hikes will face affordability resistance.
Forward outlook
- Local home prices are declining (-3.0%/yr); year-one equity from $1k of loan paydown is wiped out by about $6k of value loss. Plan a longer hold.
- Palm Beach County population projected at +30% by 2050 — long-run rental-demand tailwind backs the buy-and-hold thesis.
Negotiation context
- It's been on market 28 days — a 2% lower offer ($207k) is reasonable based on typical stale-listing flexibility.
- 3 sale attempts; this cycle's ask has dropped $39k (16%) from the opening price — seller is motivated, your offer sets the floor, not the list.
Risks & watch-outs
- Watch-outs: flood insurance adds $66/mo.
- Climate carrying-cost: severe flood risk; severe wind risk, 99% chance of damaging wind over 30y; extreme-heat days projected 7→28/yr by 2055 (HVAC capex compounding) — expect insurance premiums to compound above CPI over the hold.
Questions for the listing agent
- What do current leases actually rent for vs. the listed asking? Can we see a recent rent roll and the last 12 months of T-12 income?
- Built in 1969 — when were the roof, HVAC, electrical panel, plumbing, and water heater last replaced?
- What's the actual annual flood-insurance premium (NFIP or private), and is the property in a SFHA with mandatory coverage?
- What does the HOA fee cover, when was the last increase, and are there any pending special assessments or reserve-fund shortfalls?
- Any open or pending special assessments — roof, HVAC, plumbing, elevator, façade? What's the per-unit balance and payoff schedule, and is the seller paying it off at close or rolling it to the buyer?
- Is there a deadline driving the sale (1031 exchange, divorce, estate, relocation)? That informs how much negotiation room exists.
- Schools are D-rated, which usually means shorter tenancies and higher turnover. Who's the typical renter profile here, and what's been the actual vacancy rate?
- The area grade is low — what's the realistic commute time and amenity access for the typical tenant pool here? Any planned neighborhood developments (good or bad) we should know about?
- What's the average days-on-market for RENTAL listings here right now (not sales)? A rising rental-DOM trend means longer vacancies and softer asking-rent achievability than the comps imply.
- What's the recent tenant-quality profile in this submarket — average credit score on applications, eviction rate, late-payment / NSF rate, and stable-employment percentage? A property-management company in the area should have these aggregated.
- How much new apartment / multifamily construction is in the pipeline within 1–3 miles? Heavy new supply (>2% of stock underway) typically softens rents 12–24 months out; light construction supports rent growth.
Investment metrics
- 1% rule
- 1.10% ✓
- Cap rate
- 6.04%
- Cash-on-cash
- -0.89%
- DSCR
- 0.96
- GRM
- 7.6
CMA / ARV
No comps found within radius.
Projected returns pro-forma
-3.0% appreciation · 3.64% rent growth · sell at horizon
- IRR
- -18.8%
- Equity multiple
- 0.33×
- Total profit
- $-39,208
- Equity at exit
- $31,312
- IRR
- -9.4%
- Equity multiple
- 0.39×
- Total profit
- $-35,615
- Equity at exit
- $18,157
Cash invested: $58,800 (down + closing). Projections, not guarantees.
Landlord ↔ Tenant lean methodology
- Overall (STATE)
- 87 Strongly Landlord-Friendly
- State Florida
- 87 Strongly Landlord-Friendly · R+3
- County
- — inherits STATE
- City
- — inherits STATE
ZIP-level market 33435
- Rents YoY
- 3.6%
- Active inventory
- 536
- Price-to-rent
- 7.6×
Monthly cashflow live
- Estimated rent
- $2,304 high interval (Pro) →
- Mortgage (P&I)
- −$1,101
- Tax est. 1.5%
- −$262 /mo · $3,150/yr
- Insurance
- −$88
- Flood insurance flood zone
- −$66 /mo · $798/yr
- HOA
- −$412
- Vacancy / Maint / Mgmt
- −$484
- Net cashflow
- $-110
Break-even live
UW: 25.0% down · 7.5% · 30yr · 1.5% tax · 5.0% vac · 8.0% maint · 8.0% mgmt
Financing live
Cash to close
- Down payment
- $52,500
- Closing costs
- $6,300
- Reserves months
- —
- Total cash needed
- —
Loan-product check · same deal, 3 products live
Conventional
25% down · 7.5% · 30yr
- Down + closing
- —
- Monthly P&I
- —
- Monthly cashflow
- —
- DSCR
- —
- Eligible?
- —
Personal DTI + credit; lowest rate.
DSCR
20% down · 8.5% · 30yr
- Down + closing
- —
- Monthly P&I
- —
- Monthly cashflow
- —
- DSCR
- —
- Eligible?
- —
No personal income docs; deal must DSCR.
Hard money
10% down · 12.0% · 12mo
- Down + closing
- —
- Monthly P&I
- —
- Monthly cashflow
- —
- DSCR
- —
- Eligible?
- —
Short-term bridge; refi at stabilization.
Rent comps 28 comps
| Address | Beds | Baths | Sqft | Rent | $/sqft | DOM | Units | Dist |
|---|---|---|---|---|---|---|---|---|
| 4603 N Ocean Blvd Unit 1018163P Boynton Beach, FL | 2.0 | 1.0 | 581 | $2,573 | $4.43 | 22d | 1 | 0.21mi |
| 22 Oceanview Dr Ocean Ridge, FL | 1.0 | 1.0 | 620 | $3,500 | $5.65 | 24d | 1 | 0.21mi |
| 1407 Tuscany Way #1407 Boynton Beach, FL | 1.0 | 1.0 | 721 | $2,100 | $2.91 | 3d | 1 | 0.21mi |
| 2412 Tuscany Way Boynton Beach, FL | 1.0 | 1.0 | 750 | $3,000 | $4.00 | 24d | 1 | 0.25mi |
| 21 Ruthmary Ave Unit G Briny Breezes, FL | 1.0 | 1.0 | 396 | $2,850 | $7.20 | 24d | 1 | 0.26mi |
| 205 Coral Rd Unit 1 Boynton Beach, FL | 1.0 | 1.0 | 500 | $2,300 | $4.60 | 24d | 1 | 0.26mi |
| 5505 N Ocean Blvd Ocean Ridge, FL | 1.0–2.0 | 1.0–2.0 | 774 | $2,300 | $2.97 | 10d | 3 | 0.29mi |
| 2303 S Federal Hwy #19 Boynton Beach, FL | 1.0 | 1.0 | 615 | $1,450 | $2.36 | 5d | 1 | 0.32mi |
| 515 SE 20th Ave Boynton Beach, FL | 2.0 | 1.0 | 787 | $1,889 | $2.40 | 7d | 3 | 0.36mi |
| 2301 SE 4th St Unit 15 Boynton Beach, FL | 1.0 | 1.0 | 573 | $1,545 | $2.70 | 24d | 1 | 0.41mi |
| 2301 SE 4th St #11 Boynton Beach, FL | 1.0 | 1.0 | 573 | $1,595 | $2.78 | 24d | 1 | 0.41mi |
| 640 Snug Harbor Dr Unit F3 Boynton Beach, FL | 1.0 | 1.0 | 629 | $2,500 | $3.97 | 10d | 1 | 0.49mi |
| 638 Snug Harbor Dr Boynton Beach, FL | 1.0–2.0 | 1.0–2.0 | 747 | $2,300 | $3.08 | 24d | 2 | 0.52mi |
| 3851 N Ocean Blvd Gulf Stream, FL | 1.0–2.0 | 1.0 | 677 | $5,000 | $7.39 | 24d | 4 | 0.64mi |
| 1001 S Federal Hwy Unit 3 Boynton Beach, FL | 1.0 | 1.0 | 650 | $1,995 | $3.07 | 24d | 1 | 0.75mi |
| 850 Horizons E #309 Boynton Beach, FL | 1.0 | 1.5 | 646 | $1,990 | $3.08 | 20d | 1 | 0.83mi |
| 800 Horizons W #211 Boynton Beach, FL | 1.0 | 1.0 | 570 | $1,650 | $2.89 | 15d | 1 | 0.84mi |
| 650 Horizons E #107 Boynton Beach, FL | 1.0 | 1.0 | 570 | $1,600 | $2.81 | 24d | 1 | 0.91mi |
| 620 Horizons W #207 Boynton Beach, FL | 1.0 | 1.0 | 570 | $1,200 | $2.11 | 24d | 1 | 0.94mi |
| 2861 S Seacrest Blvd Boynton Beach, FL | 1.0 | 1.0 | 710 | $1,680 | $2.37 | 2d | 3 | 1.08mi |
| 240 Horizons W #108 Boynton Beach, FL | 1.0 | 1.5 | 646 | $1,600 | $2.48 | 24d | 1 | 1.09mi |
| 207 SE 4th Ave Boynton Beach, FL | 1.0 | 1.0 | 650 | $1,795 | $2.76 | 2d | 1 | 1.11mi |
| 640 SE 2nd Ave Unit 111 Boynton Beach, FL | 1.0 | 1.0 | 650 | $1,720 | $2.65 | 3d | 1 | 1.14mi |
| 101 S Federal Hwy Boynton Beach, FL | 1.0–2.0 | 1.0–2.0 | 969 | $2,794 | $2.88 | 1d | 17 | 1.19mi |
| 100 NE 6th St Boynton Beach, FL | 1.0 | 1.0 | 745 | $2,975 | $3.99 | 12d | 3 | 1.28mi |
| 100 NE 6th St Boynton Beach, FL | 1.0 | 1.0 | 745 | $2,975 | $3.99 | 19d | 3 | 1.28mi |
| 115 SW 1st Ave Boynton Beach, FL | 1.0–2.0 | 1.0–2.0 | 804 | $2,250 | $2.80 | 15d | 2 | 1.35mi |
| 400 N Federal Hwy Unit N304 Boynton Beach, FL | 1.0 | 1.0 | 640 | $2,400 | $3.75 | 24d | 1 | 1.44mi |
HOA detail condo
- Monthly dues
- $412 · $4,944/yr
- Likely covers
- waterpool
- Assessments
- None detected in remarks — confirm with the listing agent.
Listing history 7 events
-
2026-04-08status Pending
-
2026-03-30price $210,000
-
2026-03-12price $235,000
-
2026-03-12status Active
-
2026-03-12price $215,000
-
2026-03-11Active Under Contract
-
2026-02-04$249,000
ⓘ Source: listings_history table (triggers on properties + properties_extension) + one-shot
backfill from property_details.listing_events for pre-trigger history.
Climate risk First Street
- Flood 8/10 Severe FEMA zone X (unshaded) · 97% chance over 30 yrs
- Wildfire 1/10 Low
- Heat 10/10 Extreme 7 d/yr ≥105°F today · 28 d/yr by 30 yrs out
- Wind 10/10 Extreme 99% chance of damaging wind over 30 yrs
- Air quality 2/10 Low 1 unhealthy d/yr today · 2 by 30 yrs out
Nearby sold comps map
Loading sold comps map…
Walkable amenities ~0.75 mi
Loading nearby amenities…
Taxation est. · year 1
- Rental income
- $27,643
- − Mortgage interest
- −$11,763
- − Property taxes
- −$3,150
- − Insurance
- −$1,847
- − Repairs & maintenance
- −$2,211
- − Management
- −$2,211
- − HOA
- −$4,944
- − Depreciation
- −$6,109
- Taxable loss
- −$4,594
- Est. tax savings @ 24.0%
- +$1,103
- After-tax cash flow
- $-216/yr
For passive investors: Depreciation is non-cash, so a rental often shows a tax loss while cash-flowing — sheltering income. Rental losses are passive: they offset passive income freely, and up to $25,000/yr can offset ordinary (W-2) income if you actively participate and your MAGI is under $100k (phasing out to $0 by $150k); unused losses carry forward. On sale, claimed depreciation is recaptured at up to 25%, and gains may owe capital-gains tax (a 1031 exchange can defer both). Figures are a year-1 estimate at your 24.0% rate — not tax advice; consult a CPA.
Schools (NCES district)
- District
- Palm Beach
- NCES district ID
- 1201500
- Math proficiency
- 46% ▼ -16.00%
- Reading proficiency
- 53% ▼ -4.00%
- Median HH income
- $53,943
- Composite
- 42.72/100
- National rank
- #3160
- State rank
- #34 of 73 in FL
Livability — Briny Breezes
- Score
- 74/100
- State rank
- #277
- US rank
- #4433
Category grades
Schools grade is shown separately in the Schools card above.
Census & demographics
- Census place
- Briny Breezes, FL
- County
- Palm Beach County · 1,438,312 people
- Metro
- Miami-Fort Lauderdale-Pompano Beach, FL
- Population (ZIP)
- 37,833
- Household income
- $67,979
- Rent vs Own
- Severe rent burden
- 1623.0
Population outlook (Palm Beach County) Hauer SSP2
- Today (2025)
- 1,637,487 people
- By 2030
- 1,743,255 · +6.5%
- By 2040
- 1,948,712 · +19.0%
- By 2050
- 2,132,979 · +30.3%
- By 2075
- 2,530,027 · +54.5%
- By 2100
- 2,706,979 · +65.3%
Race, ethnicity, and origin ACS 2023
- Neighborhood character
- Diverse neighborhood (Simpson 0.65)
- Race & ethnicity
- White 41% Black 40% Hispanic / Latino 15% Two or more races 10%
- Hispanic origin (detail)
- Mexican 3% Puerto Rican 3% Cuban 2% Dominican 1%
- Common ancestry
- Hispanic 23% Romanian 2% Lithuanian 2%
- Foreign-born
- 30% · Canada, Jamaica
- Languages at home
- 61% English-only · French/Haitian/Cajun 24% Spanish 11% Other Indo-European 2%
Political lean MEDSL · Palm Beach
- 2024 margin
- Toss-up / Even · D 50.0% · R 49.2%
- 2008→2024 swing
- -22.1pp toward R · 2008: 22.9pp · 2024: 0.8pp
- All cycles
- 2024: D+0.8 2020: D+12.8 2016: D+15.3 2012: D+17.0 2008: D+22.9
Not yet ingested
- Civics
- —
Market trends
- HPI YoY
- ▼ -345.86%
- Current HPI
- 371.0527
- Rent YoY
- ▲ 3.64%
- Metro
- Miami-Fort Lauderdale-Pompano Beach, FL
- State GDP YoY
- ▲ 3.28%
- F500 in state
- 36
Industry mix (Fortune 500 HQ in FL)
| Industry | F500 HQs | Revenue |
|---|---|---|
| Industrial Technology | 2 | $29B |
|
||
| Insurance | 2 | $17B |
|
||
| Retail | 1 | $60B |
|
||
| Technology Distribution | 1 | $58B |
|
||
| Homebuilding | 1 | $35B |
|
||
| Technology Manufacturing | 1 | $35B |
|
||
Price history
-15.7% since first listed7 events — show timeline
- 2026-04-08 Pending — Beaches MLS
- 2026-03-30 Price Changed $210,000 Beaches MLS
- 2026-03-12 Price Changed $235,000 Beaches MLS
- 2026-03-12 Relisted — Beaches MLS
- 2026-03-12 Price Changed $215,000 Beaches MLS
- 2026-03-11 Listed — Beaches MLS
- 2026-02-04 Listed $249,000 Beaches MLS
Cash-flow waterfall
monthlySold comps — $/sqft
last 12 mo · ≤1 miLoading sold comps…