55296 Laurel Valley Vly · La Quinta, CA
Flood risk 1/10 · Minimal
- FEMA flood zone
- X (unshaded)
- Chance of flooding over 30 yrs
- 0.0%
- Est. flood insurance / yr
- $507 – $1,088
Fire risk 5/10 · Moderate
- Est. fire insurance / yr
- $659 – $1,223
Heat risk 9/10 · Severe
- Hot days now (above 114°F)
- 6 days/yr
- Hot days in 30 yrs
- 16 days/yr
Wind risk 1/10 · Minimal
- Chance of severe wind over 30 yrs
- —
Air-quality risk 4/10 · Minor
- Unhealthy air days now
- 4 days/yr
- Unhealthy air days in 30 yrs
- 5 days/yr
Risk factors via First Street. Map © Google.
Why this score? — see what drove the D grade
The composite is a weighted blend of 9 inputs, each scored 0–100. Each bar is that input's sub-score; the figure is the points it added to the 100-point composite (weight × sub-score).
- Cash flow +13.7/30.0
- 1% rule +5.9/10.0
- ARV discount +5.8/15.0
- DSCR +4.1/10.0
- Rent growth +4.1/5.0
- Livability +2.9/5.0
- Condition / age +2.5/5.0
- Schools +1.5/10.0
- Appreciation +0.0/10.0
$475,000
🖨 Deal sheet 📄 Offer letter ✓ Due diligence
Listing remarks
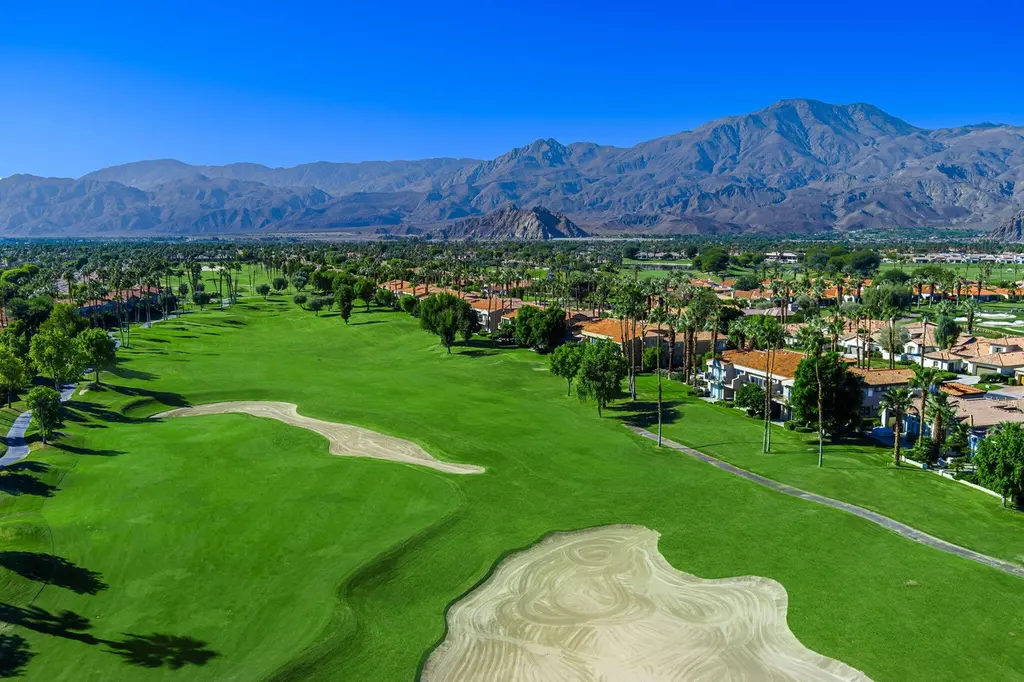
Welcome to this light and spacious condo located in prestigious PGA West community! This condo offers the perfect blend of every day comfort and desert resort living, ideal as a full-time residence, seasonal retreat or investment opportunity. Thoughtfully designed with three generously sized bedrooms, there's plenty of space to host family and friends. Experience front row views of the iconic American Express tournament right from your private patio, where you can watch the pros play against the stunning backdrop of PGA West's. This condo is just steps away from the community pool and spa and close proximity to world-class golf, tennis, pickleball, hiking, biking, upscale dining, shopping a
Key facts
- Front row views
- Community pool
- Community spa
Tags
Property features AI
Finance
- Other: Turnkey furnished (included in sale); Listing terms may include Conventional, 1031 Exchange, Cash to New Loan, or Cash; Short-term rental status unknown; Will not consider lease
- HOA & community: Monthly association fee of $794; Association amenities include greenbelt/park and pet rules; Gated community with golf course development
Exterior
- Parking: Detached 2-car garage; Garage door opener; Total of 2 parking spaces; Has garage
- Security: 24-hour security; Gated community
- Utilities: Sewer connected and paid; Not part of a PUD
- Home design: Condominium; Attached property; Single-story; One level; End unit
- Construction: One-story building
- Exterior features: 24-hour security; Gated community; Community security; Community sprinkler system; Community pool; In-ground community spa/hot tub; In-ground pool with safety fence; Golf course view; Manual irrigation; Fee simple land
Interior
- Kitchen: Dishwasher
- Flooring: Carpet; Tile
- Bathrooms: Two full bathrooms
- Heating & cooling: Central heating; Central air conditioning; Air conditioning
- Interior features: Fully furnished; Family room; Breakfast area; Great room; No fireplace
Neighborhood map
What this means for you Summary
Snapshot
- This is a 3-bed/2.0-bath condo listed at $475k.
Deal economics
- At list price, monthly cash flow is $31 ($368/yr) — positive.
- The deal already cash-flows at list — no discount required.
- Meets the 1% rule at list price ($5k rent vs $475k).
- Recommended offer: $461k (3.0% below list) — sets the bar for market timing.
- Cap rate 6.4% vs local median 3.3% in La Quinta — top-decile yield for the area; either an underpriced asset or a hidden risk that comps aren't pricing in. Stress-test before assuming the spread holds.
Location & tenants
- Location reads 58/100 on livability (#694 in CA) — a working-class tenant base; expect higher turnover. Strengths: commute A-, employment B+, housing B+; Watch: schools D, amenities F, cost of living F.
- Coachella Valley Unified (rural): math 12% / reading 23% proficiency, ranked #481 of 517 in CA (top 93%) — low school quality limits family demand, transient renter base, plan for 1-2y turnover; 79% free/reduced lunch — lower-income household profile, screen leases tightly.
- Market conditions: Rents rising fast (+6.5%/yr); 656 active listings in the ZIP; 40 comparable units currently listed for rent nearby; rentals lingering (median 44d on market — plan ~5-8 weeks vacancy on turnover, expect pricing pressure); 72% of comp listings sitting > 30 days — soft ceiling on asking rent; solid renter incomes; 9,195 units permitted in Riverside County in 2024 (1,512 in 5+ unit buildings).
- At $5,192/mo this rent would consume 63% of the median local household income ($99k/yr) (locally 1078% of renters already pay >50% of income on rent) — very limited rent-growth headroom before tenants either downsize or default.
Forward outlook
- Local home prices are declining (-3.0%/yr); year-one equity from $3k of loan paydown is wiped out by about $14k of value loss. Plan a longer hold.
- Riverside County population projected at +22% by 2050 — long-run rental-demand tailwind backs the buy-and-hold thesis.
Negotiation context
- It's been on market 37 days — a 3% lower offer ($461k) is reasonable based on typical stale-listing flexibility.
- 6 sale attempts since 21y ago with the ask held roughly flat each time — persistent listings suggest the price (not the market) is what's stuck; bring a comps-based counter.
- Current owner paid $360k; 32% above their basis — modest negotiation headroom, anchor on the comps not their cost.
Risks & watch-outs
- Climate carrying-cost: moderate wildfire risk; extreme-heat days projected 6→16/yr by 2055 (HVAC capex compounding) — expect insurance premiums to compound above CPI over the hold.
Questions for the listing agent
- It's been on market 37 days. Have you received any prior offers? Is the seller open to a 3% concession, seller financing, or rate buy-down credit?
- What does the HOA fee cover, when was the last increase, and are there any pending special assessments or reserve-fund shortfalls?
- Any open or pending special assessments — roof, HVAC, plumbing, elevator, façade? What's the per-unit balance and payoff schedule, and is the seller paying it off at close or rolling it to the buyer?
- Is there a deadline driving the sale (1031 exchange, divorce, estate, relocation)? That informs how much negotiation room exists.
- Schools are D-rated, which usually means shorter tenancies and higher turnover. Who's the typical renter profile here, and what's been the actual vacancy rate?
- The area grade is low — what's the realistic commute time and amenity access for the typical tenant pool here? Any planned neighborhood developments (good or bad) we should know about?
- What's the average days-on-market for RENTAL listings here right now (not sales)? A rising rental-DOM trend means longer vacancies and softer asking-rent achievability than the comps imply.
- What's the recent tenant-quality profile in this submarket — average credit score on applications, eviction rate, late-payment / NSF rate, and stable-employment percentage? A property-management company in the area should have these aggregated.
- How much new apartment / multifamily construction is in the pipeline within 1–3 miles? Heavy new supply (>2% of stock underway) typically softens rents 12–24 months out; light construction supports rent growth.
Investment metrics
- 1% rule
- 1.09% ✓
- Cap rate
- 6.37%
- Cash-on-cash
- 0.28%
- DSCR
- 1.01
- GRM
- 7.6
CMA / ARV
- ARV (median comp)
- $457,231
- List price
- $475,000
- Delta
- 3.89%
- Verdict
- FAIR
- Comps
- 20 within 1.0 mi
Projected returns pro-forma
-3.0% appreciation · 6.45% rent growth · sell at horizon
- IRR
- -11.1%
- Equity multiple
- 0.58×
- Total profit
- $-55,806
- Equity at exit
- $70,824
- IRR
- 3.4%
- Equity multiple
- 1.29×
- Total profit
- $38,359
- Equity at exit
- $41,069
Cash invested: $133,000 (down + closing). Projections, not guarantees.
Landlord ↔ Tenant lean methodology
- Overall (STATE)
- 18 Strongly Tenant-Friendly
- State California
- 18 Strongly Tenant-Friendly · D+13
- County
- — inherits STATE
- City
- — inherits STATE
ZIP-level market 92253
- Rents YoY
- 6.5%
- Active inventory
- 656
- Price-to-rent
- 7.6×
Monthly cashflow live
- Estimated rent
- $5,192 high interval (Pro) →
- Mortgage (P&I)
- −$2,491
- Tax from tax record
- −$588 /mo · $7,060/yr
- Insurance
- −$198
- HOA
- −$794
- Vacancy / Maint / Mgmt
- −$1,090
- Net cashflow
- $31
Break-even live
UW: 25.0% down · 7.5% · 30yr · 1.5% tax · 5.0% vac · 8.0% maint · 8.0% mgmt
Financing live
Cash to close
- Down payment
- $118,750
- Closing costs
- $14,250
- Reserves months
- —
- Total cash needed
- —
Loan-product check · same deal, 3 products live
Conventional
25% down · 7.5% · 30yr
- Down + closing
- —
- Monthly P&I
- —
- Monthly cashflow
- —
- DSCR
- —
- Eligible?
- —
Personal DTI + credit; lowest rate.
DSCR
20% down · 8.5% · 30yr
- Down + closing
- —
- Monthly P&I
- —
- Monthly cashflow
- —
- DSCR
- —
- Eligible?
- —
No personal income docs; deal must DSCR.
Hard money
10% down · 12.0% · 12mo
- Down + closing
- —
- Monthly P&I
- —
- Monthly cashflow
- —
- DSCR
- —
- Eligible?
- —
Short-term bridge; refi at stabilization.
Rent comps 40 comps
| Address | Beds | Baths | Sqft | Rent | $/sqft | DOM | Units | Dist |
|---|---|---|---|---|---|---|---|---|
| 55430 Laurel Vly La Quinta, CA | 3.0 | 2.0 | 1515 | $5,999 | $3.96 | 43d | 1 | 0.04mi |
| 55480 Laurel Vly La Quinta, CA | 3.0 | 2.0 | 2129 | $7,000 | $3.29 | 43d | 1 | 0.07mi |
| 55235 Laurel Vly La Quinta, CA | 3.0 | 2.0 | 1828 | $8,500 | $4.65 | 43d | 1 | 0.07mi |
| 55559 Winged Foot La Quinta, CA | 2.0 | 2.0 | 1288 | $2,900 | $2.25 | 43d | 1 | 0.13mi |
| 80450 Platinum Way La Quinta, CA | 3.0 | 2.5 | 2034 | $4,950 | $2.43 | 43d | 1 | 0.59mi |
| 80389 Redstone Way La Quinta, CA | 3.0 | 3.0 | 1960 | $3,200 | $1.63 | 24d | 1 | 0.62mi |
| 80377 Redstone Way La Quinta, CA | 3.0 | 2.0 | 1592 | $3,600 | $2.26 | 43d | 1 | 0.63mi |
| 80377 Redstone Way La Quinta, CA | 3.0 | 2.0 | 1592 | $3,600 | $2.26 | 16d | 1 | 0.63mi |
| 80118 Whisper Rock Way La Quinta, CA | 3.0 | 2.5 | 1960 | $4,000 | $2.04 | 3d | 1 | 0.68mi |
| 80601 Oak Tree La Quinta, CA | 2.0 | 2.0 | 1330 | $2,500 | $1.88 | 5d | 1 | 0.69mi |
| 55523 Oakhill La Quinta, CA | 2.0 | 2.0 | 1288 | $4,400 | $3.42 | 43d | 1 | 0.77mi |
| 54838 Oak-Tree La Quinta, CA | 3.0 | 2.0 | 1627 | $5,500 | $3.38 | 43d | 1 | 0.77mi |
| 54673 Oakhill La Quinta, CA | 2.0 | 2.0 | 1330 | $2,899 | $2.18 | 18d | 1 | 0.87mi |
| 56495 Jack Nicklaus Blvd La Quinta, CA | 3.0 | 3.0 | 2101 | $7,000 | $3.33 | 43d | 1 | 0.92mi |
| 54780 Shoal Crk La Quinta, CA | 3.0 | 2.0 | 1627 | $5,999 | $3.69 | 43d | 1 | 0.93mi |
| 80305 Cedar Crst La Quinta, CA | 3.0 | 3.0 | 2205 | $5,974 | $2.71 | 43d | 1 | 0.94mi |
| 55390 Tanglewood La Quinta, CA | 3.0 | 3.0 | 2204 | $5,222 | $2.37 | 43d | 1 | 0.98mi |
| 54635 Shoal Crk La Quinta, CA | 2.0 | 2.5 | 1627 | $7,000 | $4.30 | 43d | 1 | 1.01mi |
| 55459 Tanglewood La Quinta, CA | 2.0 | 2.0 | 1283 | $3,950 | $3.08 | 43d | 1 | 1.01mi |
| 55435 Tanglewood La Quinta, CA | 2.0 | 2.5 | 1410 | $2,600 | $1.84 | 10d | 1 | 1.01mi |
| 80937 Via Puerta Azul La Quinta, CA | 2.0 | 2.5 | 1557 | $4,999 | $3.21 | 43d | 1 | 1.02mi |
| 54575 Shoal Crk La Quinta, CA | 2.0 | 2.0 | 1549 | $6,500 | $4.20 | 43d | 1 | 1.03mi |
| 57420 Via Vis La Quinta, CA | 2.0 | 2.5 | 1561 | $3,600 | $2.31 | 43d | 1 | 1.04mi |
| 54492 Shoal Crk La Quinta, CA | 2.0 | 2.0 | 1549 | $10,000 | $6.46 | 18d | 1 | 1.05mi |
| 55111 Tanglewood La Quinta, CA | 3.0 | 2.5 | 1621 | $3,375 | $2.08 | 43d | 1 | 1.06mi |
| 55456 Firestone La Quinta, CA | 2.0 | 3.5 | 1492 | $2,750 | $1.84 | 3d | 1 | 1.08mi |
| 80897 Calle Azul La Quinta, CA | 3.0 | 3.0 | 1734 | $4,000 | $2.31 | 10d | 1 | 1.08mi |
| 80897 Calle Azul La Quinta, CA | 3.0 | 3.0 | 1734 | $4,000 | $2.31 | 43d | 1 | 1.08mi |
| 57461 Spanish Hills Ln La Quinta, CA | 3.0 | 3.0 | 2101 | $9,000 | $4.28 | 43d | 1 | 1.08mi |
| 80819 Calle Azul La Quinta, CA | 2.0 | 2.5 | 1557 | $3,274 | $2.10 | 43d | 1 | 1.08mi |
| 80777 Calle Azul La Quinta, CA | 3.0 | 2.5 | 1734 | $6,000 | $3.46 | 18d | 1 | 1.09mi |
| 79822 Olympia Flds La Quinta, CA | 3.0 | 3.0 | 1621 | $6,500 | $4.01 | 43d | 1 | 1.09mi |
| 55288 Firestone La Quinta, CA | 3.0 | 2.5 | 1621 | $6,500 | $4.01 | 43d | 1 | 1.11mi |
| 79791 Olympia Flds La Quinta, CA | 3.0 | 2.5 | 1621 | $6,000 | $3.70 | 43d | 1 | 1.11mi |
| 54137 Oakhill La Quinta, CA | 2.0 | 2.0 | 1549 | $2,600 | $1.68 | 18d | 1 | 1.11mi |
| 79804 Olympia Flds La Quinta, CA | 2.0 | 3.0 | 1472 | $2,899 | $1.97 | 43d | 1 | 1.11mi |
| 79773 Olympia Flds La Quinta, CA | 2.0 | 2.0 | 1492 | $5,000 | $3.35 | 43d | 1 | 1.12mi |
| 55108 Firestone La Quinta, CA | 2.0 | 2.5 | 1410 | $3,274 | $2.32 | 43d | 1 | 1.12mi |
| 55102 Firestone La Quinta, CA | 2.0 | 2.0 | 1492 | $4,200 | $2.82 | 43d | 1 | 1.12mi |
| 54970 Firestone La Quinta, CA | 2.0 | 2.5 | 1410 | $4,999 | $3.55 | 43d | 1 | 1.13mi |
HOA detail condo
- Monthly dues
- $794 · $9,528/yr
- Likely covers
- pool
- Assessments
- None detected in remarks — confirm with the listing agent.
Listing history 36 events
-
2026-06-18days on market $475,000 Active 37 DOM
-
2026-06-17days on market $475,000 Active 36 DOM
-
2026-06-16days on market $475,000 Active 35 DOM
-
2026-06-15days on market $475,000 Active 34 DOM
-
2026-06-13days on market $475,000 Active 32 DOM
-
2026-06-13days on market $475,000 Active 31 DOM
-
2026-06-09days on market $475,000 Active 28 DOM
-
2026-06-08days on market $475,000 Active 27 DOM
-
2026-06-07days on market $475,000 Active 26 DOM
-
2026-06-04days on market $475,000 Active 23 DOM
-
2026-06-03days on market $475,000 Active 22 DOM
-
2026-06-02days on market $475,000 Active 21 DOM
-
2026-06-01days on market $475,000 Active 20 DOM
-
2026-05-31days on market $475,000 Active 19 DOM
-
2026-05-12$475,000 Active 797-char remark
-
2026-03-01historical
-
2026-01-13price $439,000
-
2025-09-29$449,000 Active
-
2013-04-02historical
-
2012-11-21price $310,000
-
2012-04-02price $340,000
-
2012-03-18price $350,000
-
2011-10-11$360,000 Active
-
2011-03-19historical
-
2010-04-16price $350,000
-
2010-03-11$395,000 Active
-
2008-05-24historical
-
2008-02-25price $429,000
-
2007-01-04$459,000
-
2006-02-21soldstatus $360,045
-
2006-02-10historical
-
2005-08-19$399,000
-
1998-06-26soldstatus $115,000
-
1996-07-30soldstatus $120,000
-
1996-07-30soldstatus $250,000
-
1990-11-07soldstatus $142,000
ⓘ Source: listings_history table (triggers on properties + properties_extension) + one-shot
backfill from property_details.listing_events for pre-trigger history.
Tax reassessment forecast CA · Resets to sale price
- Current annual tax
- $7,060 · $588/mo
- Projected year-2 tax
- $7,060 · $588/mo
- Expected delta
- $0/yr ($0/mo · 0.0%)
ⓘ Screening estimate from a state-policy table — verify with the county assessor before closing.
Climate risk First Street
- Flood 1/10 Low FEMA zone X (unshaded) · 0% chance over 30 yrs
- Wildfire 5/10 Major
- Heat 9/10 Extreme 6 d/yr ≥114°F today · 16 d/yr by 30 yrs out
- Wind 1/10 Low
- Air quality 4/10 Moderate 4 unhealthy d/yr today · 5 by 30 yrs out
Nearby sold comps map
Loading sold comps map…
Walkable amenities ~0.75 mi
Loading nearby amenities…
Taxation est. · year 1
- Rental income
- $62,307
- − Mortgage interest
- −$26,607
- − Property taxes
- −$7,060
- − Insurance
- −$2,375
- − Repairs & maintenance
- −$4,985
- − Management
- −$4,985
- − HOA
- −$9,528
- − Depreciation
- −$13,818
- Taxable loss
- −$7,051
- Est. tax savings @ 24.0%
- +$1,692
- After-tax cash flow
- $2,060/yr
For passive investors: Depreciation is non-cash, so a rental often shows a tax loss while cash-flowing — sheltering income. Rental losses are passive: they offset passive income freely, and up to $25,000/yr can offset ordinary (W-2) income if you actively participate and your MAGI is under $100k (phasing out to $0 by $150k); unused losses carry forward. On sale, claimed depreciation is recaptured at up to 25%, and gains may owe capital-gains tax (a 1031 exchange can defer both). Figures are a year-1 estimate at your 24.0% rate — not tax advice; consult a CPA.
Schools (NCES district)
- District
- Coachella Valley Unified
- NCES district ID
- 0609070
- Math proficiency
- 12% ▼ -8.00%
- Reading proficiency
- 23% ▼ -6.00%
- Median HH income
- $37,683
- Composite
- 14.62/100
- National rank
- #9408
- State rank
- #481 of 517 in CA
Livability — La Quinta
- Score
- 58/100
- State rank
- #694
- US rank
- #21080
Category grades
Schools grade is shown separately in the Schools card above.
Census & demographics
- Census place
- La Quinta, CA
- County
- Riverside County · 2,287,001 people
- City population
- 38,666
- Metro
- Riverside-San Bernardino-Ontario, CA
- Population (ZIP)
- 38,666
- Household income
- $99,277
- Rent vs Own
- Severe rent burden
- 1078.0
Population outlook (Riverside County) Hauer SSP2
- Today (2025)
- 2,664,475 people
- By 2030
- 2,802,692 · +5.2%
- By 2040
- 3,050,904 · +14.5%
- By 2050
- 3,256,783 · +22.2%
- By 2075
- 3,655,058 · +37.2%
- By 2100
- 3,766,594 · +41.4%
Race, ethnicity, and origin ACS 2023
- Neighborhood character
- Diverse neighborhood (Simpson 0.57)
- Race & ethnicity
- White 54% Hispanic / Latino 37% Two or more races 19% Asian 4% Native American 1% Black 1%
- Hispanic origin (detail)
- Mexican 34%
- Common ancestry
- Romanian 2% Lithuanian 2% Slovak 1%
- Foreign-born
- 15% · Canada, China, Vietnam
- Languages at home
- 71% English-only · Spanish 24% Tagalog/Filipino 1% Chinese 1%
Political lean MEDSL · Riverside
- 2024 margin
- Toss-up / Even · D 48.0% · R 49.3% · Other 2.6%
- 2008→2024 swing
- -3.6pp toward R · 2008: 2.3pp · 2024: -1.3pp
- All cycles
- 2024: R+1.3 2020: D+8.0 2016: D+4.3 2012: R+0.4 2008: D+2.3
Not yet ingested
- Civics
- —
Market trends
- HPI YoY
- ▼ -263.65%
- Current HPI
- 281.8665
- Rent YoY
- ▲ 6.45%
- Metro
- Riverside-San Bernardino-Ontario, CA
- State GDP YoY
- ▲ 3.21%
- F500 in state
- 116
Industry mix (Fortune 500 HQ in CA)
| Industry | F500 HQs | Revenue |
|---|---|---|
| Technology | 27 | $1,492B |
|
||
| Financial Services | 3 | $174B |
|
||
| Retail | 3 | $44B |
|
||
| Insurance | 3 | $26B |
|
||
| Media / Entertainment | 2 | $115B |
|
||
| Pharmaceuticals / Biotech | 2 | $62B |
|
||
Price history
+234.5% since first listed22 events — show timeline
- 2026-05-12 Listed $475,000 GPSMLS
- 2026-03-01 Listing Removed — GPSMLS
- 2026-01-13 Price Changed $439,000 GPSMLS
- 2025-09-29 Listed $449,000 GPSMLS
- 2013-04-02 Listing Removed — GPSMLS
- 2012-11-21 Price Changed $310,000 GPSMLS
- 2012-04-02 Price Changed $340,000 GPSMLS
- 2012-03-18 Price Changed $350,000 GPSMLS
- 2011-10-11 Listed $360,000 GPSMLS
- 2011-03-19 Listing Removed — GPSMLS
- 2010-04-16 Price Changed $350,000 GPSMLS
- 2010-03-11 Listed $395,000 GPSMLS
- 2008-05-24 Listing Removed — GPSMLS
- 2008-02-25 Price Changed $429,000 GPSMLS
- 2007-01-04 Listed $459,000 GPSMLS
- 2006-02-21 Sold (Public Records) $360,045 Public Records
- 2006-02-10 Listing Removed — GPSMLS
- 2005-08-19 Listed $399,000 GPSMLS
- 1998-06-26 Sold (Public Records) $115,000 Public Records
- 1996-07-30 Sold (Public Records) $250,000 Public Records
- 1996-07-30 Sold (Public Records) $120,000 Public Records
- 1990-11-07 Sold (Public Records) $142,000 Public Records
Property tax history
+3.2%/yrLatest (2025): $7,060 · +1.9% YoY. Source: county tax records.
Cash-flow waterfall
monthlySold comps — $/sqft
last 12 mo · ≤1 miLoading sold comps…