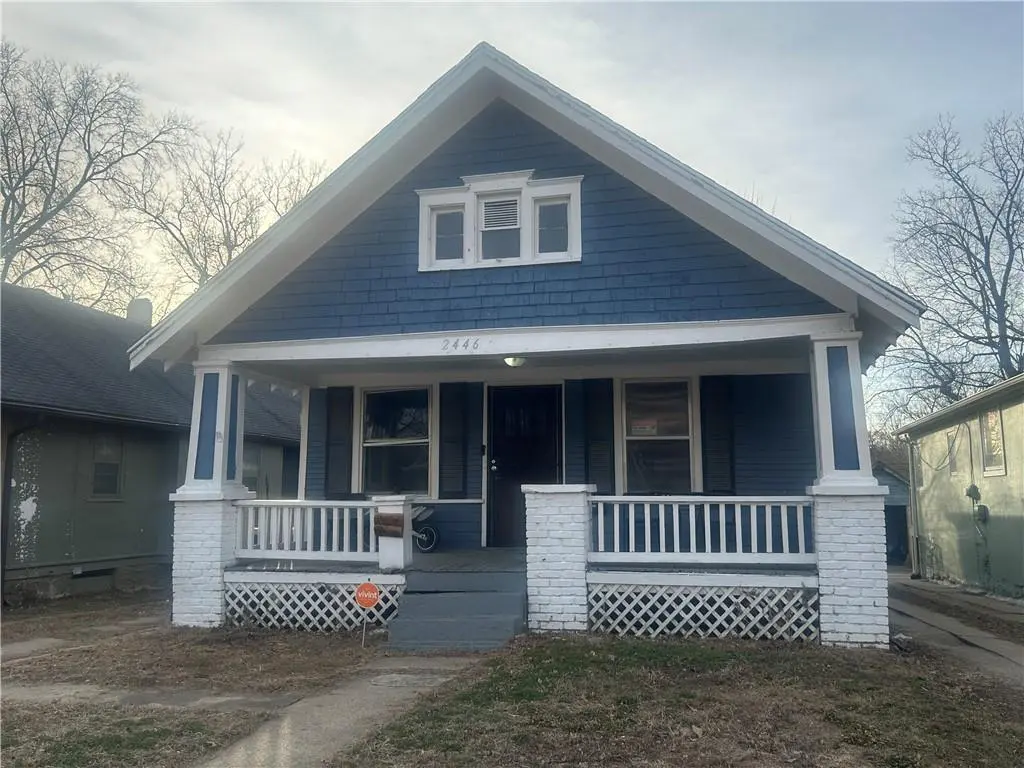
2446 Quincy St · Kansas City, MO
Flood risk 1/10 · Minimal
- FEMA flood zone
- X (unshaded)
- Chance of flooding over 30 yrs
- 0.0%
- Est. flood insurance / yr
- $473 – $860
Fire risk 1/10 · Minimal
- Est. fire insurance / yr
- $1,054 – $1,958
Heat risk 4/10 · Minor
- Hot days now (above 106°F)
- 7 days/yr
- Hot days in 30 yrs
- 17 days/yr
Wind risk 2/10 · Minimal
- Chance of severe wind over 30 yrs
- —
Air-quality risk 3/10 · Minor
- Unhealthy air days now
- 2 days/yr
- Unhealthy air days in 30 yrs
- 3 days/yr
Risk factors via First Street. Map © Google.
Why this score? — see what drove the B- grade
The composite is a weighted blend of 9 inputs, each scored 0–100. Each bar is that input's sub-score; the figure is the points it added to the 100-point composite (weight × sub-score).
- Cash flow +29.2/30.0
- DSCR +10.0/10.0
- 1% rule +9.0/10.0
- ARV discount +8.8/15.0
- Livability +3.9/5.0
- Rent growth +2.7/5.0
- Condition / age +2.5/5.0
- Schools +1.5/10.0
- Appreciation +1.1/10.0
$90,000
🖨 Deal sheet 📄 Offer letter ✓ Due diligence
Listing remarks MLS
Tenant Occupied Property until 12/31/26. Rent amount $1050. Please allow 24 hour notice. Contact listing agent for showings.
Key facts
- 5,249 sq ft lot
- Built 1919
- Listed 109 days
Neighborhood map
What this means for you Summary
Snapshot
- This is a 3-bed/1.0-bath single-family listed at $90k.
Deal economics
- At list price, monthly cash flow is $314 ($4k/yr) — positive.
- The deal already cash-flows at list — no discount required.
- Meets the 1% rule at list price ($1k rent vs $90k).
- Recommended offer: $82k (9.0% below list) — sets the bar for market timing.
- Cap rate 10.5% vs local median 3.9% in Kansas City — top-decile yield for the area; either an underpriced asset or a hidden risk that comps aren't pricing in. Stress-test before assuming the spread holds.
Location & tenants
- Location reads 78/100 on livability (#28 in MO, #2,671 nationally) — a middle-class / working-renter tenant base. Strengths: amenities A+, commute A+, cost of living A+; Watch: schools C-, crime F.
- Kansas City 33 (urban): math 12% / reading 24% proficiency, ranked #308 of 324 in MO (top 95%) — low school quality limits family demand, transient renter base, plan for 1-2y turnover; 75% free/reduced lunch — lower-income household profile, screen leases tightly.
- Market conditions: Rents flat; 108 active listings in the ZIP; 27 comparable units currently listed for rent nearby; rentals at typical pace (median 20d on market — plan ~3-4 weeks tenant-placement turnaround); lower-income renter base — watch delinquency; 4,002 units permitted in Jackson County in 2024 (2,271 in 5+ unit buildings).
- At $1,262/mo this rent would consume 46% of the median local household income ($33k/yr) (locally 1943% of renters already pay >50% of income on rent) — very limited rent-growth headroom before tenants either downsize or default.
Forward outlook
- Local home prices are declining (-3.0%/yr); year-one equity from $622 of loan paydown is wiped out by about $3k of value loss. Plan a longer hold.
- Jackson County population projected at +4% by 2050 — modest demand growth; plan on rents tracking national, not racing it.
Negotiation context
- It's been on market 110 days — a 9% lower offer ($82k) is reasonable based on typical stale-listing flexibility.
- 5 sale attempts since 2y ago; this cycle's ask has dropped $10k (10%) from the opening price — seller is motivated, your offer sets the floor, not the list.
Risks & watch-outs
- Watch-outs: built in 1919 — expect roof / HVAC / electrical / plumbing capex.
Questions for the listing agent
- It's been on market 110 days. Have you received any prior offers? Is the seller open to a 9% concession, seller financing, or rate buy-down credit?
- Built in 1919 — when were the roof, HVAC, electrical panel, plumbing, and water heater last replaced?
- Why hasn't it sold? Are there any deal-killer items the seller is aware of (foundation, flood, title, zoning, code violations)?
- Is there a deadline driving the sale (1031 exchange, divorce, estate, relocation)? That informs how much negotiation room exists.
- Crime grade is F in this area — have there been break-ins, vandalism, or insurance claims at this property in the last 3 years? What carrier currently insures it and at what premium?
- What's the average days-on-market for RENTAL listings here right now (not sales)? A rising rental-DOM trend means longer vacancies and softer asking-rent achievability than the comps imply.
- What's the recent tenant-quality profile in this submarket — average credit score on applications, eviction rate, late-payment / NSF rate, and stable-employment percentage? A property-management company in the area should have these aggregated.
- How much new for-sale + rental construction is in the pipeline within 1–3 miles? Heavy new supply typically softens prices + rents 12–24 months out; constrained supply supports both.
Investment metrics
- 1% rule
- 1.40% ✓
- Cap rate
- 10.47%
- Cash-on-cash
- 14.93%
- DSCR
- 1.66
- GRM
- 5.9
CMA / ARV
- ARV (median comp)
- $92,594
- List price
- $90,000
- Delta
- -2.80%
- Verdict
- FAIR
- Comps
- 20 within 1.0 mi
Show comp detail 12 sales within ~0.75 mi
| Address | Dist | Beds/Ba | Sqft | Sold | Price | $/sf | Match |
|---|---|---|---|---|---|---|---|
| 2451 Chelsea Ave | 0.14mi | 3/1.0 | 1,156 (-2%) | 5mo | $59,000 | $51 | 86 |
| 2416 Brighton Ave | 0.10mi | 3/1.5 | 1,122 (-5%) | 9mo | $90,000 | $80 | 78 |
| 2424 Cypress Ave | 0.39mi | 3/1.0 | 1,169 (-1%) | 5mo | $110,000 | $94 | 76 |
| 2451 Poplar Ave | 0.09mi | 3/1.0 | 1,042 (-12%) | 3mo | $52,000 | $50 | 74 |
| 2457 Poplar Ave | 0.09mi | 3/1.0 | 1,350 (+14%) | 2mo | $115,000 | $85 | 70 |
| 2722 Brighton Ave | 0.35mi | 4/1.5 (+1) | 1,168 (-1%) | 9mo | $120,000 | $103 | 68 |
| 2543 Drury Ave | 0.31mi | 2/1.0 (-1) | 1,077 (-9%) | 0mo | $100,000 | $93 | 66 |
| 2604 Drury Ave | 0.30mi | 3/1.5 | 1,287 (+9%) | 7mo | $70,000 | $54 | 62 |
| 2243 Spruce Ave | 0.54mi | 3/1.5 | 1,104 (-6%) | 7mo | $150,000 | $136 | 56 |
| 4711 E 17th St | 0.74mi | 2/1.0 (-1) | 1,155 (-2%) | 3mo | $74,000 | $64 | 55 |
| 2830 Cypress Ave | 0.60mi | 3/1.0 | 1,043 (-12%) | 0mo | $29,900 | $29 | 52 |
| 2636 Spruce St | 0.56mi | 4/2.0 (+1) | 1,282 (+9%) | 7mo | $199,000 | $155 | 44 |
Match score weights: distance 35% · size 25% · config 20% · recency 20%. Top-matched comps best support the ARV.
Projected returns pro-forma
-3.0% appreciation · 0.94% rent growth · sell at horizon
- IRR
- 3.0%
- Equity multiple
- 1.11×
- Total profit
- $2,881
- Equity at exit
- $13,419
- IRR
- 10.4%
- Equity multiple
- 1.73×
- Total profit
- $18,362
- Equity at exit
- $7,782
Cash invested: $25,200 (down + closing). Projections, not guarantees.
Landlord ↔ Tenant lean methodology
- Overall (STATE)
- 81 Strongly Landlord-Friendly
- State Missouri
- 81 Strongly Landlord-Friendly · R+10
- County
- — inherits STATE
- City
- — inherits STATE
ZIP-level market 64127
- Home prices YoY
- -2.6%
- Rents YoY
- 0.9%
- Active inventory
- 108
- Price-to-rent
- 5.9×
Monthly cashflow live
- Estimated rent
- $1,262 high interval (Pro) →
- Mortgage (P&I)
- −$472
- Tax from tax record
- −$174 /mo · $2,091/yr
- Insurance
- −$38
- HOA
- −$0
- Vacancy / Maint / Mgmt
- −$265
- Net cashflow
- $314
Break-even live
UW: 25.0% down · 7.5% · 30yr · 1.5% tax · 5.0% vac · 8.0% maint · 8.0% mgmt
Financing live
Cash to close
- Down payment
- $22,500
- Closing costs
- $2,700
- Reserves months
- —
- Total cash needed
- —
Loan-product check · same deal, 3 products live
Conventional
25% down · 7.5% · 30yr
- Down + closing
- —
- Monthly P&I
- —
- Monthly cashflow
- —
- DSCR
- —
- Eligible?
- —
Personal DTI + credit; lowest rate.
DSCR
20% down · 8.5% · 30yr
- Down + closing
- —
- Monthly P&I
- —
- Monthly cashflow
- —
- DSCR
- —
- Eligible?
- —
No personal income docs; deal must DSCR.
Hard money
10% down · 12.0% · 12mo
- Down + closing
- —
- Monthly P&I
- —
- Monthly cashflow
- —
- DSCR
- —
- Eligible?
- —
Short-term bridge; refi at stabilization.
Rent comps 27 comps
| Address | Beds | Baths | Sqft | Rent | $/sqft | DOM | Units | Dist |
|---|---|---|---|---|---|---|---|---|
| 2454 Cypress Ave Kansas City, MO | 3.0 | 1.0 | 800 | $1,300 | $1.62 | 3d | 1 | 0.38mi |
| 2855 Van Brunt Blvd Unit A Kansas City, MO | 2.0 | 1.0 | 744 | $1,080 | $1.45 | 43d | 1 | 0.54mi |
| 2447 Norton Ave Kansas City, MO | 2.0 | 1.0 | 800 | $976 | $1.22 | 16d | 1 | 0.58mi |
| 2424 Norton Ave Unit B Kansas City, MO | 3.0 | 1.0 | 982 | $1,150 | $1.17 | 16d | 1 | 0.61mi |
| 5108 E 30th St Kansas City, MO | 3.0 | 1.0 | 960 | $1,400 | $1.46 | 2d | 1 | 0.63mi |
| 1904 Elmwood Ave Kansas City, MO | 4.0 | 2.0 | 864 | $1,152 | $1.33 | 43d | 1 | 0.64mi |
| 1905 Kensington Ave Kansas City, MO | 3.0 | 2.0 | 1285 | $1,325 | $1.03 | 23d | 1 | 0.70mi |
| 5852 E 20th St Unit TOP-1724 Kansas City, MO | 3.0 | 1.5 | 1482 | $1,075 | $0.73 | 2d | 1 | 0.72mi |
| 3032 Elmwood Ave Kansas City, MO | 3.0 | 1.0 | 1027 | $1,275 | $1.24 | 7d | 1 | 0.78mi |
| 1805 Jackson Ave Kansas City, MO | 4.0 | 2.0 | 1250 | $1,250 | $1.00 | 43d | 1 | 0.84mi |
| 3118 Chelsea Ave Kansas City, MO | 2.0 | 1.0 | 864 | $980 | $1.13 | 43d | 1 | 0.84mi |
| 1603 Elmwood Ave Kansas City, MO | 2.0 | 1.0 | 1064 | $1,031 | $0.97 | 12d | 1 | 0.89mi |
| 2225 Askew Ave Kansas City, MO | 2.0 | 1.0 | 864 | $1,050 | $1.22 | 43d | 1 | 0.93mi |
| 2213 Askew Ave Kansas City, MO | 2.0 | 1.0 | 865 | $1,002 | $1.16 | 19d | 1 | 0.94mi |
| 2419 Bales Ave Kansas City, MO | 3.0 | 1.5 | 1116 | $1,500 | $1.34 | 2d | 1 | 0.95mi |
| 3243 Denver Dr Kansas City, MO | 1.0–3.0 | 1.0 | 862 | $1,226 | $1.42 | 43d | 1 | 0.96mi |
| 2413 College Ave Kansas City, MO | 2.0 | 2.0 | 1022 | $1,225 | $1.20 | 23d | 1 | 1.09mi |
| 3414 Elmwood Ave Kansas City, MO | 4.0 | 1.0 | 1109 | $1,300 | $1.17 | 16d | 1 | 1.21mi |
| 3332 Norton Ave Kansas City, MO | 3.0 | 1.0 | 1272 | $1,350 | $1.06 | 43d | 1 | 1.25mi |
| 3305 E 19th St Kansas City, MO | 2.0 | 1.0 | 1500 | $1,200 | $0.80 | 43d | 1 | 1.26mi |
| 3220 E 30th St Unit 1A Kansas City, MO | 2.0 | 1.0 | 1214 | $950 | $0.78 | 43d | 1 | 1.27mi |
| 3201 E 20th St Kansas City, MO | 2.0 | 1.0 | 900 | $1,050 | $1.17 | 23d | 1 | 1.27mi |
| 3437 Jackson Ave Kansas City, MO | 2.0 | 1.0 | 700 | $1,150 | $1.64 | 16d | 1 | 1.33mi |
| 2701 Benton Blvd Unit 2705-3 Kansas City, MO | 2.0 | 1.0 | 800 | $1,200 | $1.50 | 7d | 1 | 1.34mi |
| 2701 Benton Blvd Unit 2703-2 Kansas City, MO | 2.0 | 1.0 | 800 | $1,200 | $1.50 | 1d | 1 | 1.34mi |
| 3305 Askew Ave Kansas City, MO | 3.0 | 1.5 | 1428 | $1,450 | $1.02 | 23d | 1 | 1.36mi |
| 2900 E 21st St Kansas City, MO | 3.0 | 1.5 | 897 | $1,650 | $1.84 | 16d | 1 | 1.39mi |
Listing history 38 events
-
2026-06-18days on market $90,000 Active 110 DOM
-
2026-06-17days on market $90,000 Active 109 DOM
-
2026-06-16days on market $90,000 Active 108 DOM
-
2026-06-15days on market $90,000 Active 107 DOM
-
2026-06-13days on market $90,000 Active 105 DOM
-
2026-06-09days on market $90,000 Active 101 DOM
-
2026-06-08days on market $90,000 Active 100 DOM
-
2026-06-07days on market $90,000 Active 99 DOM
-
2026-06-05days on market $90,000 Active 96 DOM
-
2026-06-03days on market $90,000 Active 95 DOM
-
2026-06-02days on market $90,000 Active 94 DOM
-
2026-06-01days on market $90,000 Active 93 DOM
-
2026-05-31days on market $90,000 Active 92 DOM
-
2026-05-17price $90,000 124-char remark
Show marketing remark (124 chars)
Tenant Occupied Property until 12/31/26. Rent amount $1050. Please allow 24 hour notice. Contact listing agent for showings.
-
2026-03-01$100,000 Active 124-char remark
Show marketing remark (124 chars)
Tenant Occupied Property until 12/31/26. Rent amount $1050. Please allow 24 hour notice. Contact listing agent for showings.
-
2026-02-28historical $100,000 124-char remark
Show marketing remark (124 chars)
Tenant Occupied Property until 12/31/26. Rent amount $1050. Please allow 24 hour notice. Contact listing agent for showings.
-
2025-12-21historical $1,050
-
2025-11-12price $1,050
-
2025-11-01$1,095
-
2025-11-01historical $1,095
-
2025-10-19price $1,095
-
2025-08-31historical
-
2025-08-30$1,200
-
2025-07-07price $100,000
-
2025-06-12price $110,000
-
2025-05-29price $120,000
-
2025-05-17price $125,000
-
2025-03-28price $128,500
-
2025-03-13$130,000 Active
-
2025-01-11historical $1,195
-
2024-12-06price $1,195
-
2024-11-05price $1,250
-
2024-09-11$1,300
-
2022-08-10soldstatus
-
2022-07-31price $1,000
-
2021-12-30soldstatus
-
2003-09-12soldstatus
-
2001-01-08soldstatus
ⓘ Source: listings_history table (triggers on properties + properties_extension) + one-shot
backfill from property_details.listing_events for pre-trigger history.
Tax reassessment forecast MO · Resets to sale price
- Current annual tax
- $2,091 · $174/mo
- Projected year-2 tax
- $2,091 · $174/mo
- Expected delta
- $0/yr ($0/mo · 0.0%)
ⓘ Screening estimate from a state-policy table — verify with the county assessor before closing.
Climate risk First Street
- Flood 1/10 Low FEMA zone X (unshaded) · 0% chance over 30 yrs
- Wildfire 1/10 Low
- Heat 4/10 Moderate 7 d/yr ≥106°F today · 17 d/yr by 30 yrs out
- Wind 2/10 Low
- Air quality 3/10 Moderate 2 unhealthy d/yr today · 3 by 30 yrs out
Nearby sold comps map
Loading sold comps map…
Walkable amenities ~0.75 mi
Loading nearby amenities…
Taxation est. · year 1
- Rental income
- $15,149
- − Mortgage interest
- −$5,041
- − Property taxes
- −$2,091
- − Insurance
- −$450
- − Repairs & maintenance
- −$1,212
- − Management
- −$1,212
- − Depreciation
- −$2,618
- Taxable income
- $2,524
- Est. tax owed @ 24.0%
- −$606
- After-tax cash flow
- $3,157/yr
For passive investors: Depreciation is non-cash, so a rental often shows a tax loss while cash-flowing — sheltering income. Rental losses are passive: they offset passive income freely, and up to $25,000/yr can offset ordinary (W-2) income if you actively participate and your MAGI is under $100k (phasing out to $0 by $150k); unused losses carry forward. On sale, claimed depreciation is recaptured at up to 25%, and gains may owe capital-gains tax (a 1031 exchange can defer both). Figures are a year-1 estimate at your 24.0% rate — not tax advice; consult a CPA.
Schools (NCES district)
- District
- Kansas City 33
- NCES district ID
- 2916400
- Math proficiency
- 12% ▼ -8.00%
- Reading proficiency
- 24% ▬ 0.00%
- Median HH income
- $35,227
- Composite
- 14.8/100
- National rank
- #9387
- State rank
- #308 of 324 in MO
Livability — Kansas City
- Score
- 78/100
- State rank
- #28
- US rank
- #2671
Category grades
Schools grade is shown separately in the Schools card above.
Census & demographics
- Census place
- Kansas City, MO
- County
- Jackson County · 687,798 people
- City population
- 439,467
- Metro
- Kansas City, MO-KS
- Population (ZIP)
- 17,668
- Household income
- $33,111
- Rent vs Own
- Severe rent burden
- 1943.0
Population outlook (Jackson County) Hauer SSP2
- Today (2025)
- 719,589 people
- By 2030
- 731,456 · +1.6%
- By 2040
- 746,689 · +3.8%
- By 2050
- 749,289 · +4.1%
- By 2075
- 736,227 · +2.3%
- By 2100
- 668,210 · -7.1%
Race, ethnicity, and origin ACS 2023
- Neighborhood character
- Diverse neighborhood (Simpson 0.65)
- Race & ethnicity
- Black 42% Hispanic / Latino 40% Two or more races 13% White 12% Native American 1%
- Hispanic origin (detail)
- Mexican 28%
- Foreign-born
- 20% · Canada, Vietnam
- Languages at home
- 67% English-only · Spanish 29%
Political lean MEDSL · Jackson
- 2024 margin
- D (+19.3) · D 58.9% · R 39.5% · Other 1.6%
- 2008→2024 swing
- -6.1pp toward R · 2008: 25.4pp · 2024: 19.3pp
- All cycles
- 2024: D+19.3 2020: D+22.0 2016: D+16.6 2012: D+19.0 2008: D+25.4
Not yet ingested
- Civics
- —
Market trends
- HPI YoY
- ▼ -7.88%
- Current HPI
- 289.2468
- Rent YoY
- ▲ 0.94%
- Metro
- Kansas City, MO-KS
- State GDP YoY
- ▲ 1.84%
- F500 in state
- 20
Industry mix (Fortune 500 HQ in MO)
| Industry | F500 HQs | Revenue |
|---|---|---|
| Healthcare | 1 | $163B |
|
||
| Insurance | 1 | $21B |
|
||
| Industrial Technology | 1 | $17B |
|
||
| Retail | 1 | $16B |
|
||
| Industrial Distribution | 1 | $10B |
|
||
| Utilities | 1 | $9B |
|
||
Price history
+8900.0% since first listed25 events — show timeline
- 2026-05-17 Price Changed $90,000 Heartland MLS as Distributed by MLS Grid
- 2026-03-01 Listed $100,000 Heartland MLS as Distributed by MLS Grid
- 2026-02-28 Coming Soon $100,000 Heartland MLS as Distributed by MLS Grid
- 2025-12-21 Rental Removed $1,050 ZUMPER1
- 2025-11-12 Price Changed $1,050 ZUMPER1
- 2025-11-01 Listed for Rent $1,095 ZUMPER1
- 2025-11-01 Rental Removed $1,095 RenterWarehouse
- 2025-10-19 Price Changed $1,095 RenterWarehouse
- 2025-08-31 Listing Removed — Heartland MLS as Distributed by MLS Grid
- 2025-08-30 Listed for Rent $1,200 RenterWarehouse
- 2025-07-07 Price Changed $100,000 Heartland MLS as Distributed by MLS Grid
- 2025-06-12 Price Changed $110,000 Heartland MLS as Distributed by MLS Grid
- 2025-05-29 Price Changed $120,000 Heartland MLS as Distributed by MLS Grid
- 2025-05-17 Price Changed $125,000 Heartland MLS as Distributed by MLS Grid
- 2025-03-28 Price Changed $128,500 Heartland MLS as Distributed by MLS Grid
- 2025-03-13 Listed $130,000 Heartland MLS as Distributed by MLS Grid
- 2025-01-11 Rental Removed $1,195 RENTFEEDER
- 2024-12-06 Price Changed $1,195 RENTFEEDER
- 2024-11-05 Price Changed $1,250 RENTFEEDER
- 2024-09-11 Listed for Rent $1,300 RENTFEEDER
- 2022-08-10 Sold (Public Records) — Public Records
- 2022-07-31 Price Changed $1,000 RENT.
- 2021-12-30 Sold (Public Records) — Public Records
- 2003-09-12 Sold (Public Records) — Public Records
- 2001-01-08 Sold (Public Records) — Public Records
Property tax history
+17.7%/yrLatest (2025): $2,091 · +46.0% YoY. Source: county tax records.
Cash-flow waterfall
monthlySold comps — $/sqft
last 12 mo · ≤1 miLoading sold comps…