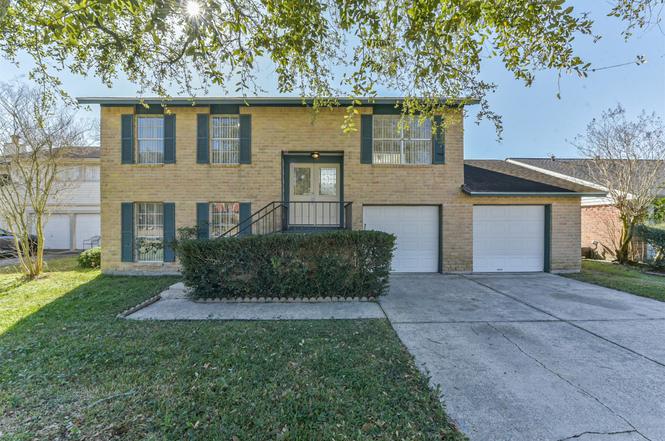
406 Mcconn Ct · Houston, TX
Flood risk 1/10 · Minimal
- FEMA flood zone
- X (unshaded)
- Chance of flooding over 30 yrs
- 0.0%
- Est. flood insurance / yr
- $507 – $1,088
Fire risk 3/10 · Minor
- Est. fire insurance / yr
- $1,222 – $2,270
Heat risk 9/10 · Severe
- Hot days now (above 107°F)
- 7 days/yr
- Hot days in 30 yrs
- 25 days/yr
Wind risk 9/10 · Severe
- Chance of severe wind over 30 yrs
- 99.0%
Air-quality risk 2/10 · Minimal
- Unhealthy air days now
- 1 days/yr
- Unhealthy air days in 30 yrs
- 2 days/yr
Risk factors via First Street. Map © Google.
Why this score? — see what drove the D+ grade
The composite is a weighted blend of 9 inputs, each scored 0–100. Each bar is that input's sub-score; the figure is the points it added to the 100-point composite (weight × sub-score).
- ARV discount +14.2/15.0
- Cash flow +8.2/30.0
- Appreciation +5.8/10.0
- Schools +4.6/10.0
- Livability +3.7/5.0
- 1% rule +3.2/10.0
- Rent growth +2.6/5.0
- Condition / age +2.5/5.0
- DSCR +2.2/10.0
$255,000
🖨 Deal sheet 📄 Offer letter ✓ Due diligence
Listing remarks
Welcome to 406 McConn Court in Webster—a well-maintained two-story home offering four bedrooms, two bathrooms, and a highly functional floor plan designed for everyday living. Fresh interior paint and recently updated carpet give the home a bright, move-in-ready feel. The main living areas flow comfortably, while the spacious bedrooms provide flexibility for family, guests, or a home office. Upstairs, enjoy a charming balcony—perfect for morning coffee or evening relaxation. The laundry room is conveniently located inside the home, adding to its practical appeal. Step outside to a generously sized backyard with plenty of room for outdoor entertaining, play, or future customizati
Key facts
- Charming balcony
- 7,200 sq ft lot
- 2 garage spots
Tags
Property features AI
Finance
- HOA & community: Association: Sterling Knoll; Annual association fee of $275; Community features include curbs
Exterior
- Parking: Attached 2-car garage
- Utilities: Public water; Public sewer
- Home design: Residential property; Built in 1978; Slab foundation; Composition roof
- Construction: Brick and wood siding construction
- Exterior features: Balcony; Deck; Patio; Private yard; Fenced backyard; Corner lot; Backs to greenbelt/park; Subdivision setting; Concrete road surface
Interior
- Kitchen: Dishwasher; Electric cooktop; Electric oven/range
- Bedrooms: Primary bedroom on the first floor (approx. 14 x 13); Three additional bedrooms on the second floor (approx. 10 x 10; 10 x 9; 9 x 9)
- Flooring: Carpet; Tile
- Bathrooms: 2 full bathrooms
- Heating & cooling: Central heating (electric); Central air conditioning (electric)
- Interior features: Ceiling fans; One fireplace
- Laundry & utility: Washer hookup; Electric dryer hookup; Gas dryer hookup
Neighborhood map
What this means for you Summary
Snapshot
- This is a 3-bed/2.0-bath single-family listed at $255k.
Deal economics
- At list price, monthly cash flow is $-238 ($-3k/yr) — negative.
- To cash-flow at today's rent, offer at most $213k (16.5% below list).
- To meet the 1% rule (rent ≥ 1% of price), the offer needs to be $210k (17.7% below list).
- Recommended offer: $210k (17.7% below list) — sets the bar for 1% rule.
- Cap rate 5.2% vs local median 3.2% in Houston — top-decile yield for the area; either an underpriced asset or a hidden risk that comps aren't pricing in. Stress-test before assuming the spread holds.
Location & tenants
- Location reads 74/100 on livability (#184 in TX, #4,771 nationally) — a middle-class / working-renter tenant base. Strengths: amenities A+, cost of living A+, housing A+; Watch: crime F.
- Clear Creek ISD (suburban): math 48% / reading 54% proficiency, ranked #114 of 826 in TX (top 14%) — acceptable for families but not a draw, mixed tenant base, ~2y average lease.
- Zoned schools: North Pointe El (math 47% / reading 47%, grade D-, #1,006 of 4,322 statewide, top 25%, 661 students, 49% FRL); Clear Brook H S (math 49% / reading 58%, grade C-, #428 of 1,632 statewide, top 27%, 2,347 students, 0% FRL) — zoned schools at 25% FRL track the district average.
- Market conditions: Rents flat; 207 active listings in the ZIP; 14 comparable units currently listed for rent nearby; rentals leasing fast (median 11d on market — plan ~1-2 weeks tenant-placement turnaround); 29,883 units permitted in Harris County in 2024 (8,621 in 5+ unit buildings).
- This rent runs 41% of the median local income ($61k/yr) — at the standard rent-burdened threshold; future hikes will face affordability resistance.
Forward outlook
- In year one you build about $6k of equity ($2k loan paydown + $4k appreciation (1.6% local appreciation)).
- Harris County population projected at +47% by 2050 — long-run rental-demand tailwind backs the buy-and-hold thesis.
- By year 6, paydown + projected appreciation supports a ~$32k cash-out refi (75% LTV) — recoverable capital for the next deal without selling this one.
Negotiation context
- It's been on market 66 days — a 6% lower offer ($240k) is reasonable based on typical stale-listing flexibility.
- 4 sale attempts since 25y ago with the ask held roughly flat each time — persistent listings suggest the price (not the market) is what's stuck; bring a comps-based counter.
Risks & watch-outs
- Climate carrying-cost: severe wind risk, 99% chance of damaging wind over 30y; extreme-heat days projected 7→25/yr by 2055 (HVAC capex compounding) — expect insurance premiums to compound above CPI over the hold.
Questions for the listing agent
- What do current leases actually rent for vs. the listed asking? Can we see a recent rent roll and the last 12 months of T-12 income?
- It's been on market 66 days. Have you received any prior offers? Is the seller open to a 18% concession, seller financing, or rate buy-down credit?
- Built in 1978 — when were the roof, HVAC, electrical panel, plumbing, and water heater last replaced?
- What does the HOA fee cover, when was the last increase, and are there any pending special assessments or reserve-fund shortfalls?
- Why hasn't it sold? Are there any deal-killer items the seller is aware of (foundation, flood, title, zoning, code violations)?
- Is there a deadline driving the sale (1031 exchange, divorce, estate, relocation)? That informs how much negotiation room exists.
- Schools are D-rated, which usually means shorter tenancies and higher turnover. Who's the typical renter profile here, and what's been the actual vacancy rate?
- Crime grade is F in this area — have there been break-ins, vandalism, or insurance claims at this property in the last 3 years? What carrier currently insures it and at what premium?
- The area grade is low — what's the realistic commute time and amenity access for the typical tenant pool here? Any planned neighborhood developments (good or bad) we should know about?
- What's the average days-on-market for RENTAL listings here right now (not sales)? A rising rental-DOM trend means longer vacancies and softer asking-rent achievability than the comps imply.
- What's the recent tenant-quality profile in this submarket — average credit score on applications, eviction rate, late-payment / NSF rate, and stable-employment percentage? A property-management company in the area should have these aggregated.
- How much new for-sale + rental construction is in the pipeline within 1–3 miles? Heavy new supply typically softens prices + rents 12–24 months out; constrained supply supports both.
Investment metrics
- 1% rule
- 0.82% ✗
- Cap rate
- 5.18%
- Cash-on-cash
- -3.99%
- DSCR
- 0.82
- GRM
- 10.1
CMA / ARV
- ARV (on-the-fly)
- $299,880
- Comps found
- 12
Show comp detail 12 sales within ~0.75 mi
| Address | Dist | Beds/Ba | Sqft | Sold | Price | $/sf | Match |
|---|---|---|---|---|---|---|---|
| 406 Mcconn Ct | 0.00mi | 4/2.0 (+1) | 1,764 (0%) | 0mo | $255,000 | $145 | 95 |
| 555 Shealy St | 0.27mi | 4/2.0 (+1) | 1,763 (-0%) | 1mo | $319,900 | $181 | 81 |
| 15210 Mcconn St | 0.13mi | 3/2.5 | 1,614 (-8%) | 10mo | $300,000 | $186 | 69 |
| 15807 Castorglen Dr | 0.62mi | 3/2.0 | 1,693 (-4%) | 1mo | $279,000 | $165 | 64 |
| 15403 Woodcote Ct | 0.65mi | 3/2.0 | 1,868 (+6%) | 1mo | $310,000 | $166 | 60 |
| 454 Buoy Rd | 0.64mi | 3/2.0 | 1,616 (-8%) | 1mo | $265,000 | $164 | 55 |
| 15715 Caprock Dr | 0.52mi | 3/2.0 | 1,531 (-13%) | 4mo | $265,000 | $173 | 51 |
| 15806 Roxton Ridge Dr | 0.64mi | 3/2.0 | 1,592 (-10%) | 10mo | $257,000 | $161 | 46 |
| 467 Reseda Dr | 0.67mi | 3/2.0 | 1,516 (-14%) | 5mo | $289,000 | $191 | 41 |
| 207 Lochnell Dr | 0.69mi | 4/2.5 (+1) | 1,972 (+12%) | 1mo | $335,000 | $170 | 40 |
| 403 Elder Vista Dr | 0.74mi | 3/2.0 | 1,556 (-12%) | 9mo | $269,999 | $174 | 38 |
| 15415 Woodhorn Dr | 0.74mi | 3/2.5 | 2,009 (+14%) | 8mo | $280,000 | $139 | 33 |
Match score weights: distance 35% · size 25% · config 20% · recency 20%. Top-matched comps best support the ARV.
Projected returns pro-forma
1.58% appreciation · 0.56% rent growth · sell at horizon
- IRR
- -2.1%
- Equity multiple
- 0.89×
- Total profit
- $-7,955
- Equity at exit
- $94,839
- IRR
- 1.3%
- Equity multiple
- 1.16×
- Total profit
- $11,526
- Equity at exit
- $132,289
Cash invested: $71,400 (down + closing). Projections, not guarantees.
Landlord ↔ Tenant lean methodology
- Overall (STATE)
- 87 Strongly Landlord-Friendly
- State Texas
- 87 Strongly Landlord-Friendly · R+5
- County
- — inherits STATE
- City
- — inherits STATE
ZIP-level market 77598
- Home prices YoY
- 0.5%
- Rents YoY
- 0.6%
- Active inventory
- 207
- Price-to-rent
- 10.1×
Monthly cashflow live
- Estimated rent
- $2,098 high interval (Pro) →
- Mortgage (P&I)
- −$1,337
- Tax from tax record
- −$428 /mo · $5,139/yr
- Insurance
- −$106
- HOA
- −$23
- Vacancy / Maint / Mgmt
- −$441
- Net cashflow
- $-238
Break-even live
UW: 25.0% down · 7.5% · 30yr · 1.5% tax · 5.0% vac · 8.0% maint · 8.0% mgmt
Financing live
Cash to close
- Down payment
- $63,750
- Closing costs
- $7,650
- Reserves months
- —
- Total cash needed
- —
Loan-product check · same deal, 3 products live
Conventional
25% down · 7.5% · 30yr
- Down + closing
- —
- Monthly P&I
- —
- Monthly cashflow
- —
- DSCR
- —
- Eligible?
- —
Personal DTI + credit; lowest rate.
DSCR
20% down · 8.5% · 30yr
- Down + closing
- —
- Monthly P&I
- —
- Monthly cashflow
- —
- DSCR
- —
- Eligible?
- —
No personal income docs; deal must DSCR.
Hard money
10% down · 12.0% · 12mo
- Down + closing
- —
- Monthly P&I
- —
- Monthly cashflow
- —
- DSCR
- —
- Eligible?
- —
Short-term bridge; refi at stabilization.
Rent comps 14 comps
| Address | Beds | Baths | Sqft | Rent | $/sqft | DOM | Units | Dist |
|---|---|---|---|---|---|---|---|---|
| 547 Shealy St Webster, TX | 4.0 | 2.0 | 1845 | $2,286 | $1.24 | 12d | 1 | 0.24mi |
| 15126 Silverman St Webster, TX | 3.0 | 2.0 | 1433 | $2,000 | $1.40 | 43d | 1 | 0.30mi |
| 15240 Galveston Rd Webster, TX | 2.0–3.0 | 1.5–2.5 | 1214 | $1,800 | $1.48 | 24d | 2 | 0.39mi |
| 15246 Galveston Rd Houston, TX | 3.0 | 2.0 | 1335 | $1,800 | $1.35 | 43d | 1 | 0.45mi |
| 707 El Dorado Blvd Unit 740 Houston, TX | 3.0 | 2.0 | 1287 | $1,601 | $1.24 | 2d | 1 | 0.76mi |
| 15902 Highway 3 Webster, TX | 1.0–3.0 | 1.0–2.0 | 921 | $1,920 | $2.08 | 1d | 66 | 0.78mi |
| 18833 Town Ridge Ln Unit 3174 Webster, TX | 3.0 | 2.0 | 2086 | $2,941 | $1.41 | 11d | 1 | 0.84mi |
| 18833 Town Ridge Ln Unit 3148 Webster, TX | 3.0 | 2.0 | 2086 | $2,898 | $1.39 | 2d | 1 | 0.84mi |
| 18833 Town Ridge Ln Unit 18866 Webster, TX | 3.0 | 2.0 | 2086 | $3,084 | $1.48 | 43d | 1 | 0.84mi |
| 946 Beachcomber Ln Houston, TX | 3.0 | 2.0 | 1872 | $1,995 | $1.07 | 43d | 1 | 1.17mi |
| 100 Texas Ave Webster, TX | 1.0–3.0 | 1.0–2.0 | 992 | $2,180 | $2.20 | 1d | 36 | 1.23mi |
| 16202 El Camino Real Unit 16235 Houston, TX | 3.0 | 2.0 | 1257 | $1,664 | $1.32 | 10d | 1 | 1.34mi |
| 19302 Glenwest Dr Friendswood, TX | 1.0–3.0 | 1.0–2.0 | 1048 | $2,787 | $2.66 | 1d | 31 | 1.36mi |
| 16202 El Camino Real Unit 3112 Houston, TX | 3.0 | 2.0 | 1257 | $1,632 | $1.30 | 2d | 1 | 1.42mi |
HOA detail
- Monthly dues
- $23 · $276/yr
Listing history 15 events
-
2026-05-13status Pending
-
2026-05-05historical Active Under Contract
-
2026-03-30status Pending
-
2026-03-20status Active
-
2026-03-19status Pending
-
2026-03-10status Pending
-
2026-02-16status Active
-
2026-02-08status Pending
-
2026-01-29$255,000 Active
-
2018-09-06soldstatus
-
2008-08-01soldstatus
-
2002-03-13historical
-
2002-03-08soldstatus
-
2001-11-16$124,900
-
1988-01-02soldstatus
ⓘ Source: listings_history table (triggers on properties + properties_extension) + one-shot
backfill from property_details.listing_events for pre-trigger history.
Tax reassessment forecast TX · Resets to sale price
- Current annual tax
- $5,139 · $428/mo
- Projected year-2 tax
- $5,139 · $428/mo
- Expected delta
- $0/yr ($0/mo · 0.0%)
ⓘ Screening estimate from a state-policy table — verify with the county assessor before closing.
Climate risk First Street
- Flood 1/10 Low FEMA zone X (unshaded) · 0% chance over 30 yrs
- Wildfire 3/10 Moderate
- Heat 9/10 Extreme 7 d/yr ≥107°F today · 25 d/yr by 30 yrs out
- Wind 9/10 Extreme 99% chance of damaging wind over 30 yrs
- Air quality 2/10 Low 1 unhealthy d/yr today · 2 by 30 yrs out
Nearby sold comps map
Loading sold comps map…
Walkable amenities ~0.75 mi
Loading nearby amenities…
Taxation est. · year 1
- Rental income
- $25,173
- − Mortgage interest
- −$14,284
- − Property taxes
- −$5,139
- − Insurance
- −$1,275
- − Repairs & maintenance
- −$2,014
- − Management
- −$2,014
- − HOA
- −$276
- − Depreciation
- −$7,418
- Taxable loss
- −$7,247
- Est. tax savings @ 24.0%
- +$1,739
- After-tax cash flow
- $-1,111/yr
For passive investors: Depreciation is non-cash, so a rental often shows a tax loss while cash-flowing — sheltering income. Rental losses are passive: they offset passive income freely, and up to $25,000/yr can offset ordinary (W-2) income if you actively participate and your MAGI is under $100k (phasing out to $0 by $150k); unused losses carry forward. On sale, claimed depreciation is recaptured at up to 25%, and gains may owe capital-gains tax (a 1031 exchange can defer both). Figures are a year-1 estimate at your 24.0% rate — not tax advice; consult a CPA.
Schools (NCES district)
- District
- Clear Creek ISD
- NCES district ID
- 4814280
- Math proficiency
- 48% ▼ -10.00%
- Reading proficiency
- 54% ▼ -4.00%
- Median HH income
- $80,240
- Composite
- 46.49/100
- National rank
- #2431
- State rank
- #114 of 826 in TX
Livability — Houston
- Score
- 74/100
- State rank
- #184
- US rank
- #4771
Category grades
Schools grade is shown separately in the Schools card above.
Census & demographics
- Census place
- Houston, TX
- County
- Harris County · 4,702,590 people
- City population
- 3,226,434
- Metro
- Houston-The Woodlands-Sugar Land, TX
- Population (ZIP)
- 26,110
- Household income
- $60,977
- Rent vs Own
- Severe rent burden
- 1983.0
Population outlook (Harris County) Hauer SSP2
- Today (2025)
- 5,571,493 people
- By 2030
- 6,089,821 · +9.3%
- By 2040
- 7,142,806 · +28.2%
- By 2050
- 8,185,864 · +46.9%
- By 2075
- 10,574,329 · +89.8%
- By 2100
- 12,109,958 · +117.4%
Race, ethnicity, and origin ACS 2023
- Neighborhood character
- Highly diverse neighborhood (Simpson 0.70)
- Race & ethnicity
- White 41% Hispanic / Latino 32% Black 14% Two or more races 13% Asian 8%
- Hispanic origin (detail)
- Mexican 18% Puerto Rican 2% Cuban 1%
- Common ancestry
- Italian 3% Lithuanian 3% Serbian 2%
- Foreign-born
- 19% · Canada, Vietnam, China
- Languages at home
- 69% English-only · Spanish 21% Vietnamese 2% Other Indo-European 2%
Political lean MEDSL · Harris
- 2024 margin
- Lean D (+5.5) · D 52.0% · R 46.4% · Other 1.6%
- 2008→2024 swing
- +3.9pp toward D · 2008: 1.6pp · 2024: 5.5pp
- All cycles
- 2024: D+5.5 2020: D+13.3 2016: D+12.4 2012: D+0.1 2008: D+1.6
Not yet ingested
- Civics
- —
Market trends
- HPI YoY
- ▲ 1.58%
- Current HPI
- 292.0815
- Rent YoY
- ▲ 0.56%
- Metro
- Houston-The Woodlands-Sugar Land, TX
- State GDP YoY
- ▲ 3.95%
- F500 in state
- 110
Industry mix (Fortune 500 HQ in TX)
| Industry | F500 HQs | Revenue |
|---|---|---|
| Energy | 16 | $1,198B |
|
||
| Technology | 5 | $198B |
|
||
| Engineering / Construction | 4 | $72B |
|
||
| Energy Services | 3 | $60B |
|
||
| Utilities | 3 | $41B |
|
||
| Healthcare | 2 | $330B |
|
||
Price history
+104.2% since first listed15 events — show timeline
- 2026-05-13 Pending — HARMLS
- 2026-05-05 Contingent — HARMLS
- 2026-03-30 Pending — HARMLS
- 2026-03-20 Relisted — HARMLS
- 2026-03-19 Pending — HARMLS
- 2026-03-10 Pending — HARMLS
- 2026-02-16 Relisted — HARMLS
- 2026-02-08 Pending — HARMLS
- 2026-01-29 Listed $255,000 HARMLS
- 2018-09-06 Sold (Public Records) — Public Records
- 2008-08-01 Sold (Public Records) — Public Records
- 2002-03-13 Listing Removed — HARMLS
- 2002-03-08 Sold (Public Records) — Public Records
- 2001-11-16 Listed $124,900 HARMLS
- 1988-01-02 Sold (Public Records) — Public Records
Property tax history
+3.0%/yrLatest (2025): $5,139 · +5.9% YoY. Source: county tax records.
Cash-flow waterfall
monthlySold comps — $/sqft
last 12 mo · ≤1 miLoading sold comps…