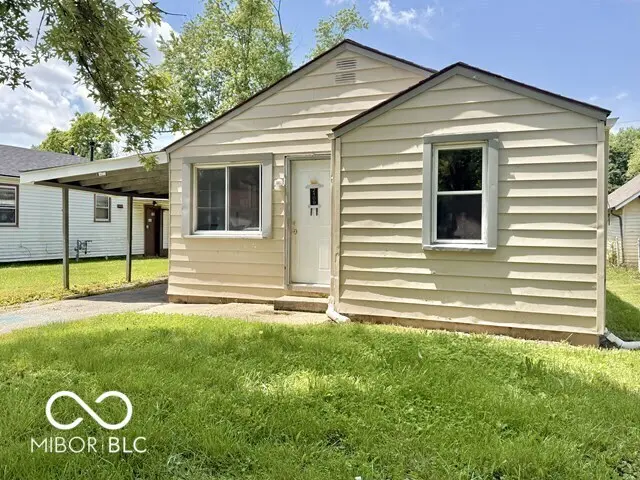
2109 S Delawanda Ave · Muncie, IN
Flood risk 1/10 · Minimal
- FEMA flood zone
- X (unshaded)
- Chance of flooding over 30 yrs
- 0.0%
- Est. flood insurance / yr
- $507 – $1,088
Fire risk 1/10 · Minimal
- Est. fire insurance / yr
- $717 – $1,331
Heat risk 3/10 · Minor
- Hot days now (above 101°F)
- 7 days/yr
- Hot days in 30 yrs
- 18 days/yr
Wind risk 2/10 · Minimal
- Chance of severe wind over 30 yrs
- 1.0%
Air-quality risk 3/10 · Minor
- Unhealthy air days now
- 2 days/yr
- Unhealthy air days in 30 yrs
- 3 days/yr
Risk factors via First Street. Map © Google.
Why this score? — see what drove the B- grade
The composite is a weighted blend of 9 inputs, each scored 0–100. Each bar is that input's sub-score; the figure is the points it added to the 100-point composite (weight × sub-score).
- Cash flow +30.0/30.0
- 1% rule +10.0/10.0
- DSCR +10.0/10.0
- ARV discount +7.5/15.0
- Rent growth +4.0/5.0
- Livability +4.0/5.0
- Condition / age +2.5/5.0
- Schools +1.7/10.0
- Appreciation +0.0/10.0
$70,000
🖨 Deal sheet 📄 Offer letter ✓ Due diligence
Listing remarks
Bring your vision and creativity to this 3-bedroom home on S Delawanda Ave! Featuring a spacious living area and a kitchen with plenty of built-in cabinets for storage, this property offers great potential to make it your own. Additional features include a carport and detached garage for added convenience. Come check out the possibilities this property has to offer!
Key facts
- Spacious living area
- Carport
- Built-in cabinets
Tags
Property features AI
Exterior
- Parking: Detached carport; Detached 2-car garage (576 sq ft)
- Utilities: Public water; Municipal sewer connected; Electricity connected; Natural gas available; Water connected
- Home design: Single-family residence; One story; East-facing; Property listed as fixer; Has a view
- Construction: Vinyl siding; Crawl space foundation
- Exterior features: Mature trees on the lot; No fence
Interior
- Kitchen: Electric oven; Refrigerator
- Bedrooms: Three bedrooms on the main level
- Flooring: Luxury vinyl plank
- Bathrooms: One full bathroom on the main level
- Heating & cooling: Forced air heating; Central air conditioning
- Interior features: Luxury vinyl plank flooring throughout main living areas; Family room and great room
- Laundry & utility: Main-level laundry
Neighborhood map
What this means for you Summary
Snapshot
- This is a 4-bed/1.0-bath single-family listed at $70k.
Deal economics
- At list price, monthly cash flow is $489 ($6k/yr) — positive.
- The deal already cash-flows at list — no discount required.
- Meets the 1% rule at list price ($1k rent vs $70k).
- Recommended offer: $69k (1.5% below list) — sets the bar for market timing.
- Cap rate 14.7% vs local median 6.0% in Muncie — top-decile yield for the area; either an underpriced asset or a hidden risk that comps aren't pricing in. Stress-test before assuming the spread holds.
Location & tenants
- Location reads 80/100 on livability (#18 in IN, #1,654 nationally) — a professional / high-income tenant draw. Strengths: amenities A+, commute A+, cost of living A+; Watch: crime F, employment F.
- Muncie Community Schools (urban): math 18% / reading 25% proficiency, ranked #275 of 301 in IN (top 91%) — low school quality limits family demand, transient renter base, plan for 1-2y turnover; 68% free/reduced lunch — lower-income household profile, screen leases tightly.
- Zoned schools: Grissom Elementary School (math 8% / reading 8%, grade F, #949 of 994 statewide, top 97%, 450 students, 85% FRL) — zoned schools average 85% FRL vs 68% district-wide (17 pts higher); higher-poverty schools than district average — tighter screening recommended.
- Zoned-school proficiency averages 8% at this address vs 22% district-wide (-14 pts) — the specific schools serving this property underperform the Muncie Community Schools average; the district grade overstates school quality for this exact location.
- Market conditions: Rents rising fast (+6.1%/yr); 148 active listings in the ZIP; 3 comparable units currently listed for rent nearby; rentals lingering (median 44d on market — plan ~5-8 weeks vacancy on turnover, expect pricing pressure); 100% of comp listings sitting > 30 days — soft ceiling on asking rent; 171 units permitted in Delaware County in 2024 (57 in 5+ unit buildings).
- This rent runs 31% of the median local income ($48k/yr) — at the standard rent-burdened threshold; future hikes will face affordability resistance.
Forward outlook
- Local home prices are declining (-3.0%/yr); year-one equity from $484 of loan paydown is wiped out by about $2k of value loss. Plan a longer hold.
- Delaware County population projected at -11% by 2050 — secular population decline; favor cash flow + early exit over multi-decade hold.
- At projected returns (-3.0% appreciation + 6.1% rent growth), your $20k cash investment doubles in ~4 years — after that, you're playing with house money.
Negotiation context
- It's been on market 21 days — a 2% lower offer ($69k) is reasonable based on typical stale-listing flexibility.
- 2 sale attempts since 2y ago with the ask held roughly flat each time — persistent listings suggest the price (not the market) is what's stuck; bring a comps-based counter.
Risks & watch-outs
- Watch-outs: built in 1945 — expect roof / HVAC / electrical / plumbing capex.
Questions for the listing agent
- Built in 1945 — when were the roof, HVAC, electrical panel, plumbing, and water heater last replaced?
- Is there a deadline driving the sale (1031 exchange, divorce, estate, relocation)? That informs how much negotiation room exists.
- Schools are D-rated, which usually means shorter tenancies and higher turnover. Who's the typical renter profile here, and what's been the actual vacancy rate?
- Crime grade is F in this area — have there been break-ins, vandalism, or insurance claims at this property in the last 3 years? What carrier currently insures it and at what premium?
- What's the average days-on-market for RENTAL listings here right now (not sales)? A rising rental-DOM trend means longer vacancies and softer asking-rent achievability than the comps imply.
- What's the recent tenant-quality profile in this submarket — average credit score on applications, eviction rate, late-payment / NSF rate, and stable-employment percentage? A property-management company in the area should have these aggregated.
- How much new for-sale + rental construction is in the pipeline within 1–3 miles? Heavy new supply typically softens prices + rents 12–24 months out; constrained supply supports both.
Investment metrics
- 1% rule
- 1.78% ✓
- Cap rate
- 14.68%
- Cash-on-cash
- 29.94%
- DSCR
- 2.33
- GRM
- 4.7
CMA / ARV
- ARV (on-the-fly)
- $140,832
- Comps found
- 12
Show comp detail 12 sales within ~0.75 mi
| Address | Dist | Beds/Ba | Sqft | Sold | Price | $/sf | Match |
|---|---|---|---|---|---|---|---|
| 1601 S Burlington Dr | 0.34mi | 3/1.5 (-1) | 1,504 (+2%) | 0mo | $92,000 | $61 | 73 |
| 2800 E 16th St | 0.19mi | 3/1.0 (-1) | 1,370 (-7%) | 3mo | $55,000 | $40 | 72 |
| 2212 S Delawanda Ave | 0.08mi | 3/1.0 (-1) | 1,406 (-4%) | 15mo | $40,000 | $28 | 72 |
| 2905 E Imperial Ln | 0.33mi | 3/1.5 (-1) | 1,472 (+0%) | 12mo | $141,000 | $96 | 67 |
| 2715 E 14th St | 0.18mi | 3/2.0 (-1) | 1,305 (-11%) | 3mo | $169,900 | $130 | 62 |
| 1910 S May Ave | 0.19mi | 4/2.0 | 1,640 (+12%) | 8mo | $93,000 | $57 | 61 |
| 1501 S Wall Ave | 0.52mi | 3/1.0 (-1) | 1,500 (+2%) | 17mo | $105,900 | $71 | 53 |
| 1217 S Helen Dr | 0.57mi | 3/2.0 (-1) | 1,632 (+11%) | 2mo | $179,500 | $110 | 44 |
| 1517 S Meeker Ave | 0.54mi | 4/2.0 | 1,584 (+8%) | 17mo | $60,000 | $38 | 43 |
| 1405 S Ribble Ave | 0.70mi | 3/1.0 (-1) | 1,555 (+6%) | 13mo | $150,000 | $96 | 42 |
| 2014 S Manville Rd | 0.37mi | 3/1.0 (-1) | 1,662 (+13%) | 16mo | $170,000 | $102 | 42 |
| 3005 E Esther Ln | 0.41mi | 3/1.5 (-1) | 1,288 (-12%) | 15mo | $178,000 | $138 | 41 |
Match score weights: distance 35% · size 25% · config 20% · recency 20%. Top-matched comps best support the ARV.
Projected returns pro-forma
-3.0% appreciation · 6.11% rent growth · sell at horizon
- IRR
- 28.0%
- Equity multiple
- 2.22×
- Total profit
- $23,847
- Equity at exit
- $10,437
- IRR
- 37.3%
- Equity multiple
- 5.01×
- Total profit
- $78,562
- Equity at exit
- $6,052
Cash invested: $19,600 (down + closing). Projections, not guarantees.
Landlord ↔ Tenant lean methodology
- Overall (STATE)
- 90 Strongly Landlord-Friendly
- State Indiana
- 90 Strongly Landlord-Friendly · R+11
- County
- — inherits STATE
- City
- — inherits STATE
ZIP-level market 47302
- Home prices YoY
- -12.6%
- Rents YoY
- 6.1%
- Active inventory
- 148
- Price-to-rent
- 4.7×
Monthly cashflow live
- Estimated rent
- $1,246 medium interval (Pro) →
- Mortgage (P&I)
- −$367
- Tax from tax record
- −$99 /mo · $1,192/yr
- Insurance
- −$29
- HOA
- −$0
- Vacancy / Maint / Mgmt
- −$262
- Net cashflow
- $489
Break-even live
UW: 25.0% down · 7.5% · 30yr · 1.5% tax · 5.0% vac · 8.0% maint · 8.0% mgmt
Financing live
Cash to close
- Down payment
- $17,500
- Closing costs
- $2,100
- Reserves months
- —
- Total cash needed
- —
Loan-product check · same deal, 3 products live
Conventional
25% down · 7.5% · 30yr
- Down + closing
- —
- Monthly P&I
- —
- Monthly cashflow
- —
- DSCR
- —
- Eligible?
- —
Personal DTI + credit; lowest rate.
DSCR
20% down · 8.5% · 30yr
- Down + closing
- —
- Monthly P&I
- —
- Monthly cashflow
- —
- DSCR
- —
- Eligible?
- —
No personal income docs; deal must DSCR.
Hard money
10% down · 12.0% · 12mo
- Down + closing
- —
- Monthly P&I
- —
- Monthly cashflow
- —
- DSCR
- —
- Eligible?
- —
Short-term bridge; refi at stabilization.
Rent comps 3 comps
| Address | Beds | Baths | Sqft | Rent | $/sqft | DOM | Units | Dist |
|---|---|---|---|---|---|---|---|---|
| 3508 E Memorial Dr Muncie, IN | 2.0–3.0 | 1.0–2.0 | 1029 | $1,091 | $1.06 | 43d | 7 | 0.36mi |
| 1802 E Willard St Muncie, IN | 3.0 | 2.5 | 1224 | $1,100 | $0.90 | 43d | 1 | 1.05mi |
| 1521 E Kirby Ave Muncie, IN | 2.0–4.0 | 1.0–2.0 | 972 | $1,500 | $1.54 | 43d | 2 | 1.31mi |
Listing history 21 events
-
2026-06-19days on market $70,000 Active 21 DOM
-
2026-06-18days on market $70,000 Active 20 DOM
-
2026-06-17days on market $70,000 Active 19 DOM
-
2026-06-16days on market $70,000 Active 18 DOM
-
2026-06-15days on market $70,000 Active 17 DOM
-
2026-06-14days on market $70,000 Active 15 DOM
-
2026-06-13days on market $70,000 Active 14 DOM
-
2026-06-10days on market $70,000 Active 12 DOM
-
2026-06-09days on market $70,000 Active 11 DOM
-
2026-06-08days on market $70,000 Active 10 DOM
-
2026-06-07days on market $70,000 Active 9 DOM
-
2026-06-05days on market $70,000 Active 6 DOM
-
2026-06-03days on market $70,000 Active 5 DOM
-
2026-06-02days on market $70,000 Active 4 DOM
-
2026-06-01days on market $70,000 Active 3 DOM
-
2026-05-31days on market $70,000 Active 2 DOM
-
2026-05-29$70,000 Active
-
2024-06-22historical $1,050
-
2024-06-06price $1,050
-
2024-06-06$1,100
-
2022-02-05price $975
ⓘ Source: listings_history table (triggers on properties + properties_extension) + one-shot
backfill from property_details.listing_events for pre-trigger history.
Tax reassessment forecast IN · Partial reset (capped growth)
- Current annual tax
- $1,192 · $99/mo
- Projected year-2 tax
- $1,192 · $99/mo
- Expected delta
- $0/yr ($0/mo · 0.0%)
ⓘ Screening estimate from a state-policy table — verify with the county assessor before closing.
Climate risk First Street
- Flood 1/10 Low FEMA zone X (unshaded) · 0% chance over 30 yrs
- Wildfire 1/10 Low
- Heat 3/10 Moderate 7 d/yr ≥101°F today · 18 d/yr by 30 yrs out
- Wind 2/10 Low 100% chance of damaging wind over 30 yrs
- Air quality 3/10 Moderate 2 unhealthy d/yr today · 3 by 30 yrs out
Nearby sold comps map
Loading sold comps map…
Walkable amenities ~0.75 mi
Loading nearby amenities…
Taxation est. · year 1
- Rental income
- $14,955
- − Mortgage interest
- −$3,921
- − Property taxes
- −$1,192
- − Insurance
- −$350
- − Repairs & maintenance
- −$1,196
- − Management
- −$1,196
- − Depreciation
- −$2,036
- Taxable income
- $5,063
- Est. tax owed @ 24.0%
- −$1,215
- After-tax cash flow
- $4,652/yr
For passive investors: Depreciation is non-cash, so a rental often shows a tax loss while cash-flowing — sheltering income. Rental losses are passive: they offset passive income freely, and up to $25,000/yr can offset ordinary (W-2) income if you actively participate and your MAGI is under $100k (phasing out to $0 by $150k); unused losses carry forward. On sale, claimed depreciation is recaptured at up to 25%, and gains may owe capital-gains tax (a 1031 exchange can defer both). Figures are a year-1 estimate at your 24.0% rate — not tax advice; consult a CPA.
Schools (NCES district)
- District
- Muncie Community Schools
- NCES district ID
- 1807320
- Math proficiency
- 18% ▼ -9.00%
- Reading proficiency
- 25% ▼ -4.00%
- Median HH income
- $30,052
- Composite
- 17.22/100
- National rank
- #9099
- State rank
- #275 of 301 in IN
Livability — Muncie
- Score
- 80/100
- State rank
- #18
- US rank
- #1654
Category grades
Schools grade is shown separately in the Schools card above.
Census & demographics
- Census place
- Muncie, IN
- County
- Delaware County · 84,658 people
- City population
- 84,658
- Metro
- Muncie, IN
- Population (ZIP)
- 25,473
- Household income
- $47,837
- Rent vs Own
- Severe rent burden
- 1150.0
Population outlook (Delaware County) Hauer SSP2
- Today (2025)
- 113,036 people
- By 2030
- 111,313 · -1.5%
- By 2040
- 106,432 · -5.8%
- By 2050
- 100,747 · -10.9%
- By 2075
- 91,000 · -19.5%
- By 2100
- 80,687 · -28.6%
Race, ethnicity, and origin ACS 2023
- Neighborhood character
- Predominantly White (84%)
- Race & ethnicity
- White 84% Two or more races 6% Black 6% Hispanic / Latino 4%
- Common ancestry
- Italian 2% Slovak 1% Romanian 1%
- Foreign-born
- 1% · Canada
- Languages at home
- 98% English-only · Spanish 1% German/W. Germanic 1%
Political lean MEDSL · Delaware
- 2024 margin
- R (+15.8) · D 41.2% · R 57.0% · Other 1.8%
- 2008→2024 swing
- -30.8pp toward R · 2008: 15.0pp · 2024: -15.8pp
- All cycles
- 2024: R+15.8 2020: R+13.2 2016: R+13.7 2012: D+3.1 2008: D+15.0
Not yet ingested
- Civics
- —
Market trends
- HPI YoY
- ▼ -30.32%
- Current HPI
- 210.431
- Rent YoY
- ▲ 6.11%
- Metro
- Muncie, IN
- State GDP YoY
- ▲ 2.90%
- F500 in state
- 18
Industry mix (Fortune 500 HQ in IN)
| Industry | F500 HQs | Revenue |
|---|---|---|
| Industrial Machinery | 2 | $37B |
|
||
| Healthcare | 1 | $177B |
|
||
| Pharmaceuticals | 1 | $45B |
|
||
| Metals / Steel | 1 | $18B |
|
||
| Agriculture | 1 | $17B |
|
||
| Packaging | 1 | $12B |
|
||
Price history
+6263.6% since first listed5 events — show timeline
- 2026-05-29 Listed $70,000 MIBOR as Distributed by MLS Grid
- 2024-06-22 Rental Removed $1,050 APPFOLIO
- 2024-06-06 Price Changed $1,050 APPFOLIO
- 2024-06-06 Listed for Rent $1,100 APPFOLIO
- 2022-02-05 Price Changed $975 RENT.
Property tax history
+9.2%/yrLatest (2024): $1,192 · +6.0% YoY. Source: county tax records.
Cash-flow waterfall
monthlySold comps — $/sqft
last 12 mo · ≤1 miLoading sold comps…