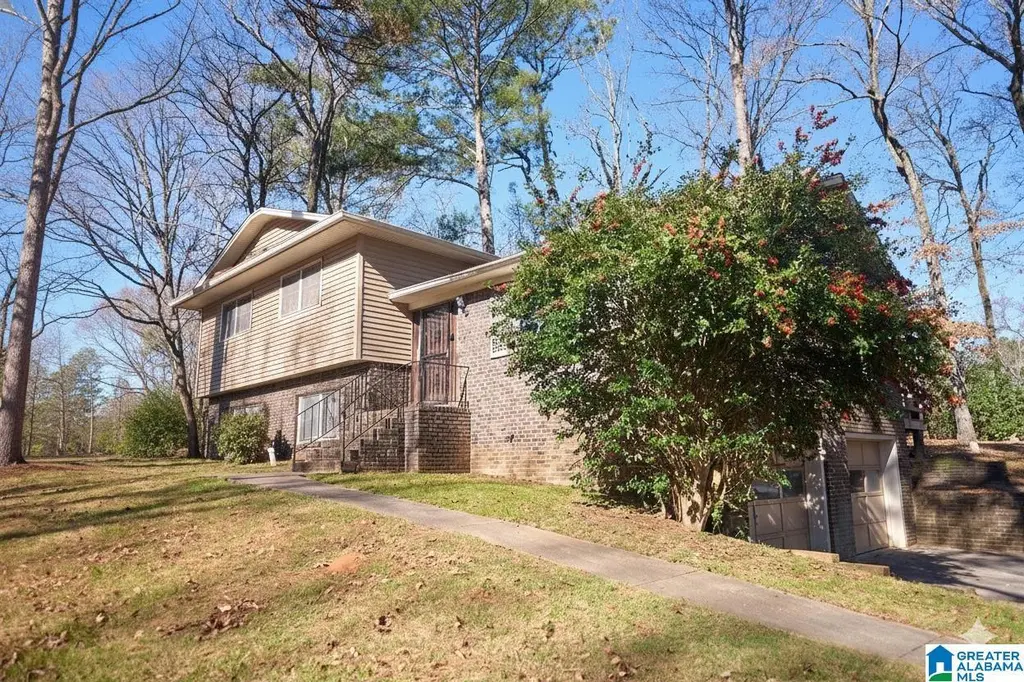
233 Sam Pate Dr · Birmingham, AL
Flood risk No data
- FEMA flood zone
- —
- Chance of flooding over 30 yrs
- —
- Est. flood insurance / yr
- —
Fire risk No data
- Est. fire insurance / yr
- —
Heat risk No data
- Hot days now (above threshold)
- —
- Hot days in 30 yrs
- —
Wind risk No data
- Chance of severe wind over 30 yrs
- —
Air-quality risk No data
- Unhealthy air days now
- —
- Unhealthy air days in 30 yrs
- —
Risk factors via First Street. Map © Google.
Why this score? — see what drove the D grade
The composite is a weighted blend of 9 inputs, each scored 0–100. Each bar is that input's sub-score; the figure is the points it added to the 100-point composite (weight × sub-score).
- Cash flow +13.1/30.0
- ARV discount +9.4/15.0
- DSCR +3.9/10.0
- 1% rule +3.7/10.0
- Livability +3.4/5.0
- Rent growth +3.3/5.0
- Condition / age +2.5/5.0
- Schools +0.9/10.0
- Appreciation +0.0/10.0
$185,000
🖨 Deal sheet 📄 Offer letter ✓ Due diligence
Listing remarks MLS
Welcome to 233 Sam Pate Dr! This 4-bedroom, 3-bath home features over 2,100 sq. ft. of living space, including a full basement perfect for a guest suite. Enjoy the durability of a 4-sided brick exterior and a large deck overlooking a wooded lot. Conveniently located near shopping and schools. A fantastic value for the square footage—schedule your showing today!
Key facts
- Large deck
- Near schools
- Wooded lot
Tags
Neighborhood map
What this means for you Summary
Snapshot
- This is a 4-bed/2.5-bath land listed at $185k.
Deal economics
- At list price, monthly cash flow is $-6 ($-76/yr) — negative.
- To cash-flow at today's rent, offer at most $184k (0.5% below list).
- To meet the 1% rule (rent ≥ 1% of price), the offer needs to be $161k (13.0% below list).
- Recommended offer: $161k (13.0% below list) — sets the bar for 1% rule.
Location & tenants
- Location reads 67/100 on livability (#78 in AL) — a middle-class / working-renter tenant base. Strengths: commute A+, cost of living A+, housing A+; Watch: amenities C-, schools F, crime F.
- Birmingham City (urban): math 4% / reading 20% proficiency, ranked #116 of 129 in AL (top 90%) — low school quality limits family demand, transient renter base, plan for 1-2y turnover; 82% free/reduced lunch — lower-income household profile, screen leases tightly.
- Market conditions: Rents rising (+3.0%/yr); 334 active listings in the ZIP; 2,114 units permitted in Jefferson County in 2024 (556 in 5+ unit buildings).
- This rent runs 37% of the median local income ($53k/yr) — at the standard rent-burdened threshold; future hikes will face affordability resistance.
Forward outlook
- Local home prices are declining (-3.0%/yr); year-one equity from $1k of loan paydown is wiped out by about $6k of value loss. Plan a longer hold.
- Jefferson County population projected to shrink 4% by 2050 — rents likely to lag national; underwrite the cash flow, not the appreciation.
Negotiation context
- It's been on market 177 days — a 12% lower offer ($163k) is reasonable based on typical stale-listing flexibility.
- 3 sale attempts since 8y ago with the ask held roughly flat each time — persistent listings suggest the price (not the market) is what's stuck; bring a comps-based counter.
Questions for the listing agent
- What do current leases actually rent for vs. the listed asking? Can we see a recent rent roll and the last 12 months of T-12 income?
- It's been on market 177 days. Have you received any prior offers? Is the seller open to a 13% concession, seller financing, or rate buy-down credit?
- Built in 1968 — when were the roof, HVAC, electrical panel, plumbing, and water heater last replaced?
- Why hasn't it sold? Are there any deal-killer items the seller is aware of (foundation, flood, title, zoning, code violations)?
- Is there a deadline driving the sale (1031 exchange, divorce, estate, relocation)? That informs how much negotiation room exists.
- Schools are F-rated, which usually means shorter tenancies and higher turnover. Who's the typical renter profile here, and what's been the actual vacancy rate?
- Crime grade is F in this area — have there been break-ins, vandalism, or insurance claims at this property in the last 3 years? What carrier currently insures it and at what premium?
- The area grade is low — what's the realistic commute time and amenity access for the typical tenant pool here? Any planned neighborhood developments (good or bad) we should know about?
- What's the average days-on-market for RENTAL listings here right now (not sales)? A rising rental-DOM trend means longer vacancies and softer asking-rent achievability than the comps imply.
- What's the recent tenant-quality profile in this submarket — average credit score on applications, eviction rate, late-payment / NSF rate, and stable-employment percentage? A property-management company in the area should have these aggregated.
- How much new for-sale + rental construction is in the pipeline within 1–3 miles? Heavy new supply typically softens prices + rents 12–24 months out; constrained supply supports both.
Investment metrics
- 1% rule
- 0.87% ✗
- Cap rate
- 6.25%
- Cash-on-cash
- -0.15%
- DSCR
- 0.99
- GRM
- 9.6
CMA / ARV
- ARV (median comp)
- $192,932
- List price
- $185,000
- Delta
- -4.11%
- Verdict
- FAIR
- Comps
- 20 within 1.0 mi
Projected returns pro-forma
-3.0% appreciation · 3.04% rent growth · sell at horizon
- IRR
- -16.5%
- Equity multiple
- 0.42×
- Total profit
- $-30,294
- Equity at exit
- $27,584
- IRR
- -8.2%
- Equity multiple
- 0.49×
- Total profit
- $-26,537
- Equity at exit
- $15,995
Cash invested: $51,800 (down + closing). Projections, not guarantees.
Landlord ↔ Tenant lean methodology
- Overall (STATE)
- 90 Strongly Landlord-Friendly
- State Alabama
- 90 Strongly Landlord-Friendly · R+15
- County
- — inherits STATE
- City
- — inherits STATE
ZIP-level market 35215
- Home prices YoY
- -34.4%
- Rents YoY
- 3.0%
- Active inventory
- 334
- Price-to-rent
- 9.6×
Monthly cashflow live
- Estimated rent
- $1,610 medium interval (Pro) →
- Mortgage (P&I)
- −$970
- Tax est. 1.5%
- −$231 /mo · $2,775/yr
- Insurance
- −$77
- HOA
- −$0
- Vacancy / Maint / Mgmt
- −$338
- Net cashflow
- $-6
Break-even live
Sensitivity live
| Price | -10% $121 | -5% $58 | +0% $-6 | +5% $-70 | +10% $-134 |
|---|---|---|---|---|---|
| Rent | -10% $-134 | -5% $-70 | +0% $-6 | +5% $57 | +10% $121 |
| Rate | -1.0pp $87 | -0.5pp $41 | base $-6 | +0.5pp $-54 | +1.0pp $-103 |
UW: 25.0% down · 7.5% · 30yr · 1.5% tax · 5.0% vac · 8.0% maint · 8.0% mgmt
Financing live
Cash to close
- Down payment
- $46,250
- Closing costs
- $5,550
- Reserves months
- —
- Total cash needed
- —
Loan-product check · same deal, 3 products live
Conventional
25% down · 7.5% · 30yr
- Down + closing
- —
- Monthly P&I
- —
- Monthly cashflow
- —
- DSCR
- —
- Eligible?
- —
Personal DTI + credit; lowest rate.
DSCR
20% down · 8.5% · 30yr
- Down + closing
- —
- Monthly P&I
- —
- Monthly cashflow
- —
- DSCR
- —
- Eligible?
- —
No personal income docs; deal must DSCR.
Hard money
10% down · 12.0% · 12mo
- Down + closing
- —
- Monthly P&I
- —
- Monthly cashflow
- —
- DSCR
- —
- Eligible?
- —
Short-term bridge; refi at stabilization.
Listing history 22 events
-
2026-06-18days on market $185,000 Active 177 DOM
-
2026-06-17days on market $185,000 Active 176 DOM
-
2026-06-16days on market $185,000 Active 175 DOM
-
2026-06-15days on market $185,000 Active 174 DOM
-
2026-06-13days on market $185,000 Active 172 DOM
-
2026-06-10days on market $185,000 Active 169 DOM
-
2026-06-09days on market $185,000 Active 168 DOM
-
2026-06-08days on market $185,000 Active 167 DOM
-
2026-06-07days on market $185,000 Active 166 DOM
-
2026-06-03days on market $185,000 Active 162 DOM
-
2026-06-02days on market $185,000 Active 161 DOM
-
2026-06-01days on market $185,000 Active 160 DOM
-
2026-05-31days on market $185,000 Active 159 DOM
-
2025-12-18$185,000 Active 369-char remark
Show marketing remark (369 chars)
Welcome to 233 Sam Pate Dr! This 4-bedroom, 3-bath home features over 2,100 sq. ft. of living space, including a full basement perfect for a guest suite. Enjoy the durability of a 4-sided brick exterior and a large deck overlooking a wooded lot. Conveniently located near shopping and schools. A fantastic value for the square footage—schedule your showing today!
-
2019-07-03soldstatus $164,900 Sold 403-char remark
Show marketing remark (403 chars)
Don't miss this large, updated, 4 bedroom, 3 bath home. This home sits back beautifully on a large lot. The home has been completely renovated, and has new stainless steel appliances and hardwood laminate throughout. The bathrooms are completely remodeled with beautiful tile. Enjoy the outdoors on the large deck overlooking the fenced backyard or enjoy nature on the covered front porch. Welcome home!
-
2019-04-22historical Contingent 403-char remark
Show marketing remark (403 chars)
Don't miss this large, updated, 4 bedroom, 3 bath home. This home sits back beautifully on a large lot. The home has been completely renovated, and has new stainless steel appliances and hardwood laminate throughout. The bathrooms are completely remodeled with beautiful tile. Enjoy the outdoors on the large deck overlooking the fenced backyard or enjoy nature on the covered front porch. Welcome home!
-
2019-04-20$164,900 Active 403-char remark
Show marketing remark (403 chars)
Don't miss this large, updated, 4 bedroom, 3 bath home. This home sits back beautifully on a large lot. The home has been completely renovated, and has new stainless steel appliances and hardwood laminate throughout. The bathrooms are completely remodeled with beautiful tile. Enjoy the outdoors on the large deck overlooking the fenced backyard or enjoy nature on the covered front porch. Welcome home!
-
2018-11-09soldstatus $50,010 Sold
-
2018-10-12historical Contingent
-
2018-10-06$47,250 Active
-
2018-07-11soldstatus $65,139
-
2004-07-09soldstatus $125,000
ⓘ Source: listings_history table (triggers on properties + properties_extension) + one-shot
backfill from property_details.listing_events for pre-trigger history.
Nearby sold comps map
Loading sold comps map…
Walkable amenities ~0.75 mi
Loading nearby amenities…
Taxation est. · year 1
- Rental income
- $19,323
- − Mortgage interest
- −$10,363
- − Property taxes
- −$2,775
- − Insurance
- −$925
- − Repairs & maintenance
- −$1,546
- − Management
- −$1,546
- − Depreciation
- −$5,382
- Taxable loss
- −$3,213
- Est. tax savings @ 24.0%
- +$771
- After-tax cash flow
- $695/yr
For passive investors: Depreciation is non-cash, so a rental often shows a tax loss while cash-flowing — sheltering income. Rental losses are passive: they offset passive income freely, and up to $25,000/yr can offset ordinary (W-2) income if you actively participate and your MAGI is under $100k (phasing out to $0 by $150k); unused losses carry forward. On sale, claimed depreciation is recaptured at up to 25%, and gains may owe capital-gains tax (a 1031 exchange can defer both). Figures are a year-1 estimate at your 24.0% rate — not tax advice; consult a CPA.
Schools (NCES district)
- District
- Birmingham City
- NCES district ID
- 0100390
- Math proficiency
- 4% ▼ -17.00%
- Reading proficiency
- 20% ▼ -4.00%
- Median HH income
- $31,988
- Composite
- 9.49/100
- National rank
- #9850
- State rank
- #116 of 129 in AL
Livability — Birmingham
- Score
- 67/100
- State rank
- #78
- US rank
- #10412
Category grades
Schools grade is shown separately in the Schools card above.
Census & demographics
- Census place
- Birmingham, AL
- County
- Jefferson County · 527,445 people
- City population
- 210,422
- Metro
- Birmingham-Hoover, AL
- Population (ZIP)
- 43,903
- Household income
- $52,793
- Rent vs Own
- Severe rent burden
- 1729.0
Population outlook (Jefferson County) Hauer SSP2
- Today (2025)
- 669,185 people
- By 2030
- 669,694 · +0.1%
- By 2040
- 661,388 · -1.2%
- By 2050
- 643,086 · -3.9%
- By 2075
- 577,267 · -13.7%
- By 2100
- 474,758 · -29.1%
Race, ethnicity, and origin ACS 2023
- Neighborhood character
- Predominantly Black (75%)
- Race & ethnicity
- Black 75% White 15% Hispanic / Latino 7% Two or more races 3%
- Hispanic origin (detail)
- Mexican 4%
- Common ancestry
- Lithuanian 1% Italian 1% Slovak 1%
- Foreign-born
- 4% · Canada
- Languages at home
- 92% English-only · Spanish 7%
Political lean MEDSL · Jefferson
- 2024 margin
- D (+10.4) · D 54.6% · R 44.2% · Other 1.2%
- 2008→2024 swing
- +5.4pp toward D · 2008: 5.1pp · 2024: 10.4pp
- All cycles
- 2024: D+10.4 2020: D+13.2 2016: D+7.2 2012: D+6.0 2008: D+5.1
Not yet ingested
- Civics
- —
Market trends
- HPI YoY
- ▼ -112.97%
- Current HPI
- 215.0607
- Rent YoY
- ▲ 3.04%
- Metro
- Birmingham-Hoover, AL
- State GDP YoY
- ▲ 2.94%
- F500 in state
- 4
Industry mix (Fortune 500 HQ in AL)
| Industry | F500 HQs | Revenue |
|---|---|---|
| Financial Services | 1 | $8B |
|
||
| Healthcare | 1 | $5B |
|
||
Price history
+48.0% since first listed9 events — show timeline
- 2025-12-18 Listed $185,000 Greater Alabama MLS
- 2019-07-03 Sold (MLS) $164,900 Greater Alabama MLS
- 2019-04-22 Contingent — Greater Alabama MLS
- 2019-04-20 Listed $164,900 Greater Alabama MLS
- 2018-11-09 Sold (MLS) $50,010 Greater Alabama MLS
- 2018-10-12 Contingent — Greater Alabama MLS
- 2018-10-06 Listed $47,250 Greater Alabama MLS
- 2018-07-11 Sold (Public Records) $65,139 Public Records
- 2004-07-09 Sold (Public Records) $125,000 Public Records
Property tax history
+10.3%/yrLatest (2025): $209 · +0.0% YoY. Source: county tax records.
Cash-flow waterfall
monthlySold comps — $/sqft
last 12 mo · ≤1 miLoading sold comps…