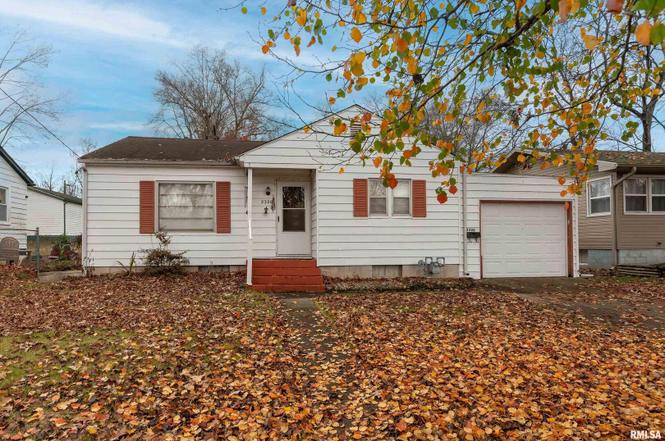
2320 Mccord St · Murphysboro, IL
Flood risk 1/10 · Minimal
- FEMA flood zone
- X (unshaded)
- Chance of flooding over 30 yrs
- 0.0%
- Est. flood insurance / yr
- $473 – $860
Fire risk 1/10 · Minimal
- Est. fire insurance / yr
- $804 – $1,492
Heat risk 5/10 · Moderate
- Hot days now (above 107°F)
- 7 days/yr
- Hot days in 30 yrs
- 21 days/yr
Wind risk 2/10 · Minimal
- Chance of severe wind over 30 yrs
- 2.0%
Air-quality risk 2/10 · Minimal
- Unhealthy air days now
- 0 days/yr
- Unhealthy air days in 30 yrs
- 2 days/yr
Risk factors via First Street. Map © Google.
Why this score? — see what drove the C- grade
The composite is a weighted blend of 9 inputs, each scored 0–100. Each bar is that input's sub-score; the figure is the points it added to the 100-point composite (weight × sub-score).
- Cash flow +27.4/30.0
- DSCR +9.5/10.0
- 1% rule +6.8/10.0
- Livability +2.7/5.0
- Rent growth +2.5/5.0
- Condition / age +2.5/5.0
- Schools +0.8/10.0
- ARV discount +0.0/15.0
- Appreciation +0.0/10.0
$69,900
🖨 Deal sheet 📄 Offer letter ✓ Due diligence
Listing remarks
Take a look at this adorable 2 bedroom bungalow! It has been well maintained with a newer roof, new appliances, hardwood flooring throughout, and its move in ready. There is a full unnfinished basement, large lot and a one car garage. This wont last long! Call for your showing today!
Key facts
- Hardwood flooring
- Newer roof
- Large lot
Tags
Property features AI
Finance
- Other: Property parcel number 14-08-129-015; Tax exemptions: Homeowner and Returning Veteran
Exterior
- Parking: Attached garage (1-car)
- Utilities: Public water; Public sewer
- Home design: Detached single-family home; Built before 1978 (age approx. 71–80 years)
- Construction: Block, vinyl siding, and frame construction
- Exterior features: Lot dimensions approximately 50 x 240; Lot with unspecified/other features
Interior
- Kitchen: Range; Refrigerator
- Bedrooms: 2 bedrooms (both on the main level)
- Flooring: Hardwood floors in kitchen, living room, and one bedroom; Carpet in master bedroom
- Bathrooms: 1 full bathroom
- Heating & cooling: Forced air heat (natural gas); Central air conditioning
- Interior features: Full unfinished basement with egress window
Neighborhood map
What this means for you Summary
Snapshot
- This is a 1-bed/1.0-bath single-family listed at $70k.
Deal economics
- At list price, monthly cash flow is $203 ($2k/yr) — positive.
- The deal already cash-flows at list — no discount required.
- Meets the 1% rule at list price ($825 rent vs $70k).
- Recommended offer: $69k (1.5% below list) — sets the bar for market timing.
- Cap rate 9.8% vs local median 6.2% in Murphysboro — top-decile yield for the area; either an underpriced asset or a hidden risk that comps aren't pricing in. Stress-test before assuming the spread holds.
Location & tenants
- Location reads 54/100 on livability (#1,265 in IL) — a working-class tenant base; expect higher turnover. Strengths: cost of living A+, housing A-; Watch: crime D-, amenities F, commute F.
- Murphysboro CUSD 186 (town): math 9% / reading 10% proficiency, ranked #585 of 620 in IL (top 94%) — low school quality limits family demand, transient renter base, plan for 1-2y turnover; 62% free/reduced lunch — lower-income household profile, screen leases tightly.
- Zoned schools: Murphysboro Middle School (math 4% / reading 6%, grade F, #636 of 665 statewide, top 98%, 444 students, 0% FRL); Murphysboro High School (math 17% / reading 17%, grade F, #430 of 693 statewide, top 66%, 598 students, 0% FRL) — zoned schools average 0% FRL vs 62% district-wide (62 pts lower); this property's tenant base skews higher-income than the district average.
- Market conditions: 79 active listings in the ZIP; 1 comparable units currently listed for rent nearby; 5 units permitted in Jackson County in 2024 (0 in 5+ unit buildings).
Forward outlook
- Local home prices are declining (-3.0%/yr); year-one equity from $483 of loan paydown is wiped out by about $2k of value loss. Plan a longer hold.
- At projected returns (-3.0% appreciation + 3.0% rent growth), your $20k cash investment doubles in ~10 years — after that, you're playing with house money.
Negotiation context
- It's been on market 30 days — a 2% lower offer ($69k) is reasonable based on typical stale-listing flexibility.
- 4 sale attempts since 17y ago with the ask held roughly flat each time — persistent listings suggest the price (not the market) is what's stuck; bring a comps-based counter.
Risks & watch-outs
- Watch-outs: built in 1948 — expect roof / HVAC / electrical / plumbing capex.
- Climate carrying-cost: extreme-heat days projected 7→21/yr by 2055 (HVAC capex compounding) — expect insurance premiums to compound above CPI over the hold.
Questions for the listing agent
- Built in 1948 — when were the roof, HVAC, electrical panel, plumbing, and water heater last replaced?
- Is there a deadline driving the sale (1031 exchange, divorce, estate, relocation)? That informs how much negotiation room exists.
- Schools are F-rated, which usually means shorter tenancies and higher turnover. Who's the typical renter profile here, and what's been the actual vacancy rate?
- Crime grade is D in this area — have there been break-ins, vandalism, or insurance claims at this property in the last 3 years? What carrier currently insures it and at what premium?
- What's the average days-on-market for RENTAL listings here right now (not sales)? A rising rental-DOM trend means longer vacancies and softer asking-rent achievability than the comps imply.
- What's the recent tenant-quality profile in this submarket — average credit score on applications, eviction rate, late-payment / NSF rate, and stable-employment percentage? A property-management company in the area should have these aggregated.
- How much new for-sale + rental construction is in the pipeline within 1–3 miles? Heavy new supply typically softens prices + rents 12–24 months out; constrained supply supports both.
Investment metrics
- 1% rule
- 1.18% ✓
- Cap rate
- 9.78%
- Cash-on-cash
- 12.47%
- DSCR
- 1.55
- GRM
- 7.1
CMA / ARV
- ARV (on-the-fly)
- $57,344
- Comps found
- 12
Show comp detail 12 sales within ~0.75 mi
| Address | Dist | Beds/Ba | Sqft | Sold | Price | $/sf | Match |
|---|---|---|---|---|---|---|---|
| 2320 Mccord St | 0.00mi | 2/1.0 (+1) | 897 (+0%) | 4mo | $60,000 | $67 | 91 |
| 2135 Clay St | 0.19mi | 1/1.0 | 848 (-5%) | 14mo | $77,150 | $91 | 71 |
| 2135 Clay St | 0.19mi | 1/1.0 | 848 (-5%) | 14mo | $77,150 | $91 | 71 |
| 2322 Alexander St | 0.07mi | 1/1.0 | 768 (-14%) | 15mo | $30,000 | $39 | 61 |
| 2039 Commercial Dr | 0.32mi | 2/1.0 (+1) | 925 (+3%) | 18mo | $59,000 | $64 | 60 |
| 2039 Commercial Dr | 0.32mi | 2/1.0 (+1) | 925 (+3%) | 18mo | $59,000 | $64 | 60 |
| 547 S 17th St | 0.64mi | 2/1.0 (+1) | 960 (+7%) | 8mo | $70,000 | $73 | 47 |
| 547 S 17th St | 0.64mi | 2/1.0 (+1) | 960 (+7%) | 8mo | $70,000 | $73 | 47 |
| 1913 Kennedy St | 0.43mi | 2/1.5 (+1) | 948 (+6%) | 23mo | $50,000 | $53 | 44 |
| 524 S 17th St | 0.65mi | 2/1.0 (+1) | 1,008 (+12%) | 2mo | $21,000 | $21 | 42 |
| 2010 Elm St | 0.62mi | 2/1.0 (+1) | 1,020 (+14%) | 9mo | $45,000 | $44 | 36 |
| 2010 Elm St | 0.62mi | 2/1.0 (+1) | 1,020 (+14%) | 9mo | $45,000 | $44 | 36 |
Match score weights: distance 35% · size 25% · config 20% · recency 20%. Top-matched comps best support the ARV.
Projected returns pro-forma
-3.0% appreciation · 3.0% rent growth · sell at horizon
- IRR
- 2.2%
- Equity multiple
- 1.08×
- Total profit
- $1,616
- Equity at exit
- $10,422
- IRR
- 11.7%
- Equity multiple
- 1.92×
- Total profit
- $18,049
- Equity at exit
- $6,044
Cash invested: $19,572 (down + closing). Projections, not guarantees.
Landlord ↔ Tenant lean methodology
- Overall (STATE)
- 43 Moderately Tenant-Leaning
- State Illinois
- 43 Moderately Tenant-Leaning · D+7
- County
- — inherits STATE
- City
- — inherits STATE
ZIP-level market 62966
- Active inventory
- 79
- Price-to-rent
- 7.1×
Monthly cashflow live
- Estimated rent
- $825 medium interval (Pro) →
- Mortgage (P&I)
- −$367
- Tax from tax record
- −$53 /mo · $632/yr
- Insurance
- −$29
- HOA
- −$0
- Vacancy / Maint / Mgmt
- −$173
- Net cashflow
- $203
Break-even live
UW: 25.0% down · 7.5% · 30yr · 1.5% tax · 5.0% vac · 8.0% maint · 8.0% mgmt
Financing live
Cash to close
- Down payment
- $17,475
- Closing costs
- $2,097
- Reserves months
- —
- Total cash needed
- —
Loan-product check · same deal, 3 products live
Conventional
25% down · 7.5% · 30yr
- Down + closing
- —
- Monthly P&I
- —
- Monthly cashflow
- —
- DSCR
- —
- Eligible?
- —
Personal DTI + credit; lowest rate.
DSCR
20% down · 8.5% · 30yr
- Down + closing
- —
- Monthly P&I
- —
- Monthly cashflow
- —
- DSCR
- —
- Eligible?
- —
No personal income docs; deal must DSCR.
Hard money
10% down · 12.0% · 12mo
- Down + closing
- —
- Monthly P&I
- —
- Monthly cashflow
- —
- DSCR
- —
- Eligible?
- —
Short-term bridge; refi at stabilization.
Rent comps 1 comps
| Address | Beds | Baths | Sqft | Rent | $/sqft | DOM | Units | Dist |
|---|---|---|---|---|---|---|---|---|
| 502 Lucier St Murphysboro, IL | 2.0 | 1.0 | 988 | $825 | $0.84 | 43d | 1 | 1.39mi |
Listing history 15 events
-
2026-05-22$69,900 Active
-
2026-02-18soldstatus Closed
-
2026-02-18soldstatus $63,500
-
2026-01-17status Pending
-
2026-01-06historical
-
2025-12-09Active
-
2021-08-06historical
-
2021-08-06historical
-
2009-05-18soldstatus $58,000
-
2009-05-18soldstatus $58,000
-
2009-05-01soldstatus $58,000
-
2009-02-18$59,918
-
2009-02-18$59,918
-
2009-02-17historical
-
2007-01-27historical
ⓘ Source: listings_history table (triggers on properties + properties_extension) + one-shot
backfill from property_details.listing_events for pre-trigger history.
Tax reassessment forecast IL · Partial reset (capped growth)
- Current annual tax
- $632 · $53/mo
- Projected year-2 tax
- $1,110 · $92/mo
- Expected delta
- +$477/yr (+$40/mo · 75.4%)
ⓘ Screening estimate from a state-policy table — verify with the county assessor before closing.
Climate risk First Street
- Flood 1/10 Low FEMA zone X (unshaded) · 0% chance over 30 yrs
- Wildfire 1/10 Low
- Heat 5/10 Major 7 d/yr ≥107°F today · 21 d/yr by 30 yrs out
- Wind 2/10 Low 2% chance of damaging wind over 30 yrs
- Air quality 2/10 Low 0 unhealthy d/yr today · 2 by 30 yrs out
Nearby sold comps map
Loading sold comps map…
Walkable amenities ~0.75 mi
Loading nearby amenities…
Taxation est. · year 1
- Rental income
- $9,900
- − Mortgage interest
- −$3,915
- − Property taxes
- −$632
- − Insurance
- −$350
- − Repairs & maintenance
- −$792
- − Management
- −$792
- − Depreciation
- −$2,033
- Taxable income
- $1,385
- Est. tax owed @ 24.0%
- −$332
- After-tax cash flow
- $2,108/yr
For passive investors: Depreciation is non-cash, so a rental often shows a tax loss while cash-flowing — sheltering income. Rental losses are passive: they offset passive income freely, and up to $25,000/yr can offset ordinary (W-2) income if you actively participate and your MAGI is under $100k (phasing out to $0 by $150k); unused losses carry forward. On sale, claimed depreciation is recaptured at up to 25%, and gains may owe capital-gains tax (a 1031 exchange can defer both). Figures are a year-1 estimate at your 24.0% rate — not tax advice; consult a CPA.
Schools (NCES district)
- District
- Murphysboro CUSD 186
- NCES district ID
- 1727610
- Math proficiency
- 9% ▼ -9.00%
- Reading proficiency
- 10% ▼ -8.00%
- Median HH income
- $36,963
- Composite
- 7.97/100
- National rank
- #9925
- State rank
- #585 of 620 in IL
Livability — Murphysboro
- Score
- 54/100
- State rank
- #1265
- US rank
- #23786
Category grades
Schools grade is shown separately in the Schools card above.
Census & demographics
- Census place
- Murphysboro, IL
- City population
- 13,995
- Population (ZIP)
- 13,995
Population outlook (Jackson County) Hauer SSP2
- Today (2025)
- 59,093 people
- By 2030
- 59,628 · +0.9%
- By 2040
- 59,495 · +0.7%
- By 2050
- 58,811 · -0.5%
- By 2075
- 57,683 · -2.4%
- By 2100
- 55,337 · -6.4%
Race, ethnicity, and origin ACS 2023
- Neighborhood character
- Predominantly White (77%)
- Race & ethnicity
- White 77% Hispanic / Latino 8% Black 8% Two or more races 6%
- Hispanic origin (detail)
- Mexican 3% Puerto Rican 1%
- Common ancestry
- Lithuanian 5% Slovak 3% Italian 2%
- Foreign-born
- 4% · Canada, South Korea
- Languages at home
- 91% English-only · Spanish 6% Russian/Polish/Slavic 1%
Political lean MEDSL · Jackson
- 2024 margin
- Toss-up / Even · D 51.0% · R 47.5% · Other 1.4%
- 2008→2024 swing
- -18.3pp toward R · 2008: 21.8pp · 2024: 3.5pp
- All cycles
- 2024: D+3.5 2020: D+1.3 2016: D+3.0 2012: D+10.3 2008: D+21.8
Not yet ingested
- Civics
- —
Market trends
- HPI YoY
- ▼ -76.39%
- Current HPI
- 95.9393
- Rent YoY
- —
- Metro
- —
- State GDP YoY
- ▲ 1.59%
- F500 in state
- 60
Industry mix (Fortune 500 HQ in IL)
| Industry | F500 HQs | Revenue |
|---|---|---|
| Insurance | 4 | $201B |
|
||
| Consumer Goods | 4 | $87B |
|
||
| Industrial Machinery | 3 | $64B |
|
||
| Healthcare | 2 | $55B |
|
||
| Retail / Pharmacy | 1 | $148B |
|
||
| Agriculture / Food | 1 | $86B |
|
||
Price history
+16.7% since first listed15 events — show timeline
- 2026-05-22 Listed $69,900 MRED as Distributed by MLS Grid
- 2026-02-18 Sold (Public Records) $63,500 Public Records
- 2026-02-18 Sold (MLS) — MRED as Distributed by MLS Grid
- 2026-01-17 Pending — MRED as Distributed by MLS Grid
- 2026-01-06 Listing Removed — RMLSA as Distributed by MLS Grid
- 2025-12-09 Listed — RMLSA as Distributed by MLS Grid
- 2021-08-06 Listing Removed — RMLSA as Distributed by MLS Grid
- 2021-08-06 Listing Removed — RMLSA as Distributed by MLS Grid
- 2009-05-18 Sold (MLS) $58,000 RMLSA as Distributed by MLS Grid
- 2009-05-18 Sold (MLS) $58,000 MRED as Distributed by MLS Grid
- 2009-05-01 Sold (Public Records) $58,000 Public Records
- 2009-02-18 Listed $59,918 RMLSA as Distributed by MLS Grid
- 2009-02-18 Listed $59,918 MRED as Distributed by MLS Grid
- 2009-02-17 Listing Removed — MRED as Distributed by MLS Grid
- 2007-01-27 Listing Removed — MRED as Distributed by MLS Grid
Property tax history
-0.8%/yrLatest (2024): $632 · -5.9% YoY. Source: county tax records.
Cash-flow waterfall
monthlySold comps — $/sqft
last 12 mo · ≤1 miLoading sold comps…