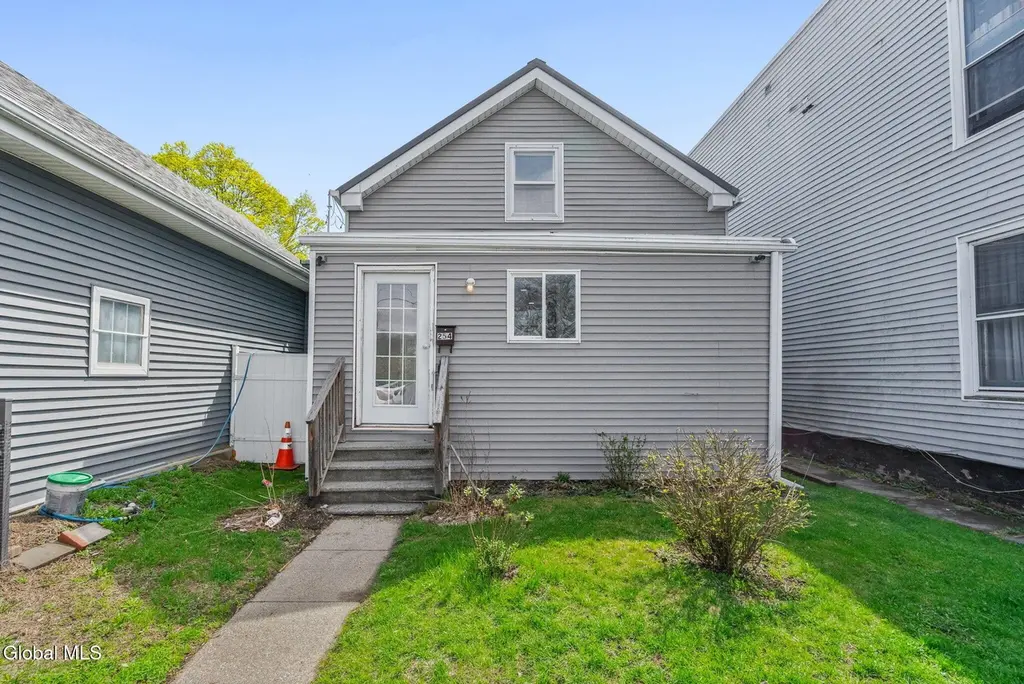
254 3rd Ave · Troy, NY
Flood risk 5/10 · Moderate
- FEMA flood zone
- X
- Chance of flooding over 30 yrs
- 0.24%
- Est. flood insurance / yr
- $473 – $860
Fire risk 4/10 · Minor
- Est. fire insurance / yr
- $691 – $1,283
Heat risk 4/10 · Minor
- Hot days now (above 95°F)
- 7 days/yr
- Hot days in 30 yrs
- 17 days/yr
Wind risk 3/10 · Minor
- Chance of severe wind over 30 yrs
- 6.0%
Air-quality risk 2/10 · Minimal
- Unhealthy air days now
- 0 days/yr
- Unhealthy air days in 30 yrs
- 1 days/yr
Risk factors via First Street. Map © Google.
Why this score? — see what drove the D grade
The composite is a weighted blend of 9 inputs, each scored 0–100. Each bar is that input's sub-score; the figure is the points it added to the 100-point composite (weight × sub-score).
- ARV discount +14.0/15.0
- Cash flow +9.0/30.0
- Livability +4.0/5.0
- Schools +2.8/10.0
- 1% rule +2.7/10.0
- DSCR +2.5/10.0
- Rent growth +2.5/5.0
- Condition / age +2.5/5.0
- Appreciation +0.0/10.0
$199,900
🖨 Deal sheet 📄 Offer letter ✓ Due diligence
Listing remarks MLS
Welcome to this beautifully updated 3 bedroom, 1 bath home in the heart of Lansingburgh! Thoughtfully refreshed throughout, this home features a long list of recent improvements including a newer boiler, hot water heater, updated lighting, flooring, windows, fresh paint, and modern appliances, making it truly move-in ready. The flexible layout offers a first-floor bedroom for convenience, with two additional bedrooms upstairs. Bright, inviting living spaces and great natural light make this home feel warm and welcoming from the moment you walk in. Enjoy peekaboo views of the Hudson River, adding a subtle but special touch. Outside, there is potential for off-street parking in the rear. Don't miss your chance to own a turnkey home with updates where it counts!
Key facts
- Fresh paint
- Newer boiler
- Updated windows
Tags
Neighborhood map
What this means for you Summary
Snapshot
- This is a 2-bed/1.0-bath single-family listed at $200k.
Deal economics
- At list price, monthly cash flow is $-159 ($-2k/yr) — negative.
- To cash-flow at today's rent, offer at most $172k (14.0% below list).
- To meet the 1% rule (rent ≥ 1% of price), the offer needs to be $154k (23.0% below list).
- Recommended offer: $154k (23.0% below list) — sets the bar for 1% rule.
Location & tenants
- Location reads 81/100 on livability (#88 in NY, #1,350 nationally) — a professional / high-income tenant draw. Strengths: amenities A+, commute A+, housing A+; Watch: schools C-, employment C-, crime F.
- Lansingburgh Central School District (urban): math 31% / reading 35% proficiency, ranked #566 of 590 in NY (top 96%) — families likely to look elsewhere, expect single-tenant / working-renter base with shorter leases.
- Market conditions: 75 active listings in the ZIP; 34 comparable units currently listed for rent nearby; rentals at typical pace (median 19d on market — plan ~3-4 weeks tenant-placement turnaround); 405 units permitted in Rensselaer County in 2024 (224 in 5+ unit buildings).
Forward outlook
- Local home prices are declining (-3.0%/yr); year-one equity from $1k of loan paydown is wiped out by about $6k of value loss. Plan a longer hold.
- Rensselaer County population projected to shrink 6% by 2050 — rents likely to lag national; underwrite the cash flow, not the appreciation.
Negotiation context
- It's been on market 57 days — a 3% lower offer ($194k) is reasonable based on typical stale-listing flexibility.
- 5 sale attempts since 26y ago; this cycle's ask has dropped $20k (9%) from the opening price — seller is motivated, your offer sets the floor, not the list.
- Current owner paid $60k; list at $200k implies a 233% gain — meaningful room to come down on a strong offer.
Risks & watch-outs
- Watch-outs: built in 1920 — expect roof / HVAC / electrical / plumbing capex.
- Climate carrying-cost: moderate flood risk — expect insurance premiums to compound above CPI over the hold.
Questions for the listing agent
- What do current leases actually rent for vs. the listed asking? Can we see a recent rent roll and the last 12 months of T-12 income?
- It's been on market 57 days. Have you received any prior offers? Is the seller open to a 23% concession, seller financing, or rate buy-down credit?
- Built in 1920 — when were the roof, HVAC, electrical panel, plumbing, and water heater last replaced?
- Is there a deadline driving the sale (1031 exchange, divorce, estate, relocation)? That informs how much negotiation room exists.
- Crime grade is F in this area — have there been break-ins, vandalism, or insurance claims at this property in the last 3 years? What carrier currently insures it and at what premium?
- The area grade is low — what's the realistic commute time and amenity access for the typical tenant pool here? Any planned neighborhood developments (good or bad) we should know about?
- What's the average days-on-market for RENTAL listings here right now (not sales)? A rising rental-DOM trend means longer vacancies and softer asking-rent achievability than the comps imply.
- What's the recent tenant-quality profile in this submarket — average credit score on applications, eviction rate, late-payment / NSF rate, and stable-employment percentage? A property-management company in the area should have these aggregated.
- How much new for-sale + rental construction is in the pipeline within 1–3 miles? Heavy new supply typically softens prices + rents 12–24 months out; constrained supply supports both.
Investment metrics
- 1% rule
- 0.77% ✗
- Cap rate
- 5.34%
- Cash-on-cash
- -3.40%
- DSCR
- 0.85
- GRM
- 10.8
CMA / ARV
- ARV (median comp)
- $233,901
- List price
- $199,900
- Delta
- -14.54%
- Verdict
- UNDERPRICED
- Comps
- 20 within 1.0 mi
Show comp detail 7 sales within ~0.75 mi
| Address | Dist | Beds/Ba | Sqft | Sold | Price | $/sf | Match |
|---|---|---|---|---|---|---|---|
| 331 6th Ave | 0.26mi | 3/1.0 (+1) | 1,035 (-0%) | 7mo | $155,000 | $150 | 76 |
| 445 6th Ave | 0.56mi | 2/1.0 | 1,008 (-3%) | 14mo | $209,000 | $207 | 57 |
| 421 7th Ave | 0.52mi | 3/1.0 (+1) | 1,120 (+8%) | 10mo | $75,000 | $67 | 49 |
| 37 111th St | 0.54mi | 2/1.0 | 900 (-14%) | 11mo | $190,000 | $211 | 43 |
| 44 109th St | 0.37mi | 3/2.0 (+1) | 1,164 (+12%) | 13mo | $209,900 | $180 | 43 |
| 10 Grace Ct | 0.58mi | 3/1.0 (+1) | 1,152 (+11%) | 21mo | $215,000 | $187 | 33 |
| 515 1st Ave | 0.73mi | 3/1.0 (+1) | 1,152 (+11%) | 24mo | $155,000 | $135 | 23 |
Match score weights: distance 35% · size 25% · config 20% · recency 20%. Top-matched comps best support the ARV.
Projected returns pro-forma
-3.0% appreciation · 3.0% rent growth · sell at horizon
- IRR
- -22.0%
- Equity multiple
- 0.24×
- Total profit
- $-42,469
- Equity at exit
- $29,806
- IRR
- -15.9%
- Equity multiple
- 0.11×
- Total profit
- $-49,903
- Equity at exit
- $17,284
Cash invested: $55,972 (down + closing). Projections, not guarantees.
Landlord ↔ Tenant lean methodology
- Overall (STATE)
- 15 Strongly Tenant-Friendly
- State New York
- 15 Strongly Tenant-Friendly · D+10
- County
- — inherits STATE
- City
- — inherits STATE
ZIP-level market 12182
- Home prices YoY
- -15.6%
- Active inventory
- 75
- Price-to-rent
- 10.8×
Monthly cashflow live
- Estimated rent
- $1,539 high interval (Pro) →
- Mortgage (P&I)
- −$1,048
- Tax from tax record
- −$243 /mo · $2,916/yr
- Insurance
- −$83
- HOA
- −$0
- Vacancy / Maint / Mgmt
- −$323
- Net cashflow
- $-159
Break-even live
UW: 25.0% down · 7.5% · 30yr · 1.5% tax · 5.0% vac · 8.0% maint · 8.0% mgmt
Financing live
Cash to close
- Down payment
- $49,975
- Closing costs
- $5,997
- Reserves months
- —
- Total cash needed
- —
Loan-product check · same deal, 3 products live
Conventional
25% down · 7.5% · 30yr
- Down + closing
- —
- Monthly P&I
- —
- Monthly cashflow
- —
- DSCR
- —
- Eligible?
- —
Personal DTI + credit; lowest rate.
DSCR
20% down · 8.5% · 30yr
- Down + closing
- —
- Monthly P&I
- —
- Monthly cashflow
- —
- DSCR
- —
- Eligible?
- —
No personal income docs; deal must DSCR.
Hard money
10% down · 12.0% · 12mo
- Down + closing
- —
- Monthly P&I
- —
- Monthly cashflow
- —
- DSCR
- —
- Eligible?
- —
Short-term bridge; refi at stabilization.
Rent comps 34 comps
| Address | Beds | Baths | Sqft | Rent | $/sqft | DOM | Units | Dist |
|---|---|---|---|---|---|---|---|---|
| 290 2nd Ave Troy, NY | 3.0 | 1.0 | 1400 | $1,600 | $1.14 | 21d | 1 | 0.14mi |
| 157 6th Ave Unit 2 Troy, NY | 3.0 | 1.0 | 1300 | $1,350 | $1.04 | 18d | 1 | 0.29mi |
| 140 5th Ave Unit 2 Troy, NY | 3.0 | 1.0 | 1200 | $1,395 | $1.16 | 23d | 1 | 0.31mi |
| 386 3rd Ave #1 Troy, NY | 3.0 | 1.0 | 1024 | $1,700 | $1.66 | 14d | 1 | 0.39mi |
| 40 102nd St Apt 6 Troy, NY | 2.0 | 1.0 | 1000 | $1,200 | $1.20 | 23d | 1 | 0.42mi |
| 1000 Hudson Sq Cohoes, NY | 1.0 | 1.0 | 714 | $1,750 | $2.45 | 14d | 3 | 0.47mi |
| 415 7th Ave Unit 2 Troy, NY | 3.0 | 1.0 | 850 | $1,675 | $1.97 | 14d | 1 | 0.52mi |
| 499 6th Ave Troy, NY | 2.0 | 1.0 | 750 | $1,250 | $1.67 | 21d | 1 | 0.72mi |
| 3132-3134 6th Ave Troy, NY | 2.0 | 1.0 | 950 | $1,300 | $1.37 | 23d | 1 | 0.86mi |
| 3132-3134 6th Ave Troy, NY | 3.0 | 1.0 | 950 | $1,350 | $1.42 | 14d | 1 | 0.86mi |
| 3134 6th Ave Troy, NY | 2.0 | 1.0 | 950 | $1,280 | $1.35 | 14d | 1 | 0.86mi |
| 171 Oakwood Ave Troy, NY | 1.0 | 1.0 | 810 | $1,613 | $1.99 | 14d | 2 | 0.93mi |
| 580 2nd Ave Troy, NY | 1.0 | 1.5 | 1000 | $1,500 | $1.50 | 23d | 1 | 0.93mi |
| 589 1st Ave Troy, NY | 2.0 | 1.0 | 960 | $1,750 | $1.82 | 14d | 1 | 0.96mi |
| 338 Saratoga St Unit 2 Cohoes, NY | 3.0 | 1.5 | 1200 | $1,495 | $1.25 | 43d | 1 | 0.97mi |
| 196 Main St Cohoes, NY | 2.0 | 1.0 | 1200 | $1,375 | $1.15 | 23d | 1 | 1.01mi |
| 193 Congress St Unit 2 Cohoes, NY | 2.0 | 2.0 | 968 | $1,600 | $1.65 | 14d | 1 | 1.07mi |
| 12 Stoneledge Dr Apt 1 Troy, NY | 2.0 | 2.0 | 1210 | $2,000 | $1.65 | 43d | 1 | 1.07mi |
| 159 Main St #2 Cohoes, NY | 3.0 | 1.0 | 950 | $1,295 | $1.36 | 14d | 1 | 1.08mi |
| 100 Waters View Cir Cohoes, NY | 1.0–2.0 | 1.0–2.5 | 1281 | $2,413 | $1.88 | 14d | 13 | 1.10mi |
| 192 Saratoga St Cohoes, NY | 1.0–3.0 | 1.0–3.0 | 1157 | $1,998 | $1.73 | 14d | 4 | 1.11mi |
| 129 Main St Cohoes, NY | 2.0 | 1.0 | 1104 | $1,350 | $1.22 | 43d | 1 | 1.11mi |
| 413 Diamond Rock Cir Troy, NY | 2.0 | 2.0 | 1252 | $2,100 | $1.68 | 14d | 1 | 1.21mi |
| 413 Diamond Rock Cir Troy, NY | 2.0 | 2.0 | 1252 | $2,100 | $1.68 | 18d | 1 | 1.21mi |
| 362 9th St Unit 1st Floor Troy, NY | 3.0 | 1.0 | 1156 | $1,575 | $1.36 | 18d | 1 | 1.22mi |
| 362 9th St Unit 1st Floor Troy, NY | 3.0 | 1.0 | 1156 | $1,575 | $1.36 | 23d | 1 | 1.22mi |
| 53 Main St Unit 3 Cohoes, NY | 3.0 | 1.0 | 1200 | $1,345 | $1.12 | 23d | 1 | 1.23mi |
| 113 Mohawk St Unit 1S Cohoes, NY | 1.0 | 1.0 | 800 | $1,350 | $1.69 | 43d | 1 | 1.26mi |
| 137 Remsen St Unit 2R Cohoes, NY | 1.0 | 1.0 | 700 | $1,275 | $1.82 | 43d | 1 | 1.27mi |
| 134 Remsen St Cohoes, NY | 1.0 | 1.0 | 910 | $1,550 | $1.70 | 14d | 1 | 1.29mi |
| 300 Ontario St Cohoes, NY | 3.0 | 1.0 | 1100 | $1,600 | $1.45 | 14d | 1 | 1.34mi |
| 750 2nd Ave Troy, NY | 1.0–3.0 | 1.0–1.5 | 1185 | $1,263 | $1.07 | 14d | 1 | 1.37mi |
| 121 Columbia Gdns Cohoes, NY | 1.0–3.0 | 1.0–2.0 | 863 | $1,794 | $2.08 | 14d | 7 | 1.38mi |
| 124 Columbia St Fl 2 Cohoes, NY | 2.0 | 1.0 | 1200 | $1,400 | $1.17 | 14d | 1 | 1.40mi |
Listing history 31 events
-
2026-06-18days on market $199,900 Active 57 DOM
-
2026-06-17days on market $199,900 Active 56 DOM
-
2026-06-16days on market $199,900 Active 55 DOM
-
2026-06-15days on market $199,900 Active 54 DOM
-
2026-06-14days on market $199,900 Active 52 DOM
-
2026-06-10days on market $199,900 Active 49 DOM
-
2026-06-09days on market $199,900 Active 48 DOM
-
2026-06-08days on market $199,900 Active 47 DOM
-
2026-06-07days on market $199,900 Active 46 DOM
-
2026-06-05days on market $199,900 Active 43 DOM
-
2026-06-03days on market $199,900 Active 42 DOM
-
2026-06-02days on market $199,900 Active 41 DOM
-
2026-06-01days on market $199,900 Active 40 DOM
-
2026-05-31days on market $199,900 Active 39 DOM
-
2026-05-31days on market $199,900 Active 38 DOM
-
2026-04-22$220,000 Active 779-char remark
Show marketing remark (779 chars)
Welcome to this beautifully updated 3 bedroom, 1 bath home in the heart of Lansingburgh! Thoughtfully refreshed throughout, this home features a long list of recent improvements including a newer boiler, hot water heater, updated lighting, flooring, windows, fresh paint, and modern appliances, making it truly move-in ready. The flexible layout offers a first-floor bedroom for convenience, with two additional bedrooms upstairs. Bright, inviting living spaces and great natural light make this home feel warm and welcoming from the moment you walk in. Enjoy peekaboo views of the Hudson River, adding a subtle but special touch. Outside, there is potential for off-street parking in the rear. Don't miss your chance to own a turnkey home with updates where it counts!
-
2022-05-23historical
-
2022-04-14price $145,900
-
2022-03-30status Active
-
2022-03-21status Pending
-
2022-03-17price $149,900
-
2022-02-11$154,900 Active
-
2018-10-02soldstatus $60,000
-
2017-09-20soldstatus $30,000
-
2017-05-24historical
-
2016-12-23$50,000 New
-
2000-09-13soldstatus $22,000
-
2000-09-06soldstatus $22,000
-
2000-07-14historical
-
2000-02-24$29,900
-
2000-02-01soldstatus $54,000
ⓘ Source: listings_history table (triggers on properties + properties_extension) + one-shot
backfill from property_details.listing_events for pre-trigger history.
Tax reassessment forecast NY · Partial reset (capped growth)
- Current annual tax
- $2,916 · $243/mo
- Projected year-2 tax
- $3,147 · $262/mo
- Expected delta
- +$231/yr (+$19/mo · 7.9%)
ⓘ Screening estimate from a state-policy table — verify with the county assessor before closing.
Climate risk First Street
- Flood 5/10 Major FEMA zone X · 24% chance over 30 yrs
- Wildfire 4/10 Moderate
- Heat 4/10 Moderate 7 d/yr ≥95°F today · 17 d/yr by 30 yrs out
- Wind 3/10 Moderate 6% chance of damaging wind over 30 yrs
- Air quality 2/10 Low 0 unhealthy d/yr today · 1 by 30 yrs out
Nearby sold comps map
Loading sold comps map…
Walkable amenities ~0.75 mi
Loading nearby amenities…
Taxation est. · year 1
- Rental income
- $18,472
- − Mortgage interest
- −$11,198
- − Property taxes
- −$2,916
- − Insurance
- −$1,000
- − Repairs & maintenance
- −$1,478
- − Management
- −$1,478
- − Depreciation
- −$5,815
- Taxable loss
- −$5,412
- Est. tax savings @ 24.0%
- +$1,299
- After-tax cash flow
- $-603/yr
For passive investors: Depreciation is non-cash, so a rental often shows a tax loss while cash-flowing — sheltering income. Rental losses are passive: they offset passive income freely, and up to $25,000/yr can offset ordinary (W-2) income if you actively participate and your MAGI is under $100k (phasing out to $0 by $150k); unused losses carry forward. On sale, claimed depreciation is recaptured at up to 25%, and gains may owe capital-gains tax (a 1031 exchange can defer both). Figures are a year-1 estimate at your 24.0% rate — not tax advice; consult a CPA.
Schools (NCES district)
- District
- Lansingburgh Central School District
- NCES district ID
- 3616740
- Math proficiency
- 31% ▼ -7.00%
- Reading proficiency
- 35% ▼ -6.00%
- Median HH income
- $44,807
- Composite
- 28.19/100
- National rank
- #6810
- State rank
- #566 of 590 in NY
Livability — Troy
- Score
- 81/100
- State rank
- #88
- US rank
- #1350
Category grades
Schools grade is shown separately in the Schools card above.
Census & demographics
- Census place
- Troy, NY
- City population
- 53,479
- Population (ZIP)
- 14,273
Population outlook (Rensselaer County) Hauer SSP2
- Today (2025)
- 162,400 people
- By 2030
- 161,746 · -0.4%
- By 2040
- 158,095 · -2.7%
- By 2050
- 152,966 · -5.8%
- By 2075
- 140,767 · -13.3%
- By 2100
- 124,727 · -23.2%
Race, ethnicity, and origin ACS 2023
- Neighborhood character
- Predominantly White (70%)
- Race & ethnicity
- White 70% Black 14% Two or more races 12% Hispanic / Latino 7%
- Hispanic origin (detail)
- Puerto Rican 6%
- Common ancestry
- Lithuanian 7% Romanian 3% Iranian 1%
- Foreign-born
- 3% · Canada, Jamaica
- Languages at home
- 94% English-only · Spanish 4% Other Indo-European 1%
Political lean MEDSL · Rensselaer
- 2024 margin
- Toss-up / Even · D 50.7% · R 49.3%
- 2008→2024 swing
- -8.0pp toward R · 2008: 9.3pp · 2024: 1.4pp
- All cycles
- 2024: D+1.4 2020: D+5.6 2016: R+2.9 2012: D+11.8 2008: D+9.3
Not yet ingested
- Civics
- —
Market trends
- HPI YoY
- ▼ -50.58%
- Current HPI
- 273.5758
- Rent YoY
- —
- Metro
- —
- State GDP YoY
- ▲ 2.60%
- F500 in state
- 92
Industry mix (Fortune 500 HQ in NY)
| Industry | F500 HQs | Revenue |
|---|---|---|
| Financial Services | 10 | $950B |
|
||
| Consumer Goods | 9 | $162B |
|
||
| Insurance | 4 | $225B |
|
||
| Telecommunications | 2 | $144B |
|
||
| Pharmaceuticals | 2 | $112B |
|
||
| Media / Entertainment | 2 | $69B |
|
||
Price history
+307.4% since first listed16 events — show timeline
- 2026-04-22 Listed $220,000 Global MLS
- 2022-05-23 Listing Removed — Global MLS
- 2022-04-14 Price Changed $145,900 Global MLS
- 2022-03-30 Relisted — Global MLS
- 2022-03-21 Pending — Global MLS
- 2022-03-17 Price Changed $149,900 Global MLS
- 2022-02-11 Listed $154,900 Global MLS
- 2018-10-02 Sold (Public Records) $60,000 Public Records
- 2017-09-20 Sold (Public Records) $30,000 Public Records
- 2017-05-24 Listing Removed — Global MLS
- 2016-12-23 Listed $50,000 Global MLS
- 2000-09-13 Sold (MLS) $22,000 Global MLS
- 2000-09-06 Sold (Public Records) $22,000 Public Records
- 2000-07-14 Listing Removed — Global MLS
- 2000-02-24 Listed $29,900 Global MLS
- 2000-02-01 Sold (Public Records) $54,000 Public Records
Property tax history
+14.2%/yrLatest (2025): $2,916 · +1.3% YoY. Source: county tax records.
Cash-flow waterfall
monthlySold comps — $/sqft
last 12 mo · ≤1 miLoading sold comps…