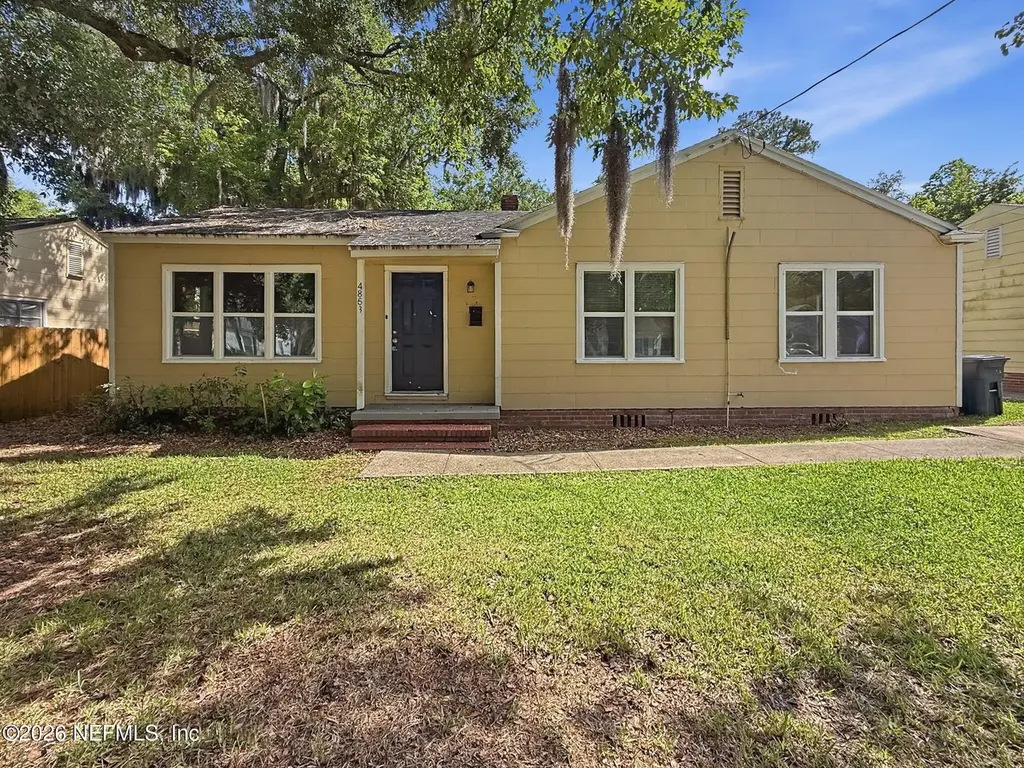
4853 Riverdale Rd · Jacksonville, FL
Flood risk 6/10 · Moderate
- FEMA flood zone
- X (unshaded)
- Chance of flooding over 30 yrs
- 0.73%
- Est. flood insurance / yr
- $507 – $1,088
Fire risk 2/10 · Minimal
- Est. fire insurance / yr
- $947 – $1,759
Heat risk 8/10 · Major
- Hot days now (above 107°F)
- 7 days/yr
- Hot days in 30 yrs
- 20 days/yr
Wind risk 10/10 · Severe
- Chance of severe wind over 30 yrs
- 99.0%
Air-quality risk 5/10 · Moderate
- Unhealthy air days now
- 7 days/yr
- Unhealthy air days in 30 yrs
- 7 days/yr
Risk factors via First Street. Map © Google.
Why this score? — see what drove the B grade
The composite is a weighted blend of 9 inputs, each scored 0–100. Each bar is that input's sub-score; the figure is the points it added to the 100-point composite (weight × sub-score).
- Cash flow +26.0/30.0
- ARV discount +15.0/15.0
- DSCR +8.8/10.0
- 1% rule +7.2/10.0
- Livability +4.2/5.0
- Schools +3.9/10.0
- Rent growth +3.0/5.0
- Condition / age +2.5/5.0
- Appreciation +0.0/10.0
$129,900
🖨 Deal sheet 📄 Offer letter ✓ Due diligence
Listing remarks
Charming 1-story home featuring 3 bedrooms and 1 bathroom with a functional layout designed for comfortable everyday living. The inviting living areas offer abundant natural light and create a warm, welcoming atmosphere throughout the home. The kitchen provides a practical setup with ample space for meal preparation and dining, while the bedrooms offer flexibility for guests, a home office, or hobbies. The comfortable floor plan is designed to maximize both functionality and everyday convenience, making this home a great opportunity with plenty of potential to make it your own. No FHA or VA.
Key facts
- Built 1943
- Listed 12 days
Property features AI
Finance
- HOA & community: Not a senior community
Exterior
- Parking: Off-street parking
- Utilities: Other utilities
- Exterior features: Single-family residence used for residential purposes; No private pool
Interior
- Kitchen: Electric range; Refrigerator
- Bedrooms: Three bedrooms (all on the main level)
- Bathrooms: One full bathroom
- Heating & cooling: Central heating; Central air conditioning
- Interior features: Six total rooms
Neighborhood map
What this means for you Summary
Snapshot
- This is a 3-bed/1.0-bath single-family listed at $130k.
Deal economics
- At list price, monthly cash flow is $324 ($4k/yr) — positive.
- The deal already cash-flows at list — no discount required.
- Meets the 1% rule at list price ($2k rent vs $130k).
- Cap rate 9.3% vs local median 4.0% in Jacksonville — top-decile yield for the area; either an underpriced asset or a hidden risk that comps aren't pricing in. Stress-test before assuming the spread holds.
Location & tenants
- Location reads 83/100 on livability (#50 in FL, #911 nationally) — a professional / high-income tenant draw. Strengths: amenities A+, commute A+, housing A+.
- Duval (urban): math 46% / reading 45% proficiency, ranked #48 of 73 in FL (top 66%) — families likely to look elsewhere, expect single-tenant / working-renter base with shorter leases.
- Market conditions: Rents rising (+2.1%/yr); 441 active listings in the ZIP; 18 comparable units currently listed for rent nearby; rentals leasing fast (median 8d on market — plan ~1-2 weeks tenant-placement turnaround); 6,503 units permitted in Duval County in 2024 (1,131 in 5+ unit buildings).
- This rent runs 31% of the median local income ($61k/yr) — at the standard rent-burdened threshold; future hikes will face affordability resistance.
Forward outlook
- Local home prices are declining (-3.0%/yr); year-one equity from $898 of loan paydown is wiped out by about $4k of value loss. Plan a longer hold.
- Duval County population projected at +19% by 2050 — long-run rental-demand tailwind backs the buy-and-hold thesis.
Negotiation context
- Only 12 days on market — expect competitive offers; lowballing is unlikely to land.
- 2 sale attempts with the ask held roughly flat each time — persistent listings suggest the price (not the market) is what's stuck; bring a comps-based counter.
- Current owner paid $41k; list at $130k implies a 219% gain — meaningful room to come down on a strong offer.
Risks & watch-outs
- Watch-outs: built in 1943 — expect roof / HVAC / electrical / plumbing capex.
- Climate carrying-cost: major flood risk; severe wind risk, 99% chance of damaging wind over 30y; extreme-heat days projected 7→20/yr by 2055 (HVAC capex compounding) — expect insurance premiums to compound above CPI over the hold.
Questions for the listing agent
- Built in 1943 — when were the roof, HVAC, electrical panel, plumbing, and water heater last replaced?
- Is there a deadline driving the sale (1031 exchange, divorce, estate, relocation)? That informs how much negotiation room exists.
- Schools are B-rated — typically a magnet for longer-tenancy family renters. What's the average tenant stay here, and is there a school-zone premium baked into asking?
- What's the average days-on-market for RENTAL listings here right now (not sales)? A rising rental-DOM trend means longer vacancies and softer asking-rent achievability than the comps imply.
- What's the recent tenant-quality profile in this submarket — average credit score on applications, eviction rate, late-payment / NSF rate, and stable-employment percentage? A property-management company in the area should have these aggregated.
- How much new for-sale + rental construction is in the pipeline within 1–3 miles? Heavy new supply typically softens prices + rents 12–24 months out; constrained supply supports both.
Investment metrics
- 1% rule
- 1.22% ✓
- Cap rate
- 9.28%
- Cash-on-cash
- 10.68%
- DSCR
- 1.48
- GRM
- 6.8
CMA / ARV
- ARV (on-the-fly)
- $182,763
- Comps found
- 12
Show comp detail 12 sales within ~0.75 mi
| Address | Dist | Beds/Ba | Sqft | Sold | Price | $/sf | Match |
|---|---|---|---|---|---|---|---|
| 4853 Riverdale Rd | 0.00mi | 3/1.0 | 967 (0%) | 0mo | $117,500 | $122 | 100 |
| 5044 Sunderland Rd | 0.29mi | 3/1.0 | 996 (+3%) | 2mo | $165,000 | $166 | 80 |
| 4916 Dundee Rd | 0.03mi | 2/1.0 (-1) | 898 (-7%) | 7mo | $189,750 | $211 | 76 |
| 4720 Manchester Rd | 0.19mi | 3/1.0 | 1,066 (+10%) | 10mo | $105,000 | $98 | 66 |
| 4741 Colonial Ave | 0.43mi | 3/2.0 | 920 (-5%) | 13mo | $191,500 | $208 | 57 |
| 2322 Woodridge Rd | 0.73mi | 2/1.0 (-1) | 946 (-2%) | 2mo | $120,000 | $127 | 56 |
| 5250 Fremont St | 0.51mi | 2/1.5 (-1) | 908 (-6%) | 5mo | $220,000 | $242 | 55 |
| 5213 Birkenhead Rd | 0.40mi | 2/1.0 (-1) | 1,064 (+10%) | 6mo | $201,050 | $189 | 55 |
| 3505 Blanding Blvd | 0.32mi | 3/1.0 | 1,107 (+14%) | 12mo | $95,000 | $86 | 51 |
| 1904 Vista Ave | 0.70mi | 3/2.0 | 1,072 (+11%) | 8mo | $210,000 | $196 | 39 |
| 5209 Appleton Ave | 0.56mi | 3/2.0 | 1,093 (+13%) | 12mo | $220,000 | $201 | 38 |
| 5163 Lexington Ave | 0.70mi | 2/1.0 (-1) | 835 (-14%) | 3mo | $85,000 | $102 | 38 |
Match score weights: distance 35% · size 25% · config 20% · recency 20%. Top-matched comps best support the ARV.
Projected returns pro-forma
-3.0% appreciation · 2.11% rent growth · sell at horizon
- IRR
- -1.3%
- Equity multiple
- 0.95×
- Total profit
- $-1,804
- Equity at exit
- $19,369
- IRR
- 7.4%
- Equity multiple
- 1.54×
- Total profit
- $19,464
- Equity at exit
- $11,231
Cash invested: $36,372 (down + closing). Projections, not guarantees.
Landlord ↔ Tenant lean methodology
- Overall (STATE)
- 87 Strongly Landlord-Friendly
- State Florida
- 87 Strongly Landlord-Friendly · R+3
- County
- — inherits STATE
- City
- — inherits STATE
ZIP-level market 32210
- Rents YoY
- 2.1%
- Active inventory
- 441
- Price-to-rent
- 6.8×
Monthly cashflow live
- Estimated rent
- $1,590 high interval (Pro) →
- Mortgage (P&I)
- −$681
- Tax from tax record
- −$197 /mo · $2,368/yr
- Insurance
- −$54
- HOA
- −$0
- Vacancy / Maint / Mgmt
- −$334
- Net cashflow
- $324
Break-even live
UW: 25.0% down · 7.5% · 30yr · 1.5% tax · 5.0% vac · 8.0% maint · 8.0% mgmt
Financing live
Cash to close
- Down payment
- $32,475
- Closing costs
- $3,897
- Reserves months
- —
- Total cash needed
- —
Loan-product check · same deal, 3 products live
Conventional
25% down · 7.5% · 30yr
- Down + closing
- —
- Monthly P&I
- —
- Monthly cashflow
- —
- DSCR
- —
- Eligible?
- —
Personal DTI + credit; lowest rate.
DSCR
20% down · 8.5% · 30yr
- Down + closing
- —
- Monthly P&I
- —
- Monthly cashflow
- —
- DSCR
- —
- Eligible?
- —
No personal income docs; deal must DSCR.
Hard money
10% down · 12.0% · 12mo
- Down + closing
- —
- Monthly P&I
- —
- Monthly cashflow
- —
- DSCR
- —
- Eligible?
- —
Short-term bridge; refi at stabilization.
Rent comps 18 comps
| Address | Beds | Baths | Sqft | Rent | $/sqft | DOM | Units | Dist |
|---|---|---|---|---|---|---|---|---|
| 3434 Blanding Blvd Jacksonville, FL | 2.0–3.0 | 2.0 | 1101 | $1,800 | $1.63 | 3d | 2 | 0.31mi |
| 4301 Confederate Point Rd Jacksonville, FL | 3.0 | 1.0–2.0 | 1042 | $1,606 | $1.54 | 2d | 39 | 0.65mi |
| 5215 San Juan Ave Jacksonville, FL | 2.0 | 1.0 | 750 | $1,075 | $1.43 | 7d | 1 | 0.65mi |
| 6066 Wilson Blvd Jacksonville, FL | 3.0 | 3.0 | 1097 | $1,800 | $1.64 | 23d | 1 | 0.71mi |
| 4375 Confederate Point Rd Jacksonville, FL | 1.0–3.0 | 1.0–2.5 | 1125 | $1,536 | $1.37 | 2d | 22 | 0.74mi |
| 4455 Confederate Point Rd Jacksonville, FL | 1.0–3.0 | 1.0–2.5 | 1045 | $1,599 | $1.53 | 1d | 19 | 0.86mi |
| 4776 Cardinal Blvd Jacksonville, FL | 3.0 | 1.0 | 959 | $1,550 | $1.62 | 23d | 1 | 0.88mi |
| 5139 Camille Ave Jacksonville, FL | 3.0 | 2.0 | 1100 | $1,625 | $1.48 | 1d | 1 | 0.90mi |
| 4343 Ortega Farms Cir Unit A Jacksonville, FL | 2.0 | 1.0 | 800 | $1,950 | $2.44 | 23d | 1 | 0.90mi |
| 2039 Niblick Dr Jacksonville, FL | 1.0–2.0 | 1.0–2.0 | 847 | $1,275 | $1.51 | 2d | 10 | 0.93mi |
| 5615 San Juan Ave #208 Jacksonville, FL | 2.0 | 2.0 | 1115 | $1,200 | $1.08 | 23d | 1 | 0.95mi |
| 5821 San Juan Ave Jacksonville, FL | 1.0–3.0 | 1.0–2.0 | 1056 | $1,330 | $1.26 | 3d | 7 | 1.04mi |
| 4844 Merrimac Ave Jacksonville, FL | 2.0 | 1.0 | 820 | $1,325 | $1.62 | 23d | 1 | 1.10mi |
| 4608 Wheeler Ave Jacksonville, FL | 3.0 | 1.0 | 1025 | $2,000 | $1.95 | 23d | 1 | 1.21mi |
| 6511 San Juan Ave Jacksonville, FL | 2.0 | 2.0 | 740 | $1,200 | $1.62 | 4d | 1 | 1.38mi |
| 4800 Ortega Farms Blvd Jacksonville, FL | 1.0–3.0 | 1.0 | 880 | $1,465 | $1.66 | 10d | 9 | 1.43mi |
| 4800 Ortega Farms Blvd Jacksonville, FL | 1.0–3.0 | 1.0 | 880 | $1,435 | $1.63 | 2d | 10 | 1.43mi |
| 6595 San Juan Ave Jacksonville, FL | 1.0–2.0 | 1.0 | 846 | $1,250 | $1.48 | 19d | 4 | 1.49mi |
Listing history 11 events
-
2026-05-20status Pending
-
2026-05-08$129,900 Active
-
2026-04-18historical $1,405
-
2026-04-15price $1,405
-
2026-04-14price $1,395
-
2026-04-12price $1,400
-
2026-04-09price $1,390
-
2026-04-08price $1,385
-
2026-04-06$1,380
-
1986-04-01soldstatus $40,700
-
1984-06-01soldstatus $35,500
ⓘ Source: listings_history table (triggers on properties + properties_extension) + one-shot
backfill from property_details.listing_events for pre-trigger history.
Tax reassessment forecast FL · Resets to sale price
- Current annual tax
- $2,368 · $197/mo
- Projected year-2 tax
- $2,368 · $197/mo
- Expected delta
- $0/yr ($0/mo · 0.0%)
ⓘ Screening estimate from a state-policy table — verify with the county assessor before closing.
Climate risk First Street
- Flood 6/10 Major FEMA zone X (unshaded) · 73% chance over 30 yrs
- Wildfire 2/10 Low
- Heat 8/10 Severe 7 d/yr ≥107°F today · 20 d/yr by 30 yrs out
- Wind 10/10 Extreme 99% chance of damaging wind over 30 yrs
- Air quality 5/10 Major 7 unhealthy d/yr today · 7 by 30 yrs out
Nearby sold comps map
Loading sold comps map…
Walkable amenities ~0.75 mi
Loading nearby amenities…
Taxation est. · year 1
- Rental income
- $19,083
- − Mortgage interest
- −$7,276
- − Property taxes
- −$2,368
- − Insurance
- −$650
- − Repairs & maintenance
- −$1,527
- − Management
- −$1,527
- − Depreciation
- −$3,779
- Taxable income
- $1,957
- Est. tax owed @ 24.0%
- −$470
- After-tax cash flow
- $3,414/yr
For passive investors: Depreciation is non-cash, so a rental often shows a tax loss while cash-flowing — sheltering income. Rental losses are passive: they offset passive income freely, and up to $25,000/yr can offset ordinary (W-2) income if you actively participate and your MAGI is under $100k (phasing out to $0 by $150k); unused losses carry forward. On sale, claimed depreciation is recaptured at up to 25%, and gains may owe capital-gains tax (a 1031 exchange can defer both). Figures are a year-1 estimate at your 24.0% rate — not tax advice; consult a CPA.
Schools (NCES district)
- District
- Duval
- NCES district ID
- 1200480
- Math proficiency
- 46% ▼ -11.00%
- Reading proficiency
- 45% ▼ -4.00%
- Median HH income
- $48,987
- Composite
- 38.97/100
- National rank
- #4076
- State rank
- #48 of 73 in FL
Livability — Jacksonville
- Score
- 83/100
- State rank
- #50
- US rank
- #911
Category grades
Schools grade is shown separately in the Schools card above.
Census & demographics
- Census place
- Jacksonville, FL
- County
- Duval County · 1,015,274 people
- City population
- 979,034
- Metro
- Jacksonville, FL
- Population (ZIP)
- 65,729
- Household income
- $61,050
- Rent vs Own
- Severe rent burden
- 3605.0
Population outlook (Duval County) Hauer SSP2
- Today (2025)
- 1,013,010 people
- By 2030
- 1,059,228 · +4.6%
- By 2040
- 1,141,439 · +12.7%
- By 2050
- 1,205,258 · +19.0%
- By 2075
- 1,324,282 · +30.7%
- By 2100
- 1,319,620 · +30.3%
Race, ethnicity, and origin ACS 2023
- Neighborhood character
- Diverse neighborhood (Simpson 0.65)
- Race & ethnicity
- White 43% Black 38% Hispanic / Latino 10% Two or more races 7% Asian 3%
- Hispanic origin (detail)
- Mexican 3% Puerto Rican 3%
- Common ancestry
- Slovak 2% Hispanic 2% Italian 1%
- Foreign-born
- 10% · Canada, Vietnam, China
- Languages at home
- 86% English-only · Spanish 7% French/Haitian/Cajun 2% Tagalog/Filipino 1%
Political lean MEDSL · Duval
- 2024 margin
- Toss-up / Even · D 48.7% · R 50.1% · Other 1.2%
- 2008→2024 swing
- +0.4pp no change · 2008: -1.9pp · 2024: -1.5pp
- All cycles
- 2024: R+1.5 2020: D+3.8 2016: R+1.5 2012: R+3.6 2008: R+1.9
Not yet ingested
- Civics
- —
Market trends
- HPI YoY
- ▼ -314.81%
- Current HPI
- 281.2688
- Rent YoY
- ▲ 2.11%
- Metro
- Jacksonville, FL
- State GDP YoY
- ▲ 3.28%
- F500 in state
- 36
Industry mix (Fortune 500 HQ in FL)
| Industry | F500 HQs | Revenue |
|---|---|---|
| Industrial Technology | 2 | $29B |
|
||
| Insurance | 2 | $17B |
|
||
| Retail | 1 | $60B |
|
||
| Technology Distribution | 1 | $58B |
|
||
| Homebuilding | 1 | $35B |
|
||
| Technology Manufacturing | 1 | $35B |
|
||
Price history
+265.9% since first listed11 events — show timeline
- 2026-05-20 Pending — realMLS
- 2026-05-08 Listed $129,900 realMLS
- 2026-04-18 Rental Removed $1,405 RENTPROGRESS
- 2026-04-15 Price Changed $1,405 RENTPROGRESS
- 2026-04-14 Price Changed $1,395 RENTPROGRESS
- 2026-04-12 Price Changed $1,400 RENTPROGRESS
- 2026-04-09 Price Changed $1,390 RENTPROGRESS
- 2026-04-08 Price Changed $1,385 RENTPROGRESS
- 2026-04-06 Listed for Rent $1,380 RENTPROGRESS
- 1986-04-01 Sold (Public Records) $40,700 Public Records
- 1984-06-01 Sold (Public Records) $35,500 Public Records
Property tax history
+16.0%/yrLatest (2025): $2,368 · +17.1% YoY. Source: county tax records.
Cash-flow waterfall
monthlySold comps — $/sqft
last 12 mo · ≤1 miLoading sold comps…