35237 Breakers St Unit E-711 · Long Neck, DE
Flood risk 10/10 · Severe
- FEMA flood zone
- AE
- Chance of flooding over 30 yrs
- 0.99%
- Est. flood insurance / yr
- $2,026 – $9,024
Fire risk 1/10 · Minimal
- Est. fire insurance / yr
- $476 – $884
Heat risk 8/10 · Major
- Hot days now (above 101°F)
- 7 days/yr
- Hot days in 30 yrs
- 18 days/yr
Wind risk 8/10 · Major
- Chance of severe wind over 30 yrs
- 80.0%
Air-quality risk 2/10 · Minimal
- Unhealthy air days now
- 1 days/yr
- Unhealthy air days in 30 yrs
- 1 days/yr
Risk factors via First Street. Map © Google.
Why this score? — see what drove the B- grade
The composite is a weighted blend of 9 inputs, each scored 0–100. Each bar is that input's sub-score; the figure is the points it added to the 100-point composite (weight × sub-score).
- Cash flow +30.0/30.0
- 1% rule +10.0/10.0
- DSCR +10.0/10.0
- Condition / age +4.0/5.0
- Livability +3.5/5.0
- Schools +2.9/10.0
- Rent growth +2.5/5.0
- ARV discount +2.3/15.0
- Appreciation +0.0/10.0
$137,000
🖨 Deal sheet 📄 Offer letter ✓ Due diligence
Listing remarks MLS
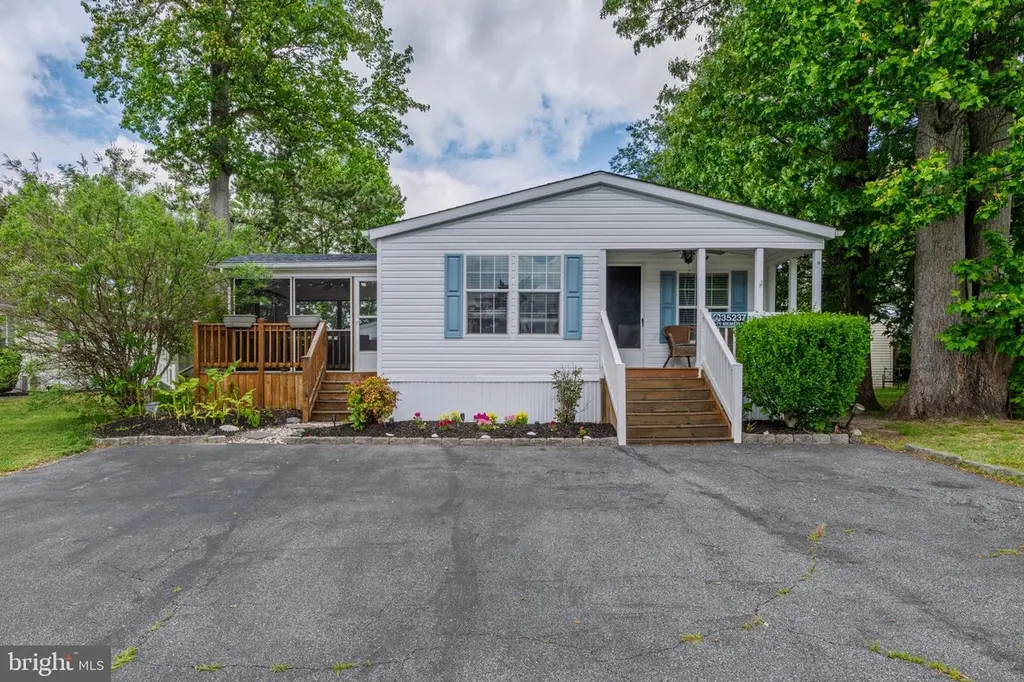
Live the Ultimate Coastal Dream at Pot-Nets Bayside! Discover the perfect blend of resort-style living and unbeatable value. Nestled along the scenic Indian River and Rehoboth Bays, this highly sought-after community offers an incredible, year-round vacation lifestyle. This vibrant, golf-cart-friendly neighborhood boasts premier amenities, including private beaches, full-service marinas, boat slips, fishing piers, sparkling pools, and walking trails. Tucked into this coastal paradise is a beautiful, low-maintenance 2005 double-wide manufactured home designed for easy living. The interior features an open-concept flow between the spacious living and dining area—perfect for entertaining. Cook with ease in the eat-in kitchen. Retreat to the private primary suite, complete with a walk-in shower and soaking tub. Move the party outside to your screened porch, where you can unwind against a serene, private wooded backdrop. This property also delivers excellent functionality with a two-car asphalt driveway and a dedicated outbuilding for all your beach gear and water toys. Whether you are looking for a turnkey vacation getaway or a full-time beach retreat, this home delivers. Enjoy local community perks plus quick access to the world-class dining, tax-free shopping, golf courses, and iconic beaches of Rehoboth and Lewes. Don't miss this rare opportunity to own your piece of the Delaware coast—schedule your tour today! ________________________________________
Key facts
- Boat slips
- Full service marinas
- Sparkling pools
Tags
Neighborhood map
What this means for you Summary
Snapshot
- This is a 3-bed/2.0-bath single-family listed at $137k. Condition is rated good.
Deal economics
- At list price, monthly cash flow is $363 ($4k/yr) — positive.
- The deal already cash-flows at list — no discount required.
- Meets the 1% rule at list price ($2k rent vs $137k).
- Recommended offer: $133k (3.0% below list) — sets the bar for market timing.
- Cap rate 13.5% vs local median 3.2% in Long Neck — top-decile yield for the area; either an underpriced asset or a hidden risk that comps aren't pricing in. Stress-test before assuming the spread holds.
Location & tenants
- Location reads 69/100 on livability (#30 in DE) — a middle-class / working-renter tenant base. Strengths: cost of living A+, housing A+, crime A-; Watch: employment D+, schools F, amenities F.
- Indian River School District (rural): math 25% / reading 41% proficiency, ranked #14 of 26 in DE (top 54%) — families likely to look elsewhere, expect single-tenant / working-renter base with shorter leases.
- Market conditions: 865 active listings in the ZIP; 2 comparable units currently listed for rent nearby; solid renter incomes; 4,354 units permitted in Sussex County in 2024 (344 in 5+ unit buildings).
- This rent runs 34% of the median local income ($78k/yr) — at the standard rent-burdened threshold; future hikes will face affordability resistance.
Forward outlook
- Local home prices are declining (-3.0%/yr); year-one equity from $947 of loan paydown is wiped out by about $4k of value loss. Plan a longer hold.
- Sussex County population projected at +25% by 2050 — long-run rental-demand tailwind backs the buy-and-hold thesis.
- At projected returns (-3.0% appreciation + 3.0% rent growth), your $38k cash investment doubles in ~10 years — after that, you're playing with house money.
Negotiation context
- It's been on market 33 days — a 3% lower offer ($133k) is reasonable based on typical stale-listing flexibility.
- 2 sale attempts with the ask held roughly flat each time — persistent listings suggest the price (not the market) is what's stuck; bring a comps-based counter.
Risks & watch-outs
- Watch-outs: flood insurance adds $460/mo.
- Climate carrying-cost: in FEMA flood zone AE (mandatory federal flood insurance); severe wind risk, 80% chance of damaging wind over 30y; extreme-heat days projected 7→18/yr by 2055 (HVAC capex compounding) — expect insurance premiums to compound above CPI over the hold.
Questions for the listing agent
- It's been on market 33 days. Have you received any prior offers? Is the seller open to a 3% concession, seller financing, or rate buy-down credit?
- What's the actual annual flood-insurance premium (NFIP or private), and is the property in a SFHA with mandatory coverage?
- Is there a deadline driving the sale (1031 exchange, divorce, estate, relocation)? That informs how much negotiation room exists.
- Schools are F-rated, which usually means shorter tenancies and higher turnover. Who's the typical renter profile here, and what's been the actual vacancy rate?
- What's the average days-on-market for RENTAL listings here right now (not sales)? A rising rental-DOM trend means longer vacancies and softer asking-rent achievability than the comps imply.
- What's the recent tenant-quality profile in this submarket — average credit score on applications, eviction rate, late-payment / NSF rate, and stable-employment percentage? A property-management company in the area should have these aggregated.
- How much new for-sale + rental construction is in the pipeline within 1–3 miles? Heavy new supply typically softens prices + rents 12–24 months out; constrained supply supports both.
Investment metrics
- 1% rule
- 1.64% ✓
- Cap rate
- 13.50%
- Cash-on-cash
- 25.74%
- DSCR
- 2.15
- GRM
- 5.1
CMA / ARV
- ARV (median comp)
- $122,776
- List price
- $137,000
- Delta
- 18.10%
- Verdict
- OVERPRICED
- Comps
- 20 within 1.0 mi
Show comp detail 12 sales within ~0.75 mi
| Address | Dist | Beds/Ba | Sqft | Sold | Price | $/sf | Match |
|---|---|---|---|---|---|---|---|
| 34448 Fleet St Unit E-768 | 0.12mi | 3/2.0 | 980 (-7%) | 8mo | $124,500 | $127 | 76 |
| 34991 Starboard Ct #51975 | 0.42mi | 3/2.0 | 1,056 (0%) | 8mo | $121,200 | $115 | 73 |
| 34665 Scarp St | 0.27mi | 3/1.5 | 980 (-7%) | 6mo | $41,500 | $42 | 68 |
| 34952 Breakers St | 0.52mi | 3/2.0 | 1,036 (-2%) | 11mo | $160,000 | $154 | 64 |
| 34144 Indian Cabin Creek Rd #259 | 0.68mi | 3/2.0 | 1,068 (+1%) | 4mo | $95,000 | $89 | 64 |
| 34635 Deck St Unit E-323 | 0.29mi | 4/2.0 (+1) | 1,168 (+11%) | 3mo | $134,900 | $115 | 61 |
| 34957 Starboard Ct | 0.43mi | 3/2.0 | 980 (-7%) | 10mo | $54,000 | $55 | 59 |
| 34056 Village Way | 0.57mi | 3/2.0 | 1,136 (+8%) | 6mo | $155,900 | $137 | 56 |
| 35296 5th St #46027 | 0.75mi | 4/2.0 (+1) | 1,066 (+1%) | 4mo | $115,000 | $108 | 56 |
| 35262 7th St | 0.71mi | 2/2.0 (-1) | 1,132 (+7%) | 0mo | $98,000 | $87 | 50 |
| 34401 Mallard Rd #502 | 0.64mi | 3/2.0 | 1,200 (+14%) | 3mo | $99,900 | $83 | 45 |
| 26204 Skip Jack Ln #49539 | 0.54mi | 2/2.0 (-1) | 924 (-12%) | 10mo | $67,000 | $73 | 41 |
Match score weights: distance 35% · size 25% · config 20% · recency 20%. Top-matched comps best support the ARV.
Projected returns pro-forma
-3.0% appreciation · 3.0% rent growth · sell at horizon
- IRR
- 0.8%
- Equity multiple
- 1.03×
- Total profit
- $1,207
- Equity at exit
- $20,427
- IRR
- 10.6%
- Equity multiple
- 1.84×
- Total profit
- $32,070
- Equity at exit
- $11,845
Cash invested: $38,360 (down + closing). Projections, not guarantees.
Landlord ↔ Tenant lean methodology
- Overall (STATE)
- 70 Landlord-Friendly
- State Delaware
- 70 Landlord-Friendly · D+7
- County
- — inherits STATE
- City
- — inherits STATE
ZIP-level market 19966
- Home prices YoY
- -6.4%
- Active inventory
- 865
- Price-to-rent
- 5.1×
Monthly cashflow live
- Estimated rent
- $2,240 medium interval (Pro) →
- Mortgage (P&I)
- −$718
- Tax est. 1.5%
- −$171 /mo · $2,055/yr
- Insurance
- −$57
- Flood insurance flood zone
- −$460 /mo · $5,525/yr
- HOA
- −$0
- Vacancy / Maint / Mgmt
- −$470
- Net cashflow
- $363
Break-even live
UW: 25.0% down · 7.5% · 30yr · 1.5% tax · 5.0% vac · 8.0% maint · 8.0% mgmt
Financing live
Cash to close
- Down payment
- $34,250
- Closing costs
- $4,110
- Reserves months
- —
- Total cash needed
- —
Loan-product check · same deal, 3 products live
Conventional
25% down · 7.5% · 30yr
- Down + closing
- —
- Monthly P&I
- —
- Monthly cashflow
- —
- DSCR
- —
- Eligible?
- —
Personal DTI + credit; lowest rate.
DSCR
20% down · 8.5% · 30yr
- Down + closing
- —
- Monthly P&I
- —
- Monthly cashflow
- —
- DSCR
- —
- Eligible?
- —
No personal income docs; deal must DSCR.
Hard money
10% down · 12.0% · 12mo
- Down + closing
- —
- Monthly P&I
- —
- Monthly cashflow
- —
- DSCR
- —
- Eligible?
- —
Short-term bridge; refi at stabilization.
Rent comps 2 comps
| Address | Beds | Baths | Sqft | Rent | $/sqft | DOM | Units | Dist |
|---|---|---|---|---|---|---|---|---|
| 35829 S Gloucester Cir Unit 35829 Long Neck, DE | 3.0 | 2.5 | 1500 | $1,995 | $1.33 | 13d | 1 | 0.95mi |
| 22392 Circle Rd , DE | 2.0 | 1.0 | 1000 | $1,523 | $1.52 | 13d | 1 | 1.48mi |
Listing history 21 events
-
2026-06-18days on market $137,000 Active 33 DOM
-
2026-06-17days on market $137,000 Active 32 DOM
-
2026-06-16days on market $137,000 Active 31 DOM
-
2026-06-15days on market $137,000 Active 30 DOM
-
2026-06-14days on market $137,000 Active 28 DOM
-
2026-06-13days on market $137,000 Active 27 DOM
-
2026-06-10days on market $137,000 Active 25 DOM
-
2026-06-09days on market $137,000 Active 24 DOM
-
2026-06-09price $137,000 Active 23 DOM
-
2026-06-08days on market $139,900 Active 23 DOM
-
2026-06-07days on market $139,900 Active 22 DOM
-
2026-06-02days on market $139,900 Active 17 DOM
-
2026-06-01days on market $139,900 Active 16 DOM
-
2026-05-31days on market $139,900 Active 15 DOM
-
2026-05-30days on market $139,900 Active 14 DOM
-
2026-05-16$139,900 Active 1486-char remark
Show marketing remark (1486 chars)
Live the Ultimate Coastal Dream at Pot-Nets Bayside! Discover the perfect blend of resort-style living and unbeatable value. Nestled along the scenic Indian River and Rehoboth Bays, this highly sought-after community offers an incredible, year-round vacation lifestyle. This vibrant, golf-cart-friendly neighborhood boasts premier amenities, including private beaches, full-service marinas, boat slips, fishing piers, sparkling pools, and walking trails. Tucked into this coastal paradise is a beautiful, low-maintenance 2005 double-wide manufactured home designed for easy living. The interior features an open-concept flow between the spacious living and dining area—perfect for entertaining. Cook with ease in the eat-in kitchen. Retreat to the private primary suite, complete with a walk-in shower and soaking tub. Move the party outside to your screened porch, where you can unwind against a serene, private wooded backdrop. This property also delivers excellent functionality with a two-car asphalt driveway and a dedicated outbuilding for all your beach gear and water toys. Whether you are looking for a turnkey vacation getaway or a full-time beach retreat, this home delivers. Enjoy local community perks plus quick access to the world-class dining, tax-free shopping, golf courses, and iconic beaches of Rehoboth and Lewes. Don't miss this rare opportunity to own your piece of the Delaware coast—schedule your tour today! ________________________________________
-
2026-05-08historical
-
2026-04-27price $145,000
-
2026-03-17price $149,000
-
2025-11-29price $155,000
-
2025-10-06$160,000 Active
ⓘ Source: listings_history table (triggers on properties + properties_extension) + one-shot
backfill from property_details.listing_events for pre-trigger history.
Climate risk First Street
- Flood 10/10 Extreme FEMA zone AE · 99% chance over 30 yrs
- Wildfire 1/10 Low
- Heat 8/10 Severe 7 d/yr ≥101°F today · 18 d/yr by 30 yrs out
- Wind 8/10 Severe 80% chance of damaging wind over 30 yrs
- Air quality 2/10 Low 1 unhealthy d/yr today · 1 by 30 yrs out
Nearby sold comps map
Loading sold comps map…
Walkable amenities ~0.75 mi
Loading nearby amenities…
Taxation est. · year 1
- Rental income
- $26,882
- − Mortgage interest
- −$7,674
- − Property taxes
- −$2,055
- − Insurance
- −$6,210
- − Repairs & maintenance
- −$2,151
- − Management
- −$2,151
- − Depreciation
- −$3,985
- Taxable income
- $2,656
- Est. tax owed @ 24.0%
- −$637
- After-tax cash flow
- $3,713/yr
For passive investors: Depreciation is non-cash, so a rental often shows a tax loss while cash-flowing — sheltering income. Rental losses are passive: they offset passive income freely, and up to $25,000/yr can offset ordinary (W-2) income if you actively participate and your MAGI is under $100k (phasing out to $0 by $150k); unused losses carry forward. On sale, claimed depreciation is recaptured at up to 25%, and gains may owe capital-gains tax (a 1031 exchange can defer both). Figures are a year-1 estimate at your 24.0% rate — not tax advice; consult a CPA.
Condition & rehab AI · 12 photos
This low-maintenance 2005 double-wide manufactured home is in good condition and ready for a new owner. It offers an open-concept floor plan and is located in a desirable coastal community with amenities like private beaches and marinas.
Value-add opportunities
- Both Paint the interior walls — Fresh paint can make the home more appealing to buyers and renters
- Both Replace carpeted flooring with hardwood or tile — Hardwood or tile flooring can increase the home's value and make it more attractive to buyers and renters
Renovation cost estimate screening
Value-add ROI direction
- Both Paint the interior walls — Fresh paint can make the home more appealing to buyers and renters ↑
- Both Replace carpeted flooring with hardwood or tile — Hardwood or tile flooring can increase the home's value and make it more attractive to buyers and renters ↑
ⓘ Cost ranges are severity-bucket heuristics (US national rule-of-thumb). Get contractor quotes + a written scope before underwriting a rehab budget.
Schools (NCES district)
- District
- Indian River School District
- NCES district ID
- 1000680
- Math proficiency
- 25% ▼ -27.00%
- Reading proficiency
- 41% ▼ -17.00%
- Median HH income
- $53,838
- Composite
- 28.99/100
- National rank
- #6620
- State rank
- #14 of 26 in DE
Livability — Long Neck
- Score
- 69/100
- State rank
- #30
- US rank
- #8720
Category grades
Schools grade is shown separately in the Schools card above.
Census & demographics
- Census place
- Long Neck, DE
- County
- Sussex County · 82,708 people
- Metro
- Salisbury, MD-DE
- Population (ZIP)
- 35,884
- Household income
- $78,305
- Rent vs Own
- Severe rent burden
- 464.0
Population outlook (Sussex County) Hauer SSP2
- Today (2025)
- 248,853 people
- By 2030
- 264,464 · +6.3%
- By 2040
- 290,980 · +16.9%
- By 2050
- 311,259 · +25.1%
- By 2075
- 352,488 · +41.6%
- By 2100
- 367,406 · +47.6%
Race, ethnicity, and origin ACS 2023
- Neighborhood character
- Predominantly White (74%)
- Race & ethnicity
- White 74% Hispanic / Latino 11% Black 8% Two or more races 7% Native American 3% Asian 1%
- Hispanic origin (detail)
- Mexican 3%
- Common ancestry
- Romanian 4% Slovak 2% Serbian 1%
- Foreign-born
- 8% · Canada, China
- Languages at home
- 88% English-only · Spanish 9% Other Indo-European 1%
Political lean MEDSL · Sussex
- 2024 margin
- R (+11.0) · D 43.9% · R 54.9% · Other 1.2%
- 2008→2024 swing
- -2.4pp toward R · 2008: -8.6pp · 2024: -11.0pp
- All cycles
- 2024: R+11.0 2020: R+11.2 2016: R+22.0 2012: R+13.0 2008: R+8.6
Not yet ingested
- Civics
- —
Market trends
- HPI YoY
- ▼ -18.26%
- Current HPI
- 268.5609
- Rent YoY
- —
- Metro
- Salisbury, MD-DE
- State GDP YoY
- —
- F500 in state
- 0
Price history
-12.6% since first listed6 events — show timeline
- 2026-05-16 Listed $139,900 BRIGHT MLS
- 2026-05-08 Listing Removed — BRIGHT MLS
- 2026-04-27 Price Changed $145,000 BRIGHT MLS
- 2026-03-17 Price Changed $149,000 BRIGHT MLS
- 2025-11-29 Price Changed $155,000 BRIGHT MLS
- 2025-10-06 Listed $160,000 BRIGHT MLS
Cash-flow waterfall
monthlySold comps — $/sqft
last 12 mo · ≤1 miLoading sold comps…