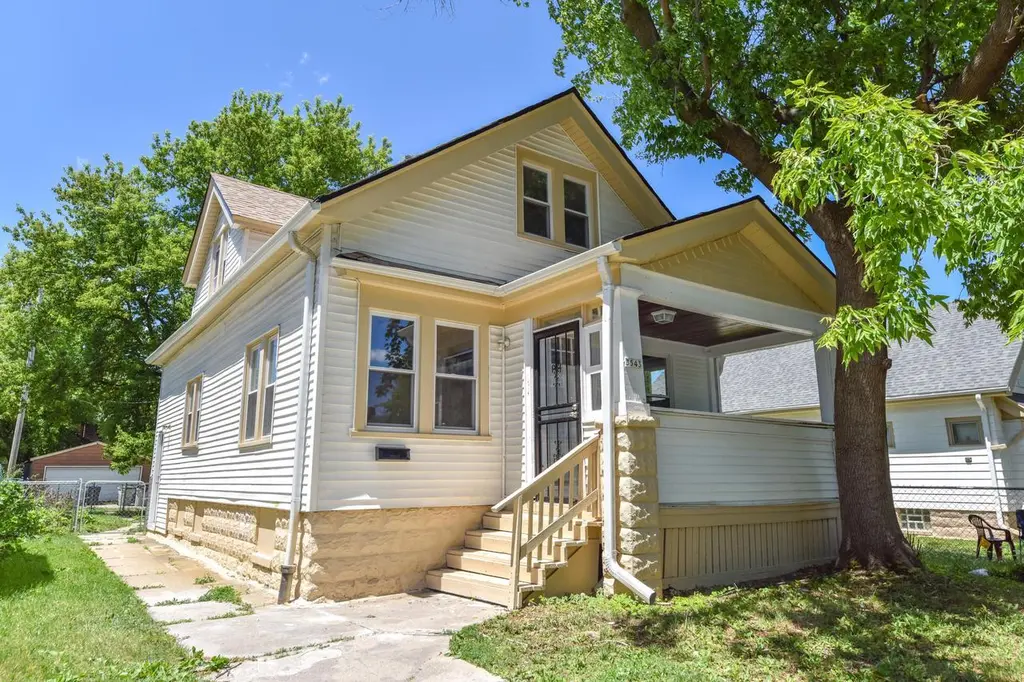
3543 N 9th St · Milwaukee, WI
Flood risk 1/10 · Minimal
- FEMA flood zone
- X (unshaded)
- Chance of flooding over 30 yrs
- 0.0%
- Est. flood insurance / yr
- $473 – $860
Fire risk 1/10 · Minimal
- Est. fire insurance / yr
- $636 – $1,182
Heat risk 2/10 · Minimal
- Hot days now (above 98°F)
- 7 days/yr
- Hot days in 30 yrs
- 13 days/yr
Wind risk 2/10 · Minimal
- Chance of severe wind over 30 yrs
- —
Air-quality risk 3/10 · Minor
- Unhealthy air days now
- 3 days/yr
- Unhealthy air days in 30 yrs
- 4 days/yr
Risk factors via First Street. Map © Google.
Why this score? — see what drove the C grade
The composite is a weighted blend of 9 inputs, each scored 0–100. Each bar is that input's sub-score; the figure is the points it added to the 100-point composite (weight × sub-score).
- Cash flow +15.5/30.0
- ARV discount +11.1/15.0
- Appreciation +10.0/10.0
- DSCR +4.8/10.0
- Rent growth +4.6/5.0
- Livability +4.0/5.0
- 1% rule +3.6/10.0
- Condition / age +2.5/5.0
- Schools +1.2/10.0
$154,900
🖨 Deal sheet 📄 Offer letter ✓ Due diligence
Listing remarks MLS
Good Bones but needs work! It's 1456 ft square, has 4 true bedrooms and two full baths. Interior is rough but has good bones and decent curb appeal. Water is turned off at the street but plumbing is in place along with the rest of the mechanicals. There is a wet spot in the living room ceiling but the seller stated that the shingles were replace not to long ago and wetness may be caused from damaged gutters and ice damning. It has an updated electric panel. This property likely will not qualify for conventional financing, cash or hard money buyers are preferred. Sight unseen offers will not be considered. Broker did not verify room sizes.
Key facts
- 3,920 sq ft lot
- Built 1923
- Listed 6 days
Property features AI
Finance
- Other: Appliances excluded from sale: Refrigerator, Range, Microwave
Exterior
- Utilities: Municipal water; Municipal sewer; Natural gas
- Home design: 1.5-story single-family home; Year built source: Assessor/Public Record
- Construction: Vinyl siding
- Exterior features: Vinyl exterior; Less than 1/2 acre lot (approx. 0.09 acre); Zoned RT4
Interior
- Kitchen: Microwave; Range; Refrigerator
- Bedrooms: Master bedroom (main level) approximately 11 x 11; Bedroom 2 (upper level) approximately 10 x 9; Bedroom 3 (upper level) approximately 9 x 9; Bedroom 4 approximately 9 x 10
- Bathrooms: Two full bathrooms; Ceramic tile; Shower over tub; Tub only
- Heating & cooling: Forced air heating; Natural gas heat
- Interior features: Full basement; Living room (main level) approximately 20 x 20; Dining room (main level) approximately 15 x 15
Neighborhood map
What this means for you Summary
Snapshot
- This is a 4-bed/2.0-bath single-family listed at $155k.
Deal economics
- At list price, monthly cash flow is $62 ($749/yr) — positive.
- The deal already cash-flows at list — no discount required.
- To meet the 1% rule (rent ≥ 1% of price), the offer needs to be $133k (13.9% below list).
- Recommended offer: $133k (13.9% below list) — sets the bar for 1% rule.
- Cap rate 6.8% vs local median 5.1% in Milwaukee — top-decile yield for the area; either an underpriced asset or a hidden risk that comps aren't pricing in. Stress-test before assuming the spread holds.
Location & tenants
- Location reads 81/100 on livability (#55 in WI, #1,534 nationally) — a professional / high-income tenant draw. Strengths: amenities A+, commute A+, cost of living A+; Watch: employment D+, schools F, crime F.
- Milwaukee School District (urban): math 10% / reading 18% proficiency, ranked #337 of 342 in WI (top 98%) — low school quality limits family demand, transient renter base, plan for 1-2y turnover; 77% free/reduced lunch — lower-income household profile, screen leases tightly.
- Market conditions: Rents rising fast (+8.3%/yr); 150 active listings in the ZIP; 19 comparable units currently listed for rent nearby; rentals at typical pace (median 24d on market — plan ~3-4 weeks tenant-placement turnaround); lower-income renter base — watch delinquency; 1,017 units permitted in Milwaukee County in 2024 (803 in 5+ unit buildings).
- At $1,334/mo this rent would consume 55% of the median local household income ($29k/yr) (locally 2061% of renters already pay >50% of income on rent) — very limited rent-growth headroom before tenants either downsize or default.
Forward outlook
- In year one you build about $17k of equity ($1k loan paydown + $15k appreciation (10.0% local appreciation)).
- Milwaukee County population projected at +4% by 2050 — modest demand growth; plan on rents tracking national, not racing it.
- At projected returns (10.0% appreciation + 8.0% rent growth), your $43k cash investment doubles in ~3 years — after that, you're playing with house money.
- By year 3, paydown + projected appreciation supports a ~$42k cash-out refi (75% LTV) — recoverable capital for the next deal without selling this one.
Negotiation context
- Only 6 days on market — expect competitive offers; lowballing is unlikely to land.
- 2 sale attempts since 2y ago with the ask held roughly flat each time — persistent listings suggest the price (not the market) is what's stuck; bring a comps-based counter.
- Current owner paid $60k; list at $155k implies a 158% gain — meaningful room to come down on a strong offer.
Risks & watch-outs
- Watch-outs: built in 1923 — expect roof / HVAC / electrical / plumbing capex.
Questions for the listing agent
- Built in 1923 — when were the roof, HVAC, electrical panel, plumbing, and water heater last replaced?
- Is there a deadline driving the sale (1031 exchange, divorce, estate, relocation)? That informs how much negotiation room exists.
- Schools are F-rated, which usually means shorter tenancies and higher turnover. Who's the typical renter profile here, and what's been the actual vacancy rate?
- Crime grade is F in this area — have there been break-ins, vandalism, or insurance claims at this property in the last 3 years? What carrier currently insures it and at what premium?
- What's the average days-on-market for RENTAL listings here right now (not sales)? A rising rental-DOM trend means longer vacancies and softer asking-rent achievability than the comps imply.
- What's the recent tenant-quality profile in this submarket — average credit score on applications, eviction rate, late-payment / NSF rate, and stable-employment percentage? A property-management company in the area should have these aggregated.
- How much new for-sale + rental construction is in the pipeline within 1–3 miles? Heavy new supply typically softens prices + rents 12–24 months out; constrained supply supports both.
Investment metrics
- 1% rule
- 0.86% ✗
- Cap rate
- 6.78%
- Cash-on-cash
- 1.73%
- DSCR
- 1.08
- GRM
- 9.7
CMA / ARV
- ARV (on-the-fly)
- $168,475
- Comps found
- 12
Show comp detail 12 sales within ~0.75 mi
| Address | Dist | Beds/Ba | Sqft | Sold | Price | $/sf | Match |
|---|---|---|---|---|---|---|---|
| 3279 N Dr William Finlayson St | 0.40mi | 4/2.0 | 1,504 (+3%) | 1mo | $202,500 | $135 | 76 |
| 3783 N 9th St | 0.25mi | 4/2.0 | 1,562 (+7%) | 2mo | $220,000 | $141 | 75 |
| 3700 N 14th St | 0.32mi | 5/2.0 (+1) | 1,611 (+10%) | 2mo | $205,000 | $127 | 62 |
| 3422 N 11th St | 0.17mi | 5/2.0 (+1) | 1,249 (-15%) | 1mo | $159,000 | $127 | 62 |
| 1225 W Keefe Ave | 0.23mi | 5/1.0 (+1) | 1,294 (-12%) | 1mo | $90,000 | $70 | 60 |
| 3311 N 8th St | 0.24mi | 4/1.0 | 1,259 (-14%) | 2mo | $63,000 | $50 | 59 |
| 3840 N 18th St St | 0.61mi | 3/2.0 (-1) | 1,413 (-4%) | 2mo | $120,000 | $85 | 59 |
| 3766 N Vel R Phillips Ave | 0.45mi | 4/3.0 | 1,621 (+11%) | 4mo | $129,000 | $80 | 54 |
| 2937 N 11th St | 0.74mi | 4/2.0 | 1,347 (-8%) | 1mo | $155,000 | $115 | 51 |
| 3735 N 15th St | 0.42mi | 5/1.0 (+1) | 1,263 (-14%) | 1mo | $155,000 | $123 | 47 |
| 3234 N Achilles St | 0.75mi | 4/1.5 | 1,645 (+12%) | 1mo | $105,000 | $64 | 42 |
| 4110 N 7th St | 0.66mi | 3/1.0 (-1) | 1,296 (-12%) | 4mo | $95,000 | $73 | 37 |
Match score weights: distance 35% · size 25% · config 20% · recency 20%. Top-matched comps best support the ARV.
Projected returns pro-forma
10.0% appreciation · 8.0% rent growth · sell at horizon
- IRR
- 27.2%
- Equity multiple
- 3.20×
- Total profit
- $95,360
- Equity at exit
- $139,546
- IRR
- 25.2%
- Equity multiple
- 7.80×
- Total profit
- $295,109
- Equity at exit
- $300,937
Cash invested: $43,372 (down + closing). Projections, not guarantees.
Landlord ↔ Tenant lean methodology
- Overall (STATE)
- 73 Landlord-Friendly
- State Wisconsin
- 73 Landlord-Friendly · R+2
- County
- — inherits STATE
- City
- — inherits STATE
ZIP-level market 53206
- Rents YoY
- 8.3%
- Active inventory
- 150
- Price-to-rent
- 9.7×
Monthly cashflow live
- Estimated rent
- $1,334 high interval (Pro) →
- Mortgage (P&I)
- −$812
- Tax from tax record
- −$115 /mo · $1,379/yr
- Insurance
- −$65
- HOA
- −$0
- Vacancy / Maint / Mgmt
- −$280
- Net cashflow
- $62
Break-even live
UW: 25.0% down · 7.5% · 30yr · 1.5% tax · 5.0% vac · 8.0% maint · 8.0% mgmt
Financing live
Cash to close
- Down payment
- $38,725
- Closing costs
- $4,647
- Reserves months
- —
- Total cash needed
- —
Loan-product check · same deal, 3 products live
Conventional
25% down · 7.5% · 30yr
- Down + closing
- —
- Monthly P&I
- —
- Monthly cashflow
- —
- DSCR
- —
- Eligible?
- —
Personal DTI + credit; lowest rate.
DSCR
20% down · 8.5% · 30yr
- Down + closing
- —
- Monthly P&I
- —
- Monthly cashflow
- —
- DSCR
- —
- Eligible?
- —
No personal income docs; deal must DSCR.
Hard money
10% down · 12.0% · 12mo
- Down + closing
- —
- Monthly P&I
- —
- Monthly cashflow
- —
- DSCR
- —
- Eligible?
- —
Short-term bridge; refi at stabilization.
Rent comps 19 comps
| Address | Beds | Baths | Sqft | Rent | $/sqft | DOM | Units | Dist |
|---|---|---|---|---|---|---|---|---|
| 3298 N 13th St Milwaukee, WI | 3.0 | 1.0 | 885 | $895 | $1.01 | 43d | 1 | 0.35mi |
| 3416 N 17th St Unit 1 Milwaukee, WI | 3.0 | 1.0 | 1200 | $1,100 | $0.92 | 43d | 1 | 0.48mi |
| 3703 N 1st St Unit Upper-3705 Milwaukee, WI | 3.0 | 1.0 | 1034 | $1,200 | $1.16 | 43d | 1 | 0.60mi |
| 3045 N 11th St #3047 Milwaukee, WI | 3.0 | 1.0 | 1065 | $1,175 | $1.10 | 4d | 1 | 0.62mi |
| 2106A W Keefe Ave Unit 2106 Lower Milwaukee, WI | 3.0 | 1.0 | 1300 | $1,100 | $0.85 | 17d | 1 | 0.79mi |
| 312 E Townsend St Unit 312 Milwaukee, WI | 3.0 | 1.0 | 1400 | $1,250 | $0.89 | 23d | 1 | 0.83mi |
| 223 E Burleigh St Unit 223 Milwaukee, WI | 4.0 | 1.0 | 1153 | $1,395 | $1.21 | 43d | 1 | 0.93mi |
| 3042 N Palmer St #5 Milwaukee, WI | 3.0 | 1.0 | 1718 | $1,050 | $0.61 | 23d | 1 | 0.94mi |
| 2116 W Atkinson Ave Unit A Milwaukee, WI | 4.0 | 1.0 | 1707 | $2,000 | $1.17 | 1d | 1 | 1.00mi |
| 3029 N Holton St Milwaukee, WI | 3.0 | 1.0 | 980 | $1,200 | $1.22 | 43d | 1 | 1.10mi |
| 2945 N 23rd St Milwaukee, WI | 3.0 | 1.0 | 1014 | $1,195 | $1.18 | 43d | 1 | 1.18mi |
| 3388 N 27th St Unit 3388 Front House Milwaukee, WI | 4.0 | 1.0 | 1212 | $1,550 | $1.28 | 4d | 1 | 1.22mi |
| 2724 N Palmer St Milwaukee, WI | 3.0 | 1.0 | 900 | $1,300 | $1.44 | 43d | 1 | 1.24mi |
| 2577 N Vel R Phillips Ave Milwaukee, WI | 3.0 | 1.0 | 1048 | $1,400 | $1.34 | 17d | 1 | 1.25mi |
| 2704 W Concordia Ave Unit Na Milwaukee, WI | 5.0 | 2.0 | 1856 | $2,500 | $1.35 | 23d | 1 | 1.27mi |
| 2741 N 23rd St Milwaukee, WI | 3.0 | 1.0 | 900 | $1,050 | $1.17 | 14d | 1 | 1.35mi |
| 2741 N 23rd St Unit 2 Milwaukee, WI | 3.0 | 1.0 | 1000 | $1,100 | $1.10 | 17d | 1 | 1.35mi |
| 2821 W Concordia Ave Milwaukee, WI | 3.0 | 1.5 | 1098 | $1,595 | $1.45 | 2d | 1 | 1.35mi |
| 2308 W Clarke St Milwaukee, WI | 4.0 | 2.0 | 1545 | $1,750 | $1.13 | 23d | 1 | 1.50mi |
Listing history 6 events
-
2026-06-18days on market $154,900 Active 6 DOM
-
2026-06-17days on market $154,900 Active 5 DOM
-
2026-06-16days on market $154,900 Active 4 DOM
-
2026-06-15days on market $154,900 Active 3 DOM
-
2026-06-13remarks 37-char remark
-
2026-06-13$154,900 Active 1 DOM
ⓘ Source: listings_history table (triggers on properties + properties_extension) + one-shot
backfill from property_details.listing_events for pre-trigger history.
Tax reassessment forecast WI · Partial reset (capped growth)
- Current annual tax
- $1,379 · $115/mo
- Projected year-2 tax
- $2,122 · $177/mo
- Expected delta
- +$744/yr (+$62/mo · 53.9%)
ⓘ Screening estimate from a state-policy table — verify with the county assessor before closing.
Climate risk First Street
- Flood 1/10 Low FEMA zone X (unshaded) · 0% chance over 30 yrs
- Wildfire 1/10 Low
- Heat 2/10 Low 7 d/yr ≥98°F today · 13 d/yr by 30 yrs out
- Wind 2/10 Low
- Air quality 3/10 Moderate 3 unhealthy d/yr today · 4 by 30 yrs out
Nearby sold comps map
Loading sold comps map…
Walkable amenities ~0.75 mi
Loading nearby amenities…
Taxation est. · year 1
- Rental income
- $16,012
- − Mortgage interest
- −$8,677
- − Property taxes
- −$1,379
- − Insurance
- −$774
- − Repairs & maintenance
- −$1,281
- − Management
- −$1,281
- − Depreciation
- −$4,506
- Taxable loss
- −$1,886
- Est. tax savings @ 24.0%
- +$453
- After-tax cash flow
- $1,201/yr
For passive investors: Depreciation is non-cash, so a rental often shows a tax loss while cash-flowing — sheltering income. Rental losses are passive: they offset passive income freely, and up to $25,000/yr can offset ordinary (W-2) income if you actively participate and your MAGI is under $100k (phasing out to $0 by $150k); unused losses carry forward. On sale, claimed depreciation is recaptured at up to 25%, and gains may owe capital-gains tax (a 1031 exchange can defer both). Figures are a year-1 estimate at your 24.0% rate — not tax advice; consult a CPA.
Schools (NCES district)
- District
- Milwaukee School District
- NCES district ID
- 5509600
- Math proficiency
- 10% ▼ -5.00%
- Reading proficiency
- 18% ▬ 0.00%
- Median HH income
- $36,339
- Composite
- 11.61/100
- National rank
- #9696
- State rank
- #337 of 342 in WI
Livability — Milwaukee
- Score
- 81/100
- State rank
- #55
- US rank
- #1534
Category grades
Schools grade is shown separately in the Schools card above.
Census & demographics
- Census place
- Milwaukee, WI
- County
- Milwaukee County · 926,379 people
- City population
- 573,768
- Metro
- Milwaukee-Waukesha, WI
- Population (ZIP)
- 19,887
- Household income
- $29,336
- Rent vs Own
- Severe rent burden
- 2061.0
Population outlook (Milwaukee County) Hauer SSP2
- Today (2025)
- 995,758 people
- By 2030
- 1,009,124 · +1.3%
- By 2040
- 1,028,128 · +3.3%
- By 2050
- 1,040,066 · +4.4%
- By 2075
- 1,057,849 · +6.2%
- By 2100
- 1,039,774 · +4.4%
Race, ethnicity, and origin ACS 2023
- Neighborhood character
- Predominantly Black (91%)
- Race & ethnicity
- Black 91% Two or more races 3% White 3% Hispanic / Latino 3%
- Common ancestry
- Norwegian 1%
- Foreign-born
- 1% · Canada
- Languages at home
- 97% English-only · Spanish 2%
Political lean MEDSL · Milwaukee
- 2024 margin
- Solid D (+38.5) · D 68.3% · R 29.8% · Other 1.8%
- 2008→2024 swing
- +2.7pp toward D · 2008: 35.9pp · 2024: 38.5pp
- All cycles
- 2024: D+38.5 2020: D+39.9 2016: D+37.5 2012: D+34.6 2008: D+35.9
Not yet ingested
- Civics
- —
Market trends
- HPI YoY
- ▲ 133.03%
- Current HPI
- 397.7151
- Rent YoY
- ▲ 8.28%
- Metro
- Milwaukee-Waukesha, WI
- State GDP YoY
- ▲ 2.10%
- F500 in state
- 20
Industry mix (Fortune 500 HQ in WI)
| Industry | F500 HQs | Revenue |
|---|---|---|
| Industrial Machinery | 4 | $23B |
|
||
| Industrial Technology | 2 | $36B |
|
||
| Insurance | 1 | $36B |
|
||
| Professional Services | 1 | $19B |
|
||
| Utilities | 1 | $9B |
|
||
| Consumer Goods | 1 | $3B |
|
||
Price history
+324.4% since first listed6 events — show timeline
- 2026-06-12 Listed $154,900 METROMLS
- 2026-03-20 Sold (Public Records) $60,000 Public Records
- 2025-11-04 Sold (Public Records) $70,000 Public Records
- 2024-03-21 Listing Removed — METROMLS
- 2024-03-13 Contingent — METROMLS
- 2024-03-12 Listed $36,500 METROMLS
Property tax history
-4.9%/yrLatest (2024): $1,379 · -60.7% YoY. Source: county tax records.
Cash-flow waterfall
monthlySold comps — $/sqft
last 12 mo · ≤1 miLoading sold comps…