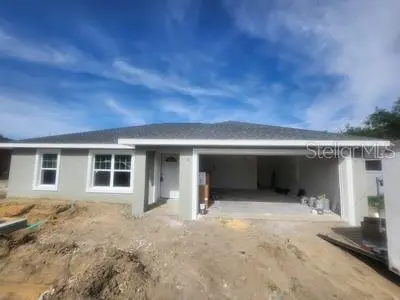
13790 SE 40th Ct · Belleview, FL
Flood risk 1/10 · Minimal
- FEMA flood zone
- X (unshaded)
- Chance of flooding over 30 yrs
- 0.0%
- Est. flood insurance / yr
- $507 – $1,088
Fire risk 3/10 · Minor
- Est. fire insurance / yr
- $947 – $1,759
Heat risk 8/10 · Major
- Hot days now (above 108°F)
- 7 days/yr
- Hot days in 30 yrs
- 21 days/yr
Wind risk 9/10 · Severe
- Chance of severe wind over 30 yrs
- 99.0%
Air-quality risk 3/10 · Minor
- Unhealthy air days now
- 3 days/yr
- Unhealthy air days in 30 yrs
- 4 days/yr
Risk factors via First Street. Map © Google.
Why this score? — see what drove the F grade
The composite is a weighted blend of 9 inputs, each scored 0–100. Each bar is that input's sub-score; the figure is the points it added to the 100-point composite (weight × sub-score).
- Cash flow +7.7/30.0
- Schools +3.6/10.0
- Livability +3.5/5.0
- Rent growth +2.5/5.0
- Condition / age +2.5/5.0
- 1% rule +2.3/10.0
- DSCR +1.8/10.0
- ARV discount +1.6/15.0
- Appreciation +0.0/10.0
$259,999
🖨 Deal sheet (PDF) 📄 Offer letter ✓ Due diligence
Listing remarks MLS
Under Construction. Look no further. This 2026 NEW block home in Belleview Heights Estates is the one GREAT price, price to sell. Vinyl fence. Close to shopping, hotels, hospital, restaurants, Lake Weir. Just minutes from The Villages. Easy access to Hwy 75/Turnpike.
Key facts
- Close to hospital
- Close to restaurants
- Close to lake weir
Tags
Neighborhood map
What this means for you Summary
Snapshot
- This is a 3-bed/2.0-bath land listed at $260k.
Deal economics
- At list price, monthly cash flow is $-304 ($-4k/yr) — negative.
- To cash-flow at today's rent, offer at most $216k (16.9% below list).
- To meet the 1% rule (rent ≥ 1% of price), the offer needs to be $189k (27.3% below list).
- Recommended offer: $189k (27.3% below list) — sets the bar for 1% rule.
Location & tenants
- Location reads 69/100 on livability (#458 in FL) — a middle-class / working-renter tenant base. Strengths: cost of living A+, housing A+, health & safety A+; Watch: crime F, amenities F, commute F.
- Marion (rural): math 42% / reading 43% proficiency, ranked #61 of 73 in FL (top 84%) — families likely to look elsewhere, expect single-tenant / working-renter base with shorter leases; 61% free/reduced lunch — lower-income household profile, screen leases tightly.
- Zoned schools: Belleview-Santos Elementary School (math 41% / reading 41%, grade F, #1,454 of 2,144 statewide, top 69%, 570 students, 66% FRL); Belleview Middle School (math 49% / reading 50%, grade C, #259 of 571 statewide, top 46%, 1,573 students, 60% FRL); Belleview High School (math 31% / reading 46%, grade F, #321 of 667 statewide, top 49%, 1,783 students, 56% FRL) — zoned schools at 61% FRL track the district average.
- Market conditions: 713 active listings in the ZIP; 9 comparable units currently listed for rent nearby; rentals at typical pace (median 23d on market — plan ~3-4 weeks tenant-placement turnaround); 7,071 units permitted in Marion County in 2024 (534 in 5+ unit buildings).
- This rent runs 34% of the median local income ($67k/yr) — at the standard rent-burdened threshold; future hikes will face affordability resistance.
Forward outlook
- Local home prices are declining (-3.0%/yr); year-one equity from $2k of loan paydown is wiped out by about $8k of value loss. Plan a longer hold.
- Marion County population projected at +13% by 2050 — modest demand growth; plan on rents tracking national, not racing it.
Negotiation context
- It's been on market 80 days — a 6% lower offer ($244k) is reasonable based on typical stale-listing flexibility.
Risks & watch-outs
- Climate carrying-cost: severe wind risk, 99% chance of damaging wind over 30y; extreme-heat days projected 7→21/yr by 2055 (HVAC capex compounding) — expect insurance premiums to compound above CPI over the hold.
Questions for the listing agent
- What do current leases actually rent for vs. the listed asking? Can we see a recent rent roll and the last 12 months of T-12 income?
- It's been on market 80 days. Have you received any prior offers? Is the seller open to a 27% concession, seller financing, or rate buy-down credit?
- Why hasn't it sold? Are there any deal-killer items the seller is aware of (foundation, flood, title, zoning, code violations)?
- Is there a deadline driving the sale (1031 exchange, divorce, estate, relocation)? That informs how much negotiation room exists.
- Schools are D-rated, which usually means shorter tenancies and higher turnover. Who's the typical renter profile here, and what's been the actual vacancy rate?
- Crime grade is F in this area — have there been break-ins, vandalism, or insurance claims at this property in the last 3 years? What carrier currently insures it and at what premium?
- The area grade is low — what's the realistic commute time and amenity access for the typical tenant pool here? Any planned neighborhood developments (good or bad) we should know about?
- What's the average days-on-market for RENTAL listings here right now (not sales)? A rising rental-DOM trend means longer vacancies and softer asking-rent achievability than the comps imply.
- What's the recent tenant-quality profile in this submarket — average credit score on applications, eviction rate, late-payment / NSF rate, and stable-employment percentage? A property-management company in the area should have these aggregated.
- How much new for-sale + rental construction is in the pipeline within 1–3 miles? Heavy new supply typically softens prices + rents 12–24 months out; constrained supply supports both.
Investment metrics
- 1% rule
- 0.73% ✗
- Cap rate
- 4.89%
- Cash-on-cash
- -5.01%
- DSCR
- 0.78
- GRM
- 11.5
CMA / ARV
- ARV (median comp)
- $229,932
- List price
- $259,999
- Delta
- 13.08%
- Verdict
- OVERPRICED
- Comps
- 20 within 1.0 mi
Projected returns pro-forma
-3.0% appreciation · 3.0% rent growth · sell at horizon
- IRR
- -24.8%
- Equity multiple
- 0.16×
- Total profit
- $-61,464
- Equity at exit
- $38,767
- IRR
- -20.5%
- Equity multiple
- -0.08×
- Total profit
- $-78,337
- Equity at exit
- $22,480
Cash invested: $72,800 (down + closing). Projections, not guarantees.
Landlord ↔ Tenant lean methodology
- Overall (STATE)
- 87 Strongly Landlord-Friendly
- State Florida
- 87 Strongly Landlord-Friendly · R+3
- County
- — inherits STATE
- City
- — inherits STATE
ZIP-level market 34491
- Home prices YoY
- -35.0%
- Active inventory
- 713
- Price-to-rent
- 11.5×
Monthly cashflow live
- Estimated rent
- $1,890 high interval (Pro) →
- Mortgage (P&I)
- −$1,363
- Tax est. 1.5%
- −$325 /mo · $3,900/yr
- Insurance
- −$108
- HOA
- −$0
- Vacancy / Maint / Mgmt
- −$397
- Net cashflow
- $-304
Break-even live
Sensitivity live
| Price | -10% $-124 | -5% $-214 | +0% $-304 | +5% $-394 | +10% $-484 |
|---|---|---|---|---|---|
| Rent | -10% $-453 | -5% $-379 | +0% $-304 | +5% $-229 | +10% $-155 |
| Rate | -1.0pp $-173 | -0.5pp $-238 | base $-304 | +0.5pp $-371 | +1.0pp $-440 |
UW: 25.0% down · 7.5% · 30yr · 1.5% tax · 5.0% vac · 8.0% maint · 8.0% mgmt
Financing live
Cash to close
- Down payment
- $65,000
- Closing costs
- $7,800
- Reserves months
- —
- Total cash needed
- —
Loan-product check · same deal, 3 products live
Conventional
25% down · 7.5% · 30yr
- Down + closing
- —
- Monthly P&I
- —
- Monthly cashflow
- —
- DSCR
- —
- Eligible?
- —
Personal DTI + credit; lowest rate.
DSCR
20% down · 8.5% · 30yr
- Down + closing
- —
- Monthly P&I
- —
- Monthly cashflow
- —
- DSCR
- —
- Eligible?
- —
No personal income docs; deal must DSCR.
Hard money
10% down · 12.0% · 12mo
- Down + closing
- —
- Monthly P&I
- —
- Monthly cashflow
- —
- DSCR
- —
- Eligible?
- —
Short-term bridge; refi at stabilization.
Rent comps 9 comps
| Address | Beds | Baths | Sqft | Rent | $/sqft | DOM | Units | Dist |
|---|---|---|---|---|---|---|---|---|
| 3820 SE 136th Pl Summerfield, FL | 3.0 | 2.0 | 1265 | $1,745 | $1.38 | 23d | 1 | 0.20mi |
| 3780 SE 141st Ln Summerfield, FL | 3.0 | 2.0 | 1066 | $1,525 | $1.43 | 15d | 1 | 0.46mi |
| 3780 SE 141st Ln Summerfield, FL | 3.0 | 2.0 | 1066 | $1,595 | $1.50 | 23d | 1 | 0.46mi |
| 3934 SE 142nd St Summerfield, FL | 3.0 | 2.0 | 1000 | $1,499 | $1.50 | 15d | 1 | 0.48mi |
| 3384 SE 138th St Summerfield, FL | 3.0 | 2.0 | 1265 | $1,745 | $1.38 | 23d | 1 | 0.56mi |
| 13609 SE 53rd Ave Summerfield, FL | 3.0 | 2.0 | 1270 | $1,940 | $1.53 | 23d | 1 | 1.22mi |
| 13705 SE 54th Ct Summerfield, FL | 3.0 | 2.0 | 1416 | $1,895 | $1.34 | 23d | 1 | 1.33mi |
| 14025 SE 54th Ct Summerfield, FL | 2.0 | 1.5 | 1008 | $1,500 | $1.49 | 15d | 1 | 1.35mi |
| 13678 SE 55th Ave Summerfield, FL | 3.0 | 2.0 | 960 | $1,499 | $1.56 | 23d | 1 | 1.36mi |
Listing history 17 events
-
2026-06-21days on market $259,999 Active 80 DOM
-
2026-06-18days on market $259,999 Active 77 DOM
-
2026-06-17days on market $259,999 Active 76 DOM
-
2026-06-16days on market $259,999 Active 75 DOM
-
2026-06-15days on market $259,999 Active 74 DOM
-
2026-06-14days on market $259,999 Active 72 DOM
-
2026-06-13days on market $259,999 Active 71 DOM
-
2026-06-10days on market $259,999 Active 69 DOM
-
2026-06-09days on market $259,999 Active 68 DOM
-
2026-06-08days on market $259,999 Active 67 DOM
-
2026-06-07days on market $259,999 Active 66 DOM
-
2026-06-03days on market $259,999 Active 62 DOM
-
2026-06-02days on market $259,999 Active 61 DOM
-
2026-06-01days on market $259,999 Active 60 DOM
-
2026-05-31days on market $259,999 Active 59 DOM
-
2026-05-30days on market $259,999 Active 58 DOM
-
2026-04-02$259,999 Active 267-char remark
Show marketing remark (267 chars)
Under Construction. Look no further. This 2026 NEW block home in Belleview Heights Estates is the one GREAT price, price to sell. Vinyl fence. Close to shopping, hotels, hospital, restaurants, Lake Weir. Just minutes from The Villages. Easy access to Hwy 75/Turnpike.
ⓘ Source: listings_history table (triggers on properties + properties_extension) + one-shot
backfill from property_details.listing_events for pre-trigger history.
Climate risk First Street
- Flood 1/10 Low FEMA zone X (unshaded) · 0% chance over 30 yrs
- Wildfire 3/10 Moderate
- Heat 8/10 Severe 7 d/yr ≥108°F today · 21 d/yr by 30 yrs out
- Wind 9/10 Extreme 99% chance of damaging wind over 30 yrs
- Air quality 3/10 Moderate 3 unhealthy d/yr today · 4 by 30 yrs out
Nearby sold comps map
Loading sold comps map…
Walkable amenities ~0.75 mi
Loading nearby amenities…
Taxation est. · year 1
- Rental income
- $22,675
- − Mortgage interest
- −$14,564
- − Property taxes
- −$3,900
- − Insurance
- −$1,300
- − Repairs & maintenance
- −$1,814
- − Management
- −$1,814
- − Depreciation
- −$7,564
- Taxable loss
- −$8,280
- Est. tax savings @ 24.0%
- +$1,987
- After-tax cash flow
- $-1,661/yr
For passive investors: Depreciation is non-cash, so a rental often shows a tax loss while cash-flowing — sheltering income. Rental losses are passive: they offset passive income freely, and up to $25,000/yr can offset ordinary (W-2) income if you actively participate and your MAGI is under $100k (phasing out to $0 by $150k); unused losses carry forward. On sale, claimed depreciation is recaptured at up to 25%, and gains may owe capital-gains tax (a 1031 exchange can defer both). Figures are a year-1 estimate at your 24.0% rate — not tax advice; consult a CPA.
Schools (NCES district)
- District
- Marion
- NCES district ID
- 1201260
- Math proficiency
- 42% ▼ -7.00%
- Reading proficiency
- 43% ▼ -4.00%
- Median HH income
- $40,015
- Composite
- 35.61/100
- National rank
- #4890
- State rank
- #61 of 73 in FL
Livability — Belleview
- Score
- 69/100
- State rank
- #458
- US rank
- #8314
Category grades
Schools grade is shown separately in the Schools card above.
Census & demographics
- County
- Marion County · 315,796 people
- City population
- 19,167
- Metro
- Ocala, FL
- Population (ZIP)
- 33,318
- Household income
- $66,679
- Rent vs Own
- Severe rent burden
- 256.0
Population outlook (Marion County) Hauer SSP2
- Today (2025)
- 365,905 people
- By 2030
- 376,768 · +3.0%
- By 2040
- 396,555 · +8.4%
- By 2050
- 412,723 · +12.8%
- By 2075
- 446,090 · +21.9%
- By 2100
- 436,193 · +19.2%
Race, ethnicity, and origin ACS 2023
- Neighborhood character
- Predominantly White (77%)
- Race & ethnicity
- White 77% Hispanic / Latino 14% Two or more races 9% Black 4% Asian 2%
- Hispanic origin (detail)
- Mexican 3% Puerto Rican 6% Cuban 1%
- Common ancestry
- Lithuanian 3% Slovak 2% Romanian 2%
- Foreign-born
- 8% · Canada, Vietnam, Jamaica
- Languages at home
- 85% English-only · Spanish 11% Vietnamese 1% French/Haitian/Cajun 1%
Political lean MEDSL · Marion
- 2024 margin
- Solid R (+31.6) · D 33.8% · R 65.5%
- 2008→2024 swing
- -20.0pp toward R · 2008: -11.6pp · 2024: -31.6pp
- All cycles
- 2024: R+31.6 2020: R+25.9 2016: R+26.2 2012: R+16.2 2008: R+11.6
Not yet ingested
- Civics
- —
Market trends
- HPI YoY
- ▼ -107.67%
- Current HPI
- 200.0792
- Rent YoY
- —
- Metro
- Ocala, FL
- State GDP YoY
- ▲ 3.28%
- F500 in state
- 36
Industry mix (Fortune 500 HQ in FL)
| Industry | F500 HQs | Revenue |
|---|---|---|
| Industrial Technology | 2 | $29B |
|
||
| Insurance | 2 | $17B |
|
||
| Retail | 1 | $60B |
|
||
| Technology Distribution | 1 | $58B |
|
||
| Homebuilding | 1 | $35B |
|
||
| Technology Manufacturing | 1 | $35B |
|
||
Price history
1 event — show timeline
- 2026-04-02 Listed $259,999 Stellar MLS as Distributed by MLS Grid
Cash-flow waterfall
monthlySold comps — $/sqft
last 12 mo · ≤1 miLoading sold comps…